Biology 9700/42 — October/November 2025
Cambridge A-Level · A Level Structured Questions · worked solutions for every part, with the mark scheme
Topics Energy and Respiration · Control and Coordination · Inheritance · Selection and Evolution · Genetic Technology · Homeostasis · +2 more
Rice, Oryza sativa, is a crop plant that has adapted to grow in flooded fields.
Fig. 1.1 outlines the effects on rice plants of growing in flooded fields.
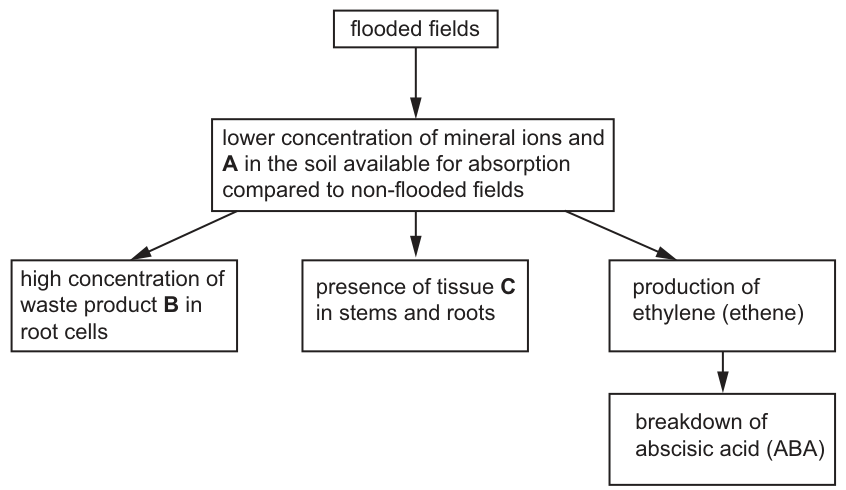
With reference to Fig. 1.1, name:
substance A = ______
substance B = ______
tissue C = ______
Answer
- substance A = oxygen
- substance B = ethanol
- tissue C = aerenchyma
A = oxygen; B = ethanol; C = aerenchyma
Background Concept
Rice (Oryza sativa) is a semi-aquatic crop that thrives in the flooded paddy fields where most other crops would suffocate. Three connected adaptations make this possible.
- Low oxygen in flooded soils. Oxygen diffuses about 10 000 times more slowly through water than through air, so once the soil pores are filled with water the O₂ supply to root cells is cut off. The roots are forced to switch to anaerobic respiration, which in plant cells produces ethanol (and CO₂) rather than the lactate made by animal cells.
- A toxic waste product. Ethanol is harmful: it denatures proteins and disrupts membrane integrity. Rice roots synthesise ethanol dehydrogenase to detoxify it (see part (b)).
- Aerenchyma. This is a spongy parenchyma tissue full of large interconnected air spaces. In rice, aerenchyma runs continuously from the leaves, through the stems, down into the roots. It acts as an internal snorkel, letting O₂ (from photosynthesis or from the atmosphere) diffuse down to the submerged tissues, while waste gases (CO₂, methane, ethylene) diffuse out.
Understanding the Question
The flow chart (Fig. 1.1) labels three unknowns, A, B and C. With reference to it we must name:
- A — a substance whose soil concentration falls in flooded fields (something normally absorbed from aerated soil).
- B — a waste product that builds up inside root cells under flooded conditions.
- C — a tissue found in stems and roots, whose presence is linked to flooding.
Approach
Think about (i) what is missing in waterlogged soil, (ii) what plant cells produce when oxygen is scarce, and (iii) what internal plumbing rice uses to keep its tissues supplied with air.
Step-by-Step Reasoning
- A = oxygen. Water displaces air from soil pores, so the O₂ concentration around the root surface falls. The root cells' aerobic respiration is therefore impaired.
- B = ethanol. With no O₂, glycolysis can still run, but pyruvate cannot enter the link reaction / Krebs cycle. Plant cells instead decarboxylate pyruvate to acetaldehyde (releasing CO₂) and then reduce the acetaldehyde to ethanol, regenerating NAD⁺ so that glycolysis can continue. Ethanol is therefore the characteristic waste product of anaerobic respiration in plant cells.
- C = aerenchyma. This air-filled parenchyma forms in stems and roots of rice and provides a low-resistance internal pathway for O₂ to reach submerged tissues and for gases to escape.
Key Takeaways
- Rice survives waterlogging through both anatomical (aerenchyma) and biochemical (anaerobic respiration to ethanol) adaptations.
- Anaerobic respiration in plant cells yields ethanol, not lactate (the animal pathway).
- Aerenchyma is the diagnostic tissue of aquatic and semi-aquatic plants.
Common Mistakes
- Writing "lactate" instead of "ethanol" for substance B — that is the animal pathway, not the plant one.
- Naming "xylem" or "phloem" for tissue C — these are vascular tissues, not the air-filled aerenchyma.
- Confusing aerenchyma with the spongy mesophyll of a leaf.
Things to Be Careful About
- The question says "with reference to Fig. 1.1" — each answer must be deducible from the flow chart's flooded-field scenario plus your prior knowledge of rice biology.
- "Aerenchyma" must be spelled correctly; misspellings are not credited.
Answer
Root cells respond by producing the enzyme ethanol dehydrogenase, which breaks down the ethanol.
Ethanol dehydrogenase breaks down the ethanol.
Background Concept
Ethanol is a toxic waste product: at high intracellular concentrations it denatures proteins and disrupts membrane integrity. Plant cells that perform anaerobic respiration must therefore dispose of the ethanol as it is made. The key enzyme is ethanol dehydrogenase (also accepted: alcohol dehydrogenase), which catalyses:
The acetaldehyde can then be further oxidised to acetate and fed into normal metabolism. By keeping the ethanol concentration low, this enzyme prevents self-poisoning of the root cell.
Understanding the Question
"Substance B" was identified as ethanol in part (a). The question asks how the root cells respond to a high concentration of ethanol — i.e., what molecular/enzymatic mechanism they use to deal with it. The mark scheme rewards a single creditable point: the name of the enzyme that breaks ethanol down.
Approach
Recall the specific enzyme that detoxifies ethanol in plant cells and state it clearly. No further reasoning is needed for the mark.
Step-by-Step Reasoning
- Root cells exposed to flooding produce large amounts of ethanol by anaerobic respiration.
- They respond by synthesising ethanol dehydrogenase, which catalyses the breakdown of ethanol into acetaldehyde.
- This keeps the intracellular ethanol concentration below toxic levels, so the root cells continue to function (even if only anaerobically).
Key Takeaways
- Anaerobic respiration is a controlled process: even in O₂ deficiency the cell is not simply accumulating waste.
- Many toxic small molecules in cells are handled by a specific dehydrogenase.
Common Mistakes
- Saying the cells "store" the ethanol or "release it into the soil" — neither is the mark-scheme answer.
- Naming the wrong enzyme, e.g. pyruvate dehydrogenase (this operates in aerobic respiration).
- Spelling "ethanol" as "ethanal" (ethanal is acetaldehyde — a different molecule).
Things to Be Careful About
- The mark scheme accepts either ethanol dehydrogenase or alcohol dehydrogenase — both are valid names for the same enzyme.
Gibberellin is involved in the growth of stems in rice plants.
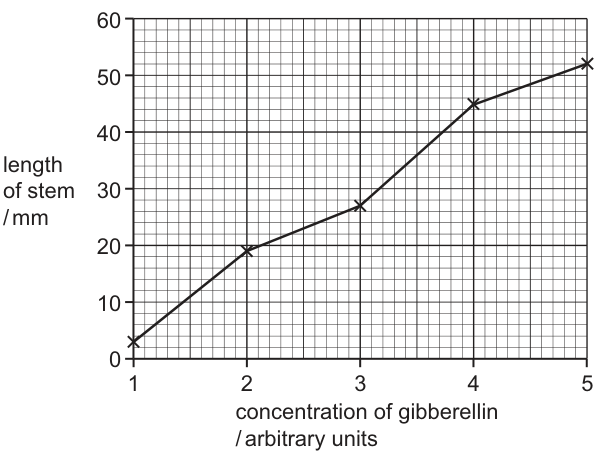
Fig. 1.2 shows the effect of gibberellin concentration on the length of stems in rice plants.
Answer
As the concentration of gibberellin increases, the length of the stem increases — there is a positive correlation between gibberellin concentration and stem length.
Data quote: at a gibberellin concentration of 1 arbitrary unit, the stem length is 3 mm; at 4 arbitrary units, the stem length is 45 mm.
Positive correlation; e.g. at 1 au stem = 3 mm and at 4 au stem = 45 mm.
Background Concept
Gibberellin is a plant hormone that promotes stem elongation. It does so by stimulating cell elongation in the internodes — partly by activating enzymes that loosen the cell wall, and partly by triggering the breakdown of DELLA repressor proteins in the gibberellin signalling pathway. The overall effect is longer stems.
Fig. 1.2 plots stem length (y-axis) against gibberellin concentration (x-axis). The shape of the curve tells us about the dose–response relationship between the hormone and the growth response.
Understanding the Question
The command word is describe. For a graph this routinely requires two things:
- the trend (direction and shape of the relationship), and
- a data quote — at least two specific (x, y) values with their units — that supports the trend.
The mark scheme gives one mark for each.
Approach
- Read the axes carefully: x = gibberellin concentration in arbitrary units (au), y = stem length in mm.
- Identify the direction of the relationship.
- Read off two clear (concentration, length) pairs from the printed curve.
Step-by-Step Reasoning
- The curve rises from left to right: as the x-value increases, the y-value also increases. This is a positive correlation (an equivalent way of saying "as gibberellin concentration increases, stem length increases").
- For the data quote, pick two points that are easy to read off the grid. For example:
- at 1 au, stem length = 3 mm
- at 4 au, stem length = 45 mm
- These two values demonstrate the rise (from 3 to 45 mm) as the gibberellin concentration increases (from 1 to 4 au).
(Note: the mark scheme's own table rounds the right-most point to 52 mm; the printed curve in the original paper passes through 53 mm at x = 5. Either value is consistent with the accepted ± 0.5 mm reading tolerance.)
Key Takeaways
- A "describe" question on a graph always needs both (1) a trend statement and (2) a data quote with units.
- "Positive correlation" is a precise alternative to "as X increases, Y increases".
- Dose–response curves do not have to be straight lines — the curve in Fig. 1.2 is non-linear (a steepening section between 3 and 4 au).
Common Mistakes
- Stating only the trend and forgetting the data quote (loses the second mark).
- Quoting data without units — the units are part of the credit.
- Saying the relationship is "directly proportional". That would require a straight line through the origin; the curve in Fig. 1.2 is not. "Positive correlation" is the safe description.
Things to Be Careful About
- The y-axis unit is mm; the x-axis unit is arbitrary units (au). Both must be quoted.
- Use values you can actually read off the printed curve; do not invent intermediate values.
- The CIE mark scheme quotes length to ± 0.5 mm — read off to the nearest gridline.
ABA in rice plant cells inhibits the action of gibberellin.
With reference to Fig. 1.1 and Fig. 1.2, explain the importance of ethylene production for the growth of rice plants in flooded fields.
Answer
- Ethylene causes the breakdown of ABA (Fig. 1.1), so gibberellin is no longer inhibited and becomes active / functional.
- As a result, the rice plants grow taller (longer stems / increased internodal length) (Fig. 1.2 shows gibberellin promotes stem elongation).
- This holds the leaves and flowers above the water, so they can carry out photosynthesis (access to light and CO₂) and reproduction / gas exchange can occur.
Ethylene breaks down ABA → gibberellin becomes active → stems elongate → leaves/flowers above water → photosynthesis can occur.
Background Concept
This question weaves together three plant hormones — ethylene, abscisic acid (ABA) and gibberellin — and the overall biology of why rice can grow in flooded fields.
- Ethylene is a gaseous plant hormone. In waterlogged plants it triggers a suite of adaptive responses, including aerenchyma formation, leaf epinasty and internodal elongation. In this question the relevant effect is that ethylene causes the breakdown of ABA (Fig. 1.1).
- ABA is generally a growth-inhibiting hormone — it is best known for closing stomata during drought, but it also slows growth. The question stem tells us explicitly that ABA inhibits the action of gibberellin in rice cells.
- Gibberellin promotes stem elongation (Fig. 1.2): the higher the gibberellin concentration, the longer the stem.
In flooded rice the three hormones therefore act in a cascade: ethylene removes the brake (ABA), so the accelerator (gibberellin) can act, and the plant grows tall enough to keep its leaves and flowers above the water surface. This is essential because photosynthesis requires light and gas exchange, and reproduction requires pollination of the flowers — all of which are compromised under water.
Understanding the Question
The command word is explain, and the stem explicitly asks us to use both Fig. 1.1 and Fig. 1.2 to set out why ethylene production is important to rice in flooded fields. We need a causal chain: each link follows from the previous one. The mark scheme gives up to four link-points and credits any three of them.
Approach
Start at the right-hand side of the Fig. 1.1 flow chart (ethylene → ABA breakdown), join it to Fig. 1.2 (gibberellin → stem elongation), then link the whole cascade to the plant-level outcome (leaves/flowers above water so photosynthesis, gas exchange or reproduction can occur).
Step-by-Step Reasoning
- Ethylene breaks down ABA (Fig. 1.1). Flooded rice produces ethylene, and ethylene in turn causes the breakdown of ABA in the plant cells.
- Gibberellin becomes active. Because ABA inhibits gibberellin, removing ABA releases gibberellin from inhibition. Fig. 1.2 shows that active gibberellin promotes stem elongation: the higher the gibberellin concentration, the longer the stem.
- The plant grows tall. With its brake removed, gibberellin drives stem and internode elongation, so the rice plant is taller than it would otherwise be.
- Leaves and flowers are held above the water. A taller plant keeps its photosynthetic and reproductive organs out of the flood water.
- Photosynthesis / gas exchange / reproduction can occur. Above the water, leaves receive sunlight and CO₂ for photosynthesis, and the flowers are accessible for pollination. Below the water, light is filtered out and gaseous diffusion is very slow, so these processes would fail.
The mark scheme credits any three of these links; the strongest answer carries the chain all the way from "ethylene → ABA breakdown" through to "photosynthesis can occur".
Key Takeaways
- Plant hormones rarely act in isolation: ethylene, ABA and gibberellin interact so that one (ethylene) removes the inhibition (ABA) on another (gibberellin), and the combined effect is an adaptive response to flooding.
- The same hormone (ABA) can have multiple roles depending on context (drought-induced stomatal closure vs inhibition of stem growth).
- A hormone response is only biologically meaningful if it solves a problem at the whole-organism level — here, keeping the photosynthetic and reproductive organs above water.
Common Mistakes
- Saying "ethylene makes the plant grow tall" directly — the mark scheme requires the intermediate step that ethylene breaks down ABA, which then allows gibberellin to act.
- Treating ABA and gibberellin as if they act in the same direction — they are opposing hormones in this context.
- Forgetting to link stem elongation to the adaptive outcome (leaves/flowers above the water for photosynthesis).
- Confusing ethylene (a gas; promotes ripening, abscission, and — here — flood-adapted elongation) with ethene (an older name for the same molecule). CIE uses "ethylene".
Things to Be Careful About
- The question requires reference to Fig. 1.1 and Fig. 1.2. A good answer explicitly mentions ABA breakdown (from the flow chart) and the gibberellin dose–response (from the graph).
- "Stems increase in length" is the mark-scheme language; "the plant grows" on its own is too vague and is not credited.
- Stay on the "so…" causal chain: each step should follow logically from the previous one.
Explain the terms gene, genotype and phenotype.
gene = ______
genotype = ______
phenotype = ______
Answer
gene — a section of DNA / sequence of (DNA) bases that codes for a (specific) polypeptide.
genotype — all the alleles possessed by an organism / the (two) alleles of one gene.
phenotype — the observable features / characteristics / traits / appearance of an organism.
gene = section of DNA coding for a polypeptide; genotype = all the alleles of an organism; phenotype = observable features of an organism.
Background Concept
Three of the most fundamental terms in genetics are gene, genotype and phenotype. They form a logical chain:
- A gene is the unit of inheritance. In molecular terms it is a length of DNA whose sequence of bases is read (transcribed and translated) to produce a specific polypeptide, which may function as part of a protein. A gene therefore has a defined location (locus) on a chromosome, and can exist in different versions called alleles.
- The genotype is the set of alleles an organism carries. For any one gene the genotype is conventionally written as the two alleles present (e.g. AA, Aa or aa) — one inherited from each parent on homologous chromosomes.
- The phenotype is what you can actually see or measure about the organism — its morphology, physiology, behaviour, or any other observable characteristic. The phenotype results from the interaction of the genotype with the environment, but for a single-gene Mendelian trait we describe it simply as the visible expression (e.g. tall, short, smooth, wrinkled).
Understanding the Question
Part (a) is a pure recall item. The command word explain (in the sense of define here) requires one precise sentence per term, using the CIE-accepted wording so each mark is secured. There is no diagram or calculation needed.
Approach
For each term, give the textbook definition in its shortest, most accurate form. The mark scheme rewards:
- "gene" — a section of DNA / sequence of bases coding for a (specific) polypeptide
- "genotype" — all the alleles / the (two) alleles of one gene
- "phenotype" — observable features / characteristics (of an organism)
Step-by-Step Reasoning
- Gene — The mark scheme's key idea is the link between a piece of DNA and the polypeptide it specifies. Saying merely "a piece of DNA" or "a unit of inheritance" is too vague and may not earn the mark; the function (coding for a polypeptide) is what makes the definition complete.
- Genotype — The mark scheme accepts either "all the alleles of an organism" or, more narrowly, "the (two) alleles of one gene". A common error is to confuse this with the phenotype or to write only the letters (e.g. "Aa") without saying they represent alleles.
- Phenotype — Acceptable answers include features, characteristics, traits or appearance. The qualifier "observable" is what distinguishes phenotype from genotype, which is the genetic constitution itself and not directly seen.
Key Takeaways
- gene → DNA → polypeptide
- genotype → the alleles an organism has
- phenotype → what an organism looks/appears like
Common Mistakes
- Defining a gene as "a unit of inheritance" without mentioning DNA or a polypeptide product — loses the molecular precision the mark scheme wants.
- Confusing genotype with phenotype, or describing the genotype as "the genes an organism has" rather than its alleles.
- Describing the phenotype as the alleles or the DNA, rather than the observable outcome.
Things to Be Careful About
- The CIE mark scheme accepts "features / characteristics / traits / appearance" interchangeably for phenotype — any one of these is fine, but do not use vague terms such as "looks" without further qualification.
- Spelling of "phenotype" and "genotype" is occasionally marked; ensure the endings are correct.
A monohybrid genetic cross can be carried out to produce an F1 and an F2 generation.
- Outline how a monohybrid genetic cross is carried out.
- State the expected percentage of each of the different offspring genotypes in the F2 generation.
Assume that the inheritance pattern is for autosomal dominant and recessive alleles.
Answer
Outline of the monohybrid cross:
- Select parents that are true-breeding (homozygous). Cross a homozygous dominant parent (AA) with a homozygous recessive parent (aa).
- The F1 offspring produced are all heterozygous (Aa) and display the dominant phenotype.
- Cross two F1 heterozygotes (Aa × Aa) — or self-pollinate an F1 plant — to produce the F2 generation.
F2 expected genotype percentages (from a Punnett square of Aa × Aa):
| Gametes | A | a |
|---|---|---|
| A | AA | Aa |
| a | Aa | aa |
- 25% homozygous dominant (AA)
- 50% heterozygous (Aa)
- 25% homozygous recessive (aa)
(Genotype ratio 1 : 2 : 1)
F2 genotypes: 25% AA, 50% Aa, 25% aa (1 : 2 : 1).
Background Concept
A monohybrid cross follows the inheritance of a single gene, where each parent contributes one of two alleles (one dominant, one recessive). Gregor Mendel's experimental design — start with true-breeding parents, generate an F1, then cross the F1 to obtain an F2 — reveals the segregation of alleles at meiosis and the re-emergence of the recessive phenotype in F2. The classic F2 genotypic ratio is 1 : 2 : 1 (AA : Aa : aa) and the phenotypic ratio is 3 : 1 (dominant : recessive).
Key terms to keep clear:
- Homozygous: two identical alleles at a locus (AA or aa).
- Heterozygous: two different alleles at a locus (Aa).
- Dominant allele (A): expressed in the phenotype even when paired with a recessive allele.
- Recessive allele (a): only expressed in the phenotype when homozygous (aa).
Understanding the Question
Part (b) has two components:
- Outline the procedure of a monohybrid cross (the breeding strategy, generation by generation).
- State the F2 genotype percentages under simple autosomal dominant/recessive inheritance.
The command words are outline (give the key steps in logical order) and state (give the value). Both require the mark-scheme points, in the right order, with no padding.
Approach
The strategy is the textbook Mendelian sequence:
- Start with homozygous parents of contrasting phenotypes (AA × aa).
- Read off the F1 — all heterozygotes displaying the dominant phenotype.
- Cross F1 × F1 to get F2.
- Apply a Punnett square to deduce the F2 genotype proportions.
The mark scheme awards four marks for the outline (any four of the listed points) and one mark for the F2 percentages.
Step-by-Step Reasoning
Outline (any four of the following points):
- Mate/breed/cross homozygous parents. True-breeding individuals are essential so that the parental genotypes are known with certainty.
- Cross a dominant parent with a recessive parent. This sets up the contrasting phenotypes that will reveal which allele is dominant.
- To produce the F1 generation. The F1 are all the direct offspring of the P-generation cross.
- The F1 are all heterozygotes. Each F1 inherits one A from the dominant parent and one a from the recessive parent, so every F1 is Aa.
- Cross the F1 (or self an F1 plant) to produce the F2. The F2 is the second filial generation; it reveals segregation of the two alleles.
F2 percentages (one mark, but with three required elements):
A Punnett square for Aa × Aa gives four equally likely boxes:
| Gametes | A | a |
|---|---|---|
| A | AA | Aa |
| a | Aa | aa |
That is 1 AA : 2 Aa : 1 aa, which converts to 25% AA, 50% Aa, 25% aa. All three proportions must be stated for the mark.
Note: the corresponding phenotypic ratio is 3 dominant : 1 recessive, but the question specifically asks for genotype percentages.
Key Takeaways
- A monohybrid cross begins with homozygous parents of contrasting phenotypes.
- F1 are uniformly heterozygous; F2 shows segregation with a 1:2:1 genotypic ratio.
- Each genotypic class is a quarter (25%) of the F2; heterozygotes, being two of the four boxes, are 50%.
- The 3:1 phenotypic ratio follows automatically from dominance but is not what the question asks for here.
Common Mistakes
- Crossing F1 with a parent (a back-cross or test cross) instead of F1 × F1 — this is a different experiment and would not give the 1:2:1 ratio.
- Stating the F2 phenotype percentages (75% dominant, 25% recessive) when the question asks for genotype percentages — common slip; re-read the stem.
- Saying "25% are AA, 25% are Aa and 25% are aa" (which sums to 75%) instead of recognising that heterozygotes occupy 2 of the 4 boxes (= 50%).
- Describing the cross without naming the generations (P, F1, F2) — mark scheme credits the use of these terms.
- Forgetting that self-pollination of an F1 plant is equivalent to F1 × F1.
Things to Be Careful About
- Use precise CIE genetic notation: capital letter for the dominant allele (e.g. A), lower-case for the recessive (e.g. a). Each genotype should be a pair of alleles (AA, Aa, aa).
- The mark scheme explicitly credits either the percentages (25/50/25) or the ratio (1:2:1); give both for safety.
- Homozygous parents must be true-breeding — a single qualifier such as "homozygous" is sufficient on the mark scheme, but a stronger answer says "homozygous dominant × homozygous recessive" so the genotypes are unambiguous.
- The question stipulates autosomal dominant/recessive inheritance, so no sex-linkage considerations are needed.
The lac operon is present in the genome of the bacterium Escherichia coli.
When glucose is not available, the presence of lactose in the extracellular environment leads to the expression of the genes of the lac operon. This leads to an increase in the uptake and metabolism of lactose.
When glucose and lactose are available in the extracellular medium, lactose is prevented from entering the bacterial cell.
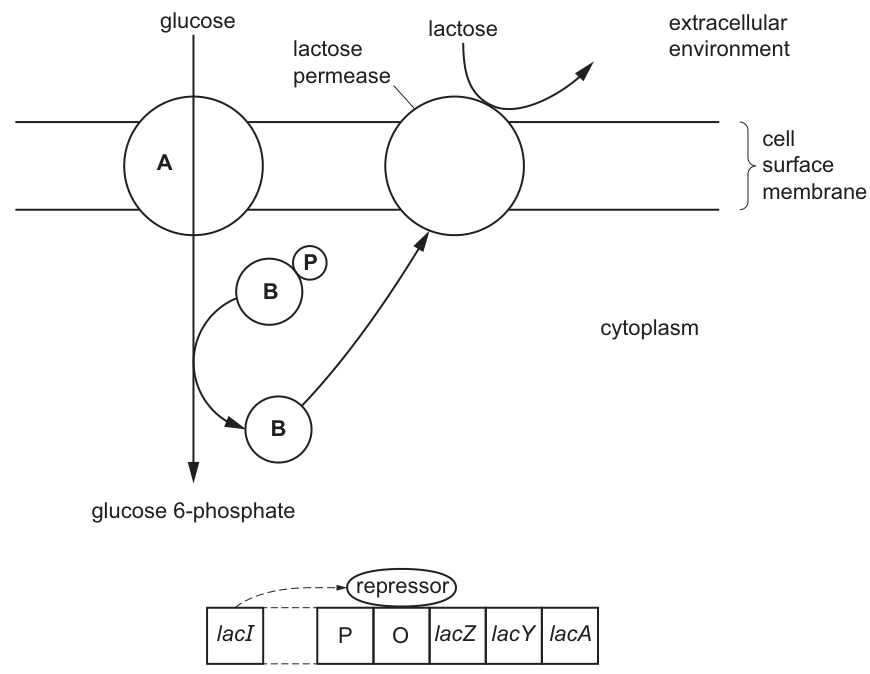
Fig. 3.1 shows what happens when glucose enters a bacterial cell.
- Glucose enters the bacterial cell using a transport protein, A.
- B is an enzyme found in the cytoplasm of the bacterial cell.
- B catalyses the phosphorylation of glucose to produce glucose 6-phosphate.
With reference to Fig. 3.1, suggest and explain how the presence of glucose in the extracellular environment prevents lactose entering the bacterial cell.
Answer
- Glucose enters the cell through transport protein A.
- The enzyme B transfers its phosphate group to glucose (producing glucose 6-phosphate) and so becomes dephosphorylated.
- The (dephosphorylated) enzyme B then binds to lactose permease, causing an allosteric / shape change in lactose permease so that it can no longer transport lactose into the cell.
Glucose entry causes B to lose its phosphate; the dephosphorylated B binds lactose permease and alters its shape so it cannot transport lactose.
Background Concept
The lac operon of Escherichia coli is a classic example of prokaryotic gene regulation. It contains three structural genes — lacZ (encoding β-galactosidase, which breaks lactose into glucose and galactose), lacY (encoding lactose permease, which imports lactose) and lacA (encoding transacetylase). These are only transcribed when lactose is present AND glucose is absent. A separate regulatory gene, lacI, codes for a repressor protein that binds the operator (O) when no lactose is around, blocking transcription.
A second layer of control — catabolite repression / inducer exclusion — fine-tunes the system. In E. coli, the glucose transporter that brings glucose in is itself a protein that becomes phosphorylated as it hands the phosphate on to glucose (the enzyme shown as B in Fig. 3.1 is essentially a sugar-phosphorylating component of the phosphotransferase system). When glucose is flowing through, this component is left dephosphorylated. The dephosphorylated form binds to lactose permease and inactivates it. So even if lactose is in the medium, it cannot enter until glucose has been used up — preventing the cell from wasting resources making lactose-metabolising proteins and transporters when its preferred substrate is already abundant.
Understanding the Question
This is a 3-mark 'suggest and explain' question. The candidate must read Fig. 3.1, identify the structural change that happens to enzyme B when glucose is being processed, and explain how that change is transmitted to the lactose permease so that lactose is excluded from the cell. The marks reward a logical chain: glucose entry → enzyme B loses phosphate → B binds permease → permease shape changes → permease non-functional.
Approach
Follow the arrows in Fig. 3.1. Glucose passes through A into the cytoplasm; the phosphorylated B transfers its P to glucose to make glucose 6-phosphate; the now-unphosphorylated B diffuses over and docks onto lactose permease; the resulting allosteric change stops lactose permease from functioning. The answer must explain (not just describe), so each step needs a 'because'.
Step-by-Step Reasoning
- Glucose enters through transport protein A in the cell surface membrane (this is the first event depicted in the figure).
- Enzyme B is phosphorylated in its resting state (note the P drawn attached to B in the figure). It catalyses the phosphorylation of glucose to glucose 6-phosphate, so during this reaction it loses its phosphate group.
- The dephosphorylated B then binds to lactose permease (the curved arrow in Fig. 3.1 from B to lactose permease shows this).
- This binding causes an allosteric / shape change in lactose permease.
- The altered lactose permease can no longer transport lactose into the cell, so lactose is effectively excluded from the cytoplasm.
Key Takeaways
- E. coli has a built-in priority system: use glucose first, only switch to lactose when glucose is gone.
- Inducer exclusion is an example of allosteric regulation at a membrane transporter, not at a metabolic enzyme — the same principle but applied to a channel/permease.
- Gene-level control (repressor binding) and protein-level control (permease inhibition) work together to make the response fast and economical.
Common Mistakes
- Saying the repressor 'blocks' lactose from entering. The repressor blocks transcription of the lac operon genes; it does not stop lactose physically crossing the membrane.
- Describing only the phosphorylation of glucose without saying what happens to enzyme B afterwards.
- Saying B 'becomes glucose 6-phosphate' or 'turns into glucose 6-phosphate' — B is the enzyme; it transfers the P, it does not become the product.
- Missing the shape-change step — marks require the allosteric / conformational link between B binding and permease function.
Things to Be Careful About
- 'Suggest and explain' demands both an idea AND the reason — don't just list arrows from the figure.
- The direction of the arrow on B is from phosphorylated to dephosphorylated form (i.e. B loses P), not the other way.
- Permease inhibition is rapid (seconds); repression by the repressor is slower (minutes, because it depends on dilution of existing lacY mRNA) — the question's mechanism is the rapid one.
Suggest the advantages for the bacterial cell in preventing the entry of lactose when glucose is present in the extracellular environment.
Answer
- No transcription / expression of the lac operon structural genes (lacZ, lacY, lacA) and so no / less protein synthesis of lactose permease, β-galactosidase and transacetylase — fewer amino acids and less ATP are therefore wasted.
- Glucose is more easily / directly respired than lactose (lactose must first be hydrolysed to glucose and galactose), so the cell obtains more ATP per unit resource by metabolising glucose than by switching on lactose metabolism.
Saves amino acids and ATP that would be wasted synthesising lactose-metabolising enzymes; glucose is the preferred, more easily respired substrate.
Background Concept
Bacteria regulate metabolism so that the enzymes and transporters they make match the substrates available. Expressing a set of genes when the substrate they target is absent is wasteful — every protein made costs ATP (for transcription, translation, and amino-acid biosynthesis) and the resources could otherwise be used for growth and division. The lac operon is therefore under both positive and negative control: it switches on only when lactose is present AND glucose is absent.
Understanding the Question
Part (a)(ii) follows directly from (a)(i). If lactose is being excluded from the cell, the bacterium doesn't need to make the enzymes that handle it. The candidate is being asked why it is advantageous for the cell not to bother with lactose when glucose is freely available.
Approach
Think in two directions: (1) what does the cell save by NOT making the operon products, and (2) why is glucose a better substrate than lactose anyway? Either type of answer scores, and the strongest answers give one of each.
Step-by-Step Reasoning
- Resource economy (molecular). Without lactose being imported, the cell does not need lactose permease, β-galactosidase or transacetylase. Not transcribing lacZ, lacY and lacA saves amino acids (the building blocks of the proteins) and ATP (needed for transcription, translation and activation of amino acids).
- Metabolic efficiency (substrate). Glucose is a monosaccharide that can enter glycolysis directly. Lactose is a disaccharide that must first be hydrolysed into glucose and galactose by β-galactosidase — extra steps, extra enzyme, and a less direct route to ATP. So using glucose 'as is' is energetically more efficient per molecule than processing lactose.
Key Takeaways
- Gene expression is expensive; cells only turn on operons whose products are useful.
- The preferred substrate (glucose) is both easier to import and easier to metabolise than the alternative (lactose), so the cell prioritises it.
- This is a recurring biological theme: economy of resources at every level (energy, matter, time).
Common Mistakes
- Vague answers like 'saves energy' without naming what is not being synthesised or what the energy would have been spent on.
- Confusing catabolite repression (this question) with operator-level repression (the repressor protein) — they are different mechanisms with the same end result.
- Saying 'no lactose' when the question stem says lactose IS in the medium — the cell is just being prevented from taking it up.
Things to Be Careful About
- 'Suggest' requires a biological reason, not just a restatement of 'glucose is present'.
- Two clearly distinct ideas score the two marks — avoid giving two versions of the same idea.
The glucose 6-phosphate in the cytoplasm of the bacterial cell is used to produce fructose 1,6-bisphosphate.
Fructose 1,6-bisphosphate is used in glycolysis.
Outline the events that occur in glycolysis following the production of fructose 1,6-bisphosphate.
Answer
- Fructose 1,6-bisphosphate is split into two molecules of triose phosphate (TP).
- Each triose phosphate is oxidised / dehydrogenated (removal of hydrogen) — this oxidises NAD and produces reduced NAD; the hydrogens are also used to reduce the coenzyme.
- The resulting intermediates undergo substrate-linked phosphorylation, producing ATP, and are finally converted to pyruvate. Net yield per glucose: 2 ATP (substrate-level) and 2 reduced NAD.
Fructose 1,6-bisphosphate is split into two triose phosphates, which are oxidised to give reduced NAD, then substrate-level phosphorylation yields ATP before the molecules are converted to pyruvate.
Background Concept
Glycolysis is the universal first stage of cellular respiration. It takes place in the cytoplasm of all living cells (prokaryotic and eukaryotic) and converts one 6-carbon glucose into two 3-carbon pyruvate molecules. The pathway yields a small net amount of ATP by substrate-linked phosphorylation (an enzyme transfers a phosphate group from a high-energy intermediate directly onto ADP) and captures high-energy electrons as reduced NAD (which will later be reoxidised in the link reaction and oxidative phosphorylation to make many more ATP). The preparatory phase converts glucose to fructose 1,6-bisphosphate (using 2 ATP); the payoff phase — which this question asks about — converts the 6-carbon sugar into two 3-carbon pyruvates while paying back the ATP investment and producing reduced NAD.
Understanding the Question
The stem explicitly states that the cell has already produced fructose 1,6-bisphosphate, so the candidate only needs to describe what happens AFTER that point in the pathway. The command word is 'outline' — a brief, ordered summary of the events is enough. Three marks = three clear points.
Approach
Memorise the payoff phase as a four-event chain: split → oxidise (with NAD) → phosphorylate ADP → form pyruvate. Then write each event as one crisp sentence using the correct technical terms (triose phosphate, dehydrogenation, reduced NAD, substrate-level phosphorylation, pyruvate).
Step-by-Step Reasoning
- Splitting (lyase step). The enzyme aldolase cleaves fructose 1,6-bisphosphate into two 3-carbon triose phosphates — glyceraldehyde 3-phosphate (G3P) and dihydroxyacetone phosphate (DHAP), the latter being rapidly converted to G3P. So one 6C sugar becomes two 3C sugars.
- Oxidation / dehydrogenation (dehydrogenase step). G3P is oxidised by glyceraldehyde 3-phosphate dehydrogenase. The hydrogen removed is used to reduce the coenzyme NAD⁺ to reduced NAD (NADH + H⁺). The energy released is captured in the high-energy intermediate 1,3-bisphosphoglycerate.
- Substrate-level phosphorylation (kinase steps). Phosphate groups are transferred from these high-energy intermediates directly onto ADP by substrate-level phosphorylation, producing ATP. (Two ATPs are made per G3P, four per original glucose — but two were used in the preparatory phase, so the net is 2 ATP.)
- Pyruvate formation. The remaining steps rearrange and dephosphorylate the intermediates to give pyruvate. The other product of step 2 — reduced NAD — is preserved and is the major energy carrier passed to the link reaction and the electron transport chain.
Key Takeaways
- Glycolysis occurs in the cytoplasm and is anaerobic (does not require oxygen).
- It produces a small amount of ATP directly (substrate-level) but its main job is to produce reduced NAD for oxidative phosphorylation.
- The 6C → 2 × 3C splitting step is the key point of the pathway; everything else in the payoff phase is duplicated because of it.
Common Mistakes
- Writing about the preparatory phase (phosphorylation of glucose to glucose 6-phosphate to fructose 6-phosphate to fructose 1,6-bisphosphate). The question explicitly starts AFTER this — including it wastes time and gains no marks.
- Saying 'NAD is reduced' without naming the product 'reduced NAD'.
- Confusing substrate-level phosphorylation (in the cytoplasm, ATP made directly by enzyme transfer) with oxidative phosphorylation (on the inner mitochondrial membrane, ATP made by ATP synthase using a proton gradient).
- Saying pyruvate is produced from glucose in one step, skipping the triose phosphate stage.
- Writing 'energy is produced' instead of naming ATP and reduced NAD.
Things to Be Careful About
- 'Outline' = a clear summary, not a step-by-step enzyme list. The mark scheme accepts the three big events (split, oxidise, ATP + reduced NAD → pyruvate).
- Triose phosphate is a 3-carbon sugar phosphate; pyruvate is a 3-carbon organic acid — they are different molecules.
- The question is about the events in the CELL, so the description should match what happens in a bacterial cytoplasm (still glycolysis).
E. coli is present in the gut (intestines) of young mammals.
The diet of young mammals contains lactose which is present in the milk they consume.
Scientists carried out an experiment using E. coli with a lac operon ( E. coli) and E. coli without a lac operon ( E. coli).
The experiment was carried out to determine whether the presence of a lac operon gives E. coli a selective advantage.
- Equal numbers of E. coli and E. coli were given to 8 mice to allow the bacteria to colonise the gut.
- On day 0, 50% of the E. coli in the gut of each mouse were E. coli.
- 4 mice were fed a standard diet that included lactose.
- 4 mice were fed a standard diet without lactose.
- The percentage of E. coli that were in the gut of each mouse was determined every day for 6 days.
The results are shown in Fig. 3.2.
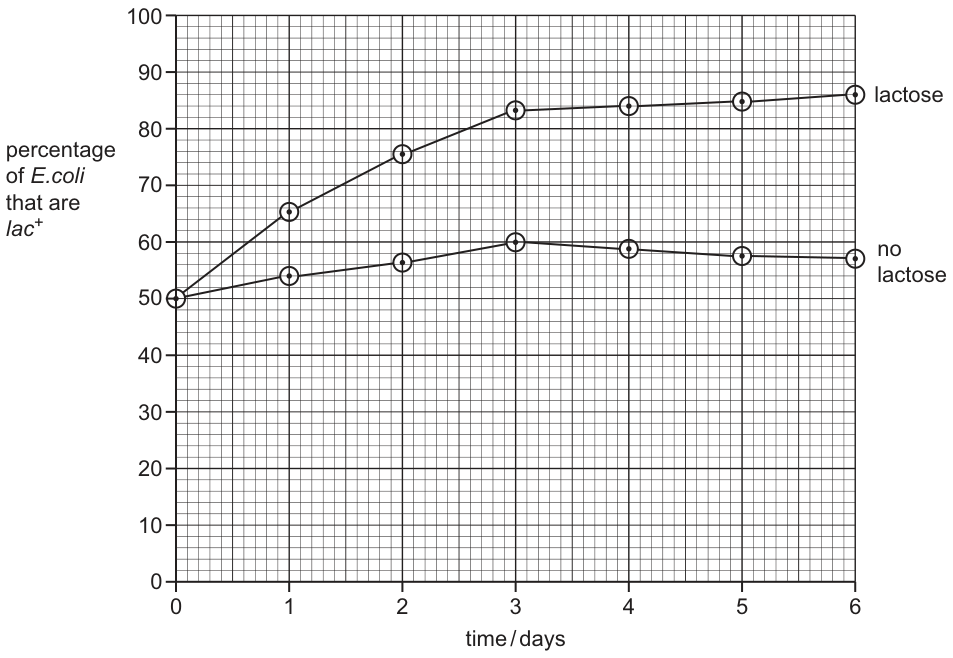
With reference to Fig. 3.2, describe the effect of the different diets on the percentage of E. coli that are .
Answer
- Lactose diet: the percentage of E. coli that are lac⁺ increases steadily over the 6 days, from 50% on day 0 to about 86% on day 6.
- No lactose diet: the percentage shows a small / slight increase, from 50% to about 57–60% by day 3, and then stays roughly constant (little change) for the rest of the experiment.
- Comparative data quote: for example, on day 6 the lac⁺ percentage is 86% on the lactose diet but only ~57% on the no-lactose diet; on day 3 the values are 83–84% and 60% respectively.
On the lactose diet the % lac⁺ rises from 50% to ~86% over 6 days; on the no-lactose diet the % lac⁺ rises only slightly to ~57–60% and then plateaus.
Background Concept
Fig. 3.2 is a comparative line graph showing the percentage of gut E. coli that carry the lac operon over six days under two dietary conditions. Both populations start at 50% on day 0 (the experimental set-up specified in the stem). The question is testing whether the candidate can read a graph, identify each trend, and back the description with numbers from the axes — a core practical skill for A-level Biology.
Understanding the Question
The command word is 'describe' — the candidate must state what the graph shows without trying to explain why (that is asked in the next part). Two marks means two clear points are required: one for each line. A quantitative comparison strengthens the answer.
Approach
Read each line separately, note its direction (rising/falling/flat) and the start and end values, then compare. Use the format 'the X diet shows … rising from … to …'. For two marks, describe each diet and, where space allows, quote a number.
Step-by-Step Reasoning
- Lactose diet (upper line): starts at 50% on day 0, rises steeply to about 65% by day 1, continues to ~75% by day 2 and ~83% by day 3, then plateaus between ~84 and 86% for days 4–6. This is a large, sustained increase.
- No-lactose diet (lower line): starts at 50% on day 0, rises only slightly to ~54% by day 1 and ~60% by day 3, then essentially levels off at ~57–60% for the remaining days. The total change is much smaller than in the lactose diet.
- Comparison: the gap between the two lines widens from 0% on day 0 to roughly 30 percentage points by day 6. A data quote, e.g. 'on day 6, ~86% (lactose) vs ~57% (no lactose)', anchors the description.
Key Takeaways
- 'Describe' in this context means state the trend(s) and support with numerical read-offs.
- Graph descriptions should specify BOTH the start and end values when the change is the key feature.
- 'Little change' is a valid description for a near-horizontal line; do not invent a trend that the data do not show.
Common Mistakes
- Stating only the lactose diet trend and ignoring the no-lactose diet — that costs a mark.
- Giving values to unrealistic precision (e.g. '84.5%') when the graph has 2% gridlines.
- Describing the change in absolute terms ('increased by 36%') without context, when the candidate should be quoting start and end percentages.
- Mixing up which line is which diet (lactose diet is the upper line throughout).
Things to Be Careful About
- Always quote both a start value (50% on day 0) and an end value to make the change explicit.
- The third marking point (comparative data quote) is a 'bonus-style' credit for supporting figures; a clear comparison without numbers can still earn the first two marks, but quoting a number makes the answer more robust.
The scientists concluded that E. coli had a selective advantage when colonising the gut, but only in the presence of lactose.
Suggest why the presence of lactose caused E. coli to have a selective advantage.
Answer
- Lactose acts as the selection pressure: it is a resource in the environment that the bacteria must compete to use.
- lac⁺ E. coli possess the lac operon, so they can take up and metabolise lactose for energy / growth, whereas lac⁻ E. coli cannot use lactose. In the presence of lactose, the lac⁺ bacteria therefore survive and reproduce more successfully, and their proportion of the population rises.
Lactose is the selection pressure; only lac⁺ E. coli can take up and metabolise lactose, so they have higher survival and reproduction in its presence.
Background Concept
Natural selection acts wherever there is (1) variation in a population, (2) a selection pressure (an environmental factor that affects survival or reproduction), and (3) heritability of the variation. In bacteria, selection pressures include antibiotics, available nutrients, temperature, pH and the presence of particular substrates. Where two strains differ in a gene that affects their ability to use a substrate, the strain that can use the substrate will outcompete the other whenever that substrate is the limiting resource. This is a microbial analogue of Darwin's 'struggle for existence'.
Understanding the Question
The stem already gives the conclusion (the scientists concluded that lac⁺ E. coli had a selective advantage, but only in the presence of lactose). The candidate is being asked to suggest why — i.e. to apply the natural-selection framework to this specific experiment. Two marks means two clear points, typically: identify the selection pressure, and explain the differential survival between the two strains.
Approach
State the selection pressure (lactose) explicitly, then connect it to a phenotypic difference between the two strains (lac⁺ can take up and metabolise lactose; lac⁻ cannot), and conclude with the consequence (differential survival → increase in lac⁺ proportion).
Step-by-Step Reasoning
- Selection pressure = lactose. In the gut, lactose is a nutrient that varies with diet. On the lactose diet it is abundant; on the no-lactose diet it is absent. This dietary difference creates the differential selection seen in Fig. 3.2.
- Phenotypic difference. lac⁺ bacteria carry the lac operon, so they can synthesise lactose permease (to import lactose) and β-galactosidase (to hydrolyse lactose into glucose and galactose for respiration). lac⁻ bacteria lack these enzymes and so cannot use lactose as a food source.
- Differential survival / reproduction. On the lactose diet, lac⁺ bacteria can harvest this extra carbon and energy source, so they grow and divide faster and outcompete the lac⁻ bacteria. The lac⁻ population, unable to use the available substrate, contributes fewer descendants to the next generation. The proportion of lac⁺ therefore rises, just as Fig. 3.2 shows.
- No-lactose diet (for completeness). When lactose is absent, the lac operon is of no use; the lac⁺ bacteria no longer have a clear advantage. The small rise seen on the no-lactose diet may reflect a small amount of lactose still present in the gut, or some other minor advantage (e.g. cost of maintaining the operon is offset by chance), but the selection pressure has effectively been removed — consistent with the scientists' conclusion that the advantage is only in the presence of lactose.
Key Takeaways
- A 'selective advantage' is a higher rate of survival and/or reproduction in a given environment, leading to a higher representation of that genotype in the next generation.
- The selection pressure must be present in the environment for an advantage to be visible (hence the 'only in the presence of lactose' conclusion).
- The same logic explains antibiotic resistance, pesticide resistance and the evolution of metabolic diversity in microbes.
Common Mistakes
- Restating the data ('because the percentage of lac⁺ increased') rather than explaining it.
- Naming glucose, oxygen or some other variable as the selection pressure — the stem is clear that lactose is the variable being changed.
- Confusing 'selective advantage' with 'the bacteria choose' or 'the bacteria adapt' — natural selection is not a choice, it is differential survival among pre-existing variants.
- Forgetting that lac⁻ bacteria are also alive on the lactose diet — they just reproduce more slowly, so the proportion changes, not an absolute wipe-out.
Things to Be Careful About
- The mark scheme also credits any AVP (additional valid point) such as 'glucose may have run out' or 'lactose is the only available carbon source once glucose is gone' — these extend the same idea.
- 'Suggest' in CIE mark schemes accepts reasonable biological reasoning even if it is not directly stated in the stem.
The evolution of antibiotic resistance in bacteria has occurred as a result of natural selection.
Answer
- (Random) mutation in the bacterial DNA
- Horizontal transmission (gene transfer) — by conjugation, transformation or transduction
- Mutation; 2. Horizontal gene transfer (conjugation, transformation or transduction).
Background Concept
Bacteria can become resistant to antibiotics through two fundamentally different routes:
-
Mutation — a spontaneous change in the bacterium's own DNA. Mutations arise randomly during DNA replication and can alter the target of the antibiotic (e.g. a ribosomal protein or cell-wall synthesis enzyme), reduce uptake of the drug, or activate an enzyme that breaks the antibiotic down. Because bacterial populations are enormous and reproduce very rapidly, useful resistance mutations can appear within days.
-
Horizontal gene transfer (HGT) — the bacterium acquires a ready-made resistance gene from another bacterium, even of a different species. HGT occurs by three main mechanisms:
- Conjugation — direct transfer of a plasmid (often carrying resistance genes) from a donor to a recipient cell via a sex pilus.
- Transformation — uptake of free pieces of DNA released into the environment when other bacteria lyse.
- Transduction — transfer of bacterial DNA from one cell to another by a bacteriophage.
Resistance genes spread rapidly through bacterial populations because HGT can move them between unrelated lineages, not just between parent and offspring.
Understanding the Question
The question simply asks the candidate to name two ways a bacterium can become resistant. It is a "name" command, so only the names of the mechanisms are required — no description or explanation.
Approach
Recall the two overarching routes by which resistance arises: a change within the bacterium's own genome, or acquisition of a gene from outside. Give one example of each.
Step-by-Step Reasoning
- Mark 1: mutation. State that resistance can arise by a (random) mutation in the bacterial DNA that changes an antibiotic target or otherwise confers resistance.
- Mark 2: horizontal gene transfer. Name any one of conjugation, transformation or transduction — or simply write "horizontal transmission / horizontal gene transfer."
Key Takeaways
- Mutation and HGT are the two routes by which bacterial resistance originates.
- HGT is what makes resistance spread so rapidly between species.
Common Mistakes
- Confusing "mutation" with "adaptation" — bacteria do not mutate deliberately in response to the antibiotic; the mutation is random and pre-dates the exposure.
- Naming antibiotic-target modification as a separate mechanism — it is a consequence of mutation, not a separate route.
Things to Be Careful About
Either one of conjugation, transformation or transduction earns the mark; candidates need not list all three.
The World Health Organisation regularly analyses bacterial DNA sequence data.
Suggest one way in which this contributes to solving the problem of antibiotic resistance in bacteria.
Answer
DNA sequence data allow new / emerging resistance mutations and resistance genes to be tracked (and their spread monitored between countries / strains), so that clinicians and policy-makers can choose or develop appropriate antibiotics.
Allows mutations / resistance genes to be tracked so that antibiotics can be chosen / produced appropriately.
Background Concept
Whole-genome sequencing (and targeted sequencing of resistance genes) is now routine in public-health microbiology. By comparing bacterial genomes from different patients, hospitals, countries and time-points, scientists can:
- identify which mutations or resistance genes are appearing;
- track how resistant strains are spreading geographically;
- detect the emergence of novel resistance mechanisms early;
- inform prescribing policy and the development of new antibiotics.
Understanding the Question
The command word is "suggest" — only one mark, so a single, well-focused point is needed. The candidate must link WHO's DNA-sequence analysis to solving the resistance problem, not merely describing what sequencing is.
Approach
Think about what useful information sequence data uniquely provides, then translate that into an action that helps tackle resistance.
Step-by-Step Reasoning
- Sequencing identifies resistance mutations / resistance alleles (mark-scheme option 1).
- Once known, those mutations/genes can be tracked between strains, patients and regions, showing how resistance is spreading.
- Alternatively, the information can guide (informed) choice of antibiotic in clinical settings, or the development/production of new antibiotics targeting emerging resistant strains (mark-scheme option 3).
Any one of these links earns the mark.
Key Takeaways
- Genomic surveillance is a key modern tool for managing antibiotic resistance.
- The mark scheme accepts any one of: tracking resistance, identifying mechanisms, or informing antibiotic choice/production.
Common Mistakes
- Vague answers such as "to identify resistant bacteria" — too imprecise; credit requires reference to mutations, genes or alleles.
- "To cure resistant infections" — sequencing does not directly cure disease.
Things to Be Careful About
The word "suggest" invites an idea, but the answer must be biologically specific (mutations / resistance genes / choice of antibiotic) to score.
Some infectious bacterial diseases are treated with the antibiotic streptomycin.
If a person does not finish the prescribed course of streptomycin, bacteria are more likely to become resistant to the antibiotic.
Explain why a streptomycin-resistant strain of bacteria is more likely to develop as a result of natural selection when a person does not complete the prescribed course of antibiotics.
Answer
- Streptomycin acts as the (selection) pressure / selecting agent.
- Most bacteria are killed, but any bacteria with a resistance mutation survive and pass the resistance allele / gene to their offspring — they have a selective advantage. (ORA)
- Over time the frequency of the resistance allele increases in the population — this is directional selection.
Streptomycin selects for resistant mutants which survive, reproduce and pass on the resistance allele, causing directional selection.
Background Concept
Natural selection requires three ingredients:
- Variation in a population (here, some bacteria carry a resistance allele, most do not).
- A selection pressure — an environmental factor that differentially affects survival/reproduction (here, streptomycin).
- Differential survival and reproduction of the better-adapted variants, so the favoured alleles are passed on and increase in frequency over generations.
Because the environment (presence of streptomycin) favours one extreme of the variation (the resistant phenotype), this is a classic case of directional selection — the population's allele frequencies shift in one direction.
Understanding the Question
The stem tells us streptomycin is the antibiotic and that an incomplete course makes resistance "more likely to develop." The candidate must explain the mechanism by which incomplete dosing promotes the evolution of resistance through natural selection. The command word "explain" demands reasoning, not just definitions: each point should make clear why, not just what.
Approach
Work through the stages of natural selection in order: identify the selection pressure, state the variation, explain the differential survival, and name the type of selection. Bring in the incomplete-course detail to explain why resistance is more likely in that situation.
Step-by-Step Reasoning
-
Streptomycin is the selection pressure (mark-scheme point 1). It kills or inhibits the growth of susceptible bacteria, so only bacteria that can tolerate it survive.
-
Resistant bacteria survive and reproduce; susceptible ones do not (mark-scheme point 2). Within any large bacterial population a few individuals already carry a resistance allele (from earlier mutation or HGT). Under streptomycin exposure these have a selective advantage and so leave more offspring than non-resistant bacteria — or reverse argument (ORA): non-resistant bacteria are killed.
-
The resistance allele is inherited by the offspring (mark-scheme point 3). Bacteria reproduce asexually by binary fission, so each daughter cell inherits a complete copy of the parental genome including the resistance allele; resistance can also spread sideways by HGT.
-
Result: directional selection (mark-scheme point 4). Over successive generations the proportion of resistant bacteria in the population rises — the population's allele frequency has shifted in one direction.
Why does an incomplete course make this worse?
If a patient stops taking streptomycin before all the bacteria are eradicated, two things follow:
- A sub-lethal concentration of antibiotic remains in the body for a time.
- Some bacteria (perhaps already weakened but still alive) are exposed to the drug at a concentration high enough to select for resistance but not high enough to eliminate all resistant cells. Sensitive bacteria are killed off, leaving resistant ones to multiply.
- A higher proportion of the bacteria that repopulate the body therefore carry the resistance allele, and these may be passed to others — spreading the resistant strain.
Key Takeaways
- Antibiotic resistance evolves by the same natural-selection mechanism as any other adaptation.
- The key elements to credit are: selection pressure, differential survival, inheritance of the resistance allele, and directional selection.
- Incomplete antibiotic courses create conditions that favour the survival of partially-resistant cells, increasing the chance that a resistant strain emerges.
Common Mistakes
- Stating that the antibiotic causes the mutation — it does not; mutations arise randomly, the antibiotic merely selects existing variants.
- Saying bacteria "become immune" — bacteria are not immune in the immunological sense; the correct term is "resistant."
- Omitting the inheritance step — the allele must be passed on for evolution to occur.
- Not naming the type of selection (directional).
Things to Be Careful About
- "Explain" requires the reason behind each statement; simply listing terms does not earn full marks.
- Either "allele" or "gene" is acceptable in the inheritance point; the mark scheme uses both.
- A reverse argument (ORA) — sensitive bacteria die — is accepted as an alternative way to make the differential-survival point.
Metachromatic leukodystrophy (MLD) is a genetic disease that affects the nervous system.
MLD is caused by mutations in the ARSA gene located on chromosome 22. The ARSA gene, which is 3150 base pairs (bp) in length, includes 8 exons and is shown in Fig. 5.1.

A genetic test using DNA sequencing is available to identify mutations associated with MLD in the ARSA gene. The sequencing method can only work if a DNA fragment size is less than 1000 bp.
The test involves a number of different stages:
- Genomic DNA is extracted from a blood sample.
- Polymerase chain reaction (PCR) using 5 pairs of primers selects 5 different DNA fragments of the ARSA gene.
- Gel electrophoresis is carried out on the DNA fragments.
- The DNA fragments are sequenced and analysed for mutations.
Table 5.1 shows the length of the DNA fragments and the exons present in each DNA fragment.
Table 5.1
| fragment number | DNA fragment length / bp | exons in DNA fragment |
|---|---|---|
| 1 | 405 | 1 |
| 2 | 737 | 1-2 |
| 3 | 706 | 2-4 |
| 4 | 860 | 5-7 |
| 5 | 916 | 7-8 |
Genomic DNA and primers are added to the PCR machine.
Name two other substances that are added to the PCR machine, and explain why each substance is added.
Answer
Substance 1: dNTPs (DNA nucleotides)
- to anneal / bind to complementary bases on the single-stranded template DNA (so a new complementary strand can be built).
Substance 2: Taq polymerase
- to catalyse the formation of phosphodiester bonds between adjacent nucleotides, producing the new sugar-phosphate backbone / complementary strand of DNA;
- AND/OR it remains functional (is thermostable / does not denature) at the high temperature (~95 °C) used to separate the DNA strands.
dNTPs anneal to complementary bases; Taq polymerase forms phosphodiester bonds and is heat-stable.
Background Concept
The polymerase chain reaction (PCR) is a cyclical, in-vitro method for amplifying a specific region of DNA. Each cycle has three temperature-controlled steps:
- Denaturation (~95 °C): the double-stranded DNA template is heated to break the hydrogen bonds between complementary bases, giving two single strands.
- Annealing (~55 °C): short single-stranded DNA primers bind (anneal) to the complementary sequences flanking the target region on each template strand.
- Extension (~72 °C): a DNA polymerase adds free deoxyribonucleotides (dNTPs) to the 3′ end of each primer, building a new complementary strand.
A thermostable DNA polymerase is essential because the reaction is repeatedly heated to ~95 °C during denaturation. Taq polymerase, isolated from the thermophilic bacterium Thermus aquaticus, tolerates this temperature without denaturing.
Understanding the Question
The stem of Question 5 already states that genomic DNA and primers are added to the PCR machine. Part (a) asks for two further substances that must be added, together with a reason for each. Marks are awarded in pairs — name + explanation — so the answer must contain both a correct reagent and a correct role for that reagent. A buffer is an acceptable third option but is not essential for full marks.
Approach
Identify the components that the polymerase needs to do its job:
- a supply of building blocks (dNTPs) to extend the primers;
- a working catalyst that survives the cycling temperatures (Taq polymerase);
- a stable chemical environment (buffer).
For each, give the biological reason, not just a vague description.
Step-by-Step Reasoning
Pair 1 — dNTPs:
The new complementary strand is built by joining free nucleotides one at a time to the 3′-OH of the primer. Each dNTP must base-pair with the corresponding template base (A with T, C with G). Without dNTPs there are no building blocks. The mark requires the idea of annealing to complementary bases, not just "to build DNA".
Pair 2 — Taq polymerase:
Two mark-worthy explanations are accepted:
- It catalyses the formation of phosphodiester bonds that join nucleotides into a new sugar–phosphate backbone (i.e. it builds the complementary strand).
- It is thermostable / does not denature at the high temperatures (~95 °C) used in the denaturation step — a property ordinary DNA polymerase does not have.
Either (or both) earns the explanation mark.
(Optional third pair — buffer: provides the optimum/suitable/constant pH for the polymerase to work, or prevents denaturation of the enzyme/damage to DNA.)
Key Takeaways
- The four essentials of a PCR mixture are: template DNA, primers, dNTPs and a thermostable DNA polymerase (Taq), normally in a buffer with Mg²⁺.
- Each component has a specific, named function; vague answers such as "for the reaction to work" do not score.
- The high temperature used in PCR is the reason a thermophilic enzyme is required.
Common Mistakes
- Naming "nucleotides" without specifying deoxyribonucleotides / dNTPs — the mark scheme requires the precise term.
- Giving a role that belongs to the primers (e.g. "dNTPs bind to the template") rather than the role of dNTPs themselves.
- Saying polymerase "denatures the DNA" — denaturation is done by the high temperature, not by the enzyme.
- Stating Mg²⁺ as a substance — it is normally present in the buffer, so naming the buffer is more standard.
Things to Be Careful About
- Marks are paired: a correct reagent with a wrong explanation scores only the explanation mark (or vice versa). Make sure each name is matched with its correct role.
- "Provides energy" is a frequent wrong claim for dNTPs — energy comes from the high-energy phosphates of the dNTPs themselves, but that is not the answer's required function.
- "Heat-stable enzyme" alone, without saying why that matters (the high denaturation temperature), is too vague.
Gel electrophoresis is carried out on the 5 different DNA fragments produced as a result of PCR. Each DNA fragment is put into a loading well on the gel.
The final lane on the electrophoresis gel contains a DNA ladder of known lengths of DNA.
Fig. 5.2 shows the results of the gel electrophoresis.
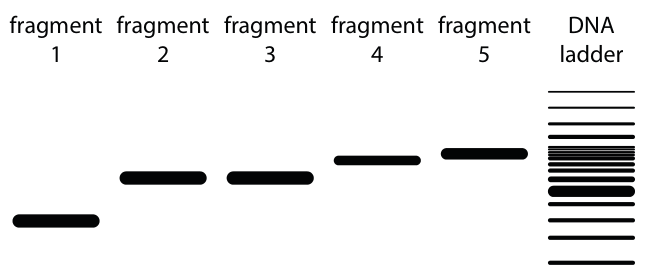
Answer
- The DNA ladder is a set of fragments of known length run in the same gel, so that the length of each sample fragment can be estimated / compared with the ladder bands.
- It also acts as a check that electrophoresis worked correctly (e.g. bands are present and have run in the expected pattern).
A DNA ladder provides known-length reference bands so that the length of each sample fragment can be estimated and the run can be confirmed as successful.
Background Concept
In gel electrophoresis, DNA fragments are pulled through a gel matrix by an electric field. Because all DNA molecules have the same charge-to-mass ratio, they migrate at a rate determined mainly by their size: smaller fragments move further, larger fragments stay closer to the wells. To convert a band position into an actual fragment length, the run must include a reference lane containing fragments of known size — the DNA ladder.
Understanding the Question
The stem describes Fig. 5.2, in which lanes 1–5 contain the PCR products of the ARSA gene test and lane 6 contains the DNA ladder. The candidate must explain why a ladder is loaded alongside the samples, not just describe what it is.
Approach
Think about what information you can — and cannot — extract from a gel image alone. Without the ladder you can only say "fragment A moved further than fragment B". With the ladder you can convert that into actual base-pair lengths and so identify which of the five expected ARSA fragments each band represents. Also consider the role of the ladder as an internal quality check on the run itself.
Step-by-Step Reasoning
- Reference / comparison: by aligning each sample band with the nearest ladder band, the length of the unknown fragment can be estimated. For example, fragment 5 in the figure has moved only slightly and matches a position in the ladder corresponding to ~900 bp, consistent with the expected 916 bp.
- Identification of fragment number: because the expected lengths of fragments 1–5 are known (405, 737, 706, 860, 916 bp), the ladder allows the technician to confirm that each band is the expected fragment.
- Run-quality check: if the ladder bands are present, well-spaced and in the expected pattern, this confirms the gel has run correctly — voltage, buffer, gel concentration and time were all adequate. If the ladder is missing or smeared, the run has failed.
Key Takeaways
- A DNA ladder converts band position into band length.
- It also validates that the electrophoresis run itself worked.
- Lanes must be loaded onto the same gel as the samples — comparing to a ladder on a different gel is not reliable.
Common Mistakes
- Stating only that the ladder "identifies the fragment" without saying how (by comparison / by estimating length against known bands).
- Confusing the role of the ladder with the role of the loading dye (the dye tracks progress through the gel; the ladder is for sizing).
- Saying "shows that DNA is present" — that is what the sample bands themselves show; the ladder is for sizing.
Things to Be Careful About
- "Compare to known lengths" is the wording that earns the credit; "see how far it has moved" alone is not enough.
- Mark scheme accepts either identification of fragment length or confirmation that electrophoresis worked correctly; both ideas together make a stronger answer.
In the genetic test for MLD, PCR and gel electrophoresis are carried out before DNA sequencing.
Suggest and explain reasons why PCR and gel electrophoresis are carried out before DNA sequencing.
Answer
- PCR amplifies / makes many copies of the DNA fragments, providing enough DNA for the sequencing reaction to work (genomic DNA extracted from a blood sample is present in too small a quantity to sequence directly).
- PCR (with 5 primer pairs) selects only the short regions of the ARSA gene — all under 1000 bp — because the sequencing method can only read fragments less than 1000 bp (none of the five fragments is longer than 916 bp).
- Gel electrophoresis separates the 5 PCR products and confirms the fragment lengths / confirms that PCR has produced the expected fragments (so that the correct fragments are sent for sequencing).
PCR amplifies DNA and selects only fragments under 1000 bp so there is enough DNA of a sequencable size; gel electrophoresis separates the fragments and confirms that PCR has produced the expected sizes before sequencing.
Background Concept
DNA sequencing (e.g. Sanger sequencing) needs two things:
- Enough template DNA to generate a readable signal — typically nanogram quantities, far more than the few micrograms of genomic DNA obtainable from a routine blood sample.
- Fragments short enough to be read in a single reaction. Most Sanger sequencing reads reliably only up to about 800–1000 bp; longer fragments give incomplete or ambiguous reads.
PCR solves both problems at once: by choosing primers that flank short regions of the gene, the desired fragments are both amplified and size-limited in one step. Gel electrophoresis then verifies what has been produced.
Understanding the Question
The stem specifies that the sequencing method "can only work if a DNA fragment size is less than 1000 bp" and Table 5.1 confirms that all five selected fragments are under 1000 bp (largest = 916 bp). The candidate must explain why PCR and gel electrophoresis are run before sequencing, using the information supplied in the stem.
Approach
Think in two columns:
- What does PCR add? quantity of DNA + correct (short) length.
- What does gel electrophoresis add? separation of the five products + a check on their sizes before they are committed to the expensive sequencing step.
Sequence the reasoning: amount → size selection → verification, in that order.
Step-by-Step Reasoning
- Quantity of DNA. Genomic DNA from a blood sample is too dilute to sequence directly. PCR exponentially amplifies the chosen regions of the ARSA gene so that enough template is available. This is the "amplifies / many copies" mark.
- Size selection. The primer pairs used in PCR are designed so that the five amplicons are all ≤ 1000 bp (specifically 405, 737, 706, 860 and 916 bp). The sequencing method's stated limit of 1000 bp means these fragments can be read end-to-end; the full 3150 bp gene is too long to sequence in one piece. This is the "small enough / less than 1000 bp" mark.
- Verification by gel. Gel electrophoresis separates the 5 fragments and shows whether each is present at the expected length. This is a quality-control step before the costly sequencing reaction is run: if PCR has produced the wrong products (e.g. a 1500 bp band, contamination), the result can be rejected before wasting sequencing reagents. This is the "separate / confirm lengths" mark.
Any three of these four points earns full marks; the strongest answer gives all three.
Key Takeaways
- PCR is used both to amplify and to size-select the regions of interest.
- Gel electrophoresis is a quality check before an expensive downstream step.
- Always link each step in a workflow to the constraint of the next step (here: sequencing needs ≥ ng DNA and ≤ 1000 bp fragments).
Common Mistakes
- Stating only that PCR "makes more DNA" without mentioning size selection.
- Stating that gel electrophoresis is "to see the bands" without explaining why that matters before sequencing (i.e. to confirm fragment lengths/identity).
- Treating the two techniques as separate ideas rather than linking them to the sequencing constraint.
Things to Be Careful About
- The wording "suggest and explain" requires both an action and its reason. "PCR amplifies the DNA" alone is only the action; pair it with "so there is enough for sequencing" or "so the fragments are under 1000 bp".
- Do not claim electrophoresis separates alleles — at this scale it separates fragments by length only.
Calculate the number of copies of DNA that are obtained if PCR is run for 35 cycles.
Assume that there is only 1 copy of DNA at the start of PCR.
Give your answer in standard form to two significant figures.
number of copies = ______
Working
In standard form to 2 significant figures:
Answer
number of copies =
3.4 × 10^10
Background Concept
PCR is an exponential amplification: at the end of each cycle, every double-stranded DNA molecule has been duplicated, so the number of copies doubles. Starting from a single molecule:
- after 1 cycle → 2 copies
- after 2 cycles → 4 copies
- after n cycles → copies
After ~30 cycles a single molecule is amplified to over a billion — this is what makes PCR powerful enough to detect DNA from a single cell.
Understanding the Question
The stem fixes the starting amount at 1 copy and the number of cycles at 35. The candidate must:
- Compute .
- Express it in standard form (i.e. as where ).
- Round to two significant figures.
Approach
Calculate exactly, then rewrite the integer in scientific notation and round to two sig figs.
Step-by-Step Reasoning
The first non-zero digit is 3, so the standard form places the decimal after the 3:
To two significant figures, look at the third sig fig (3) and round the second (4) down (because 3 < 5):
Key Takeaways
- PCR amplification follows the formula when starting from one molecule.
- Standard form requires the mantissa to be in the range .
- "Two significant figures" means two digits in the mantissa (here 3 and 4), with the rest rounded off.
Common Mistakes
- Writing the answer as — this is off by a factor of 10 (a common slip when counting the powers).
- Writing — not in standard form (mantissa ≥ 10).
- Giving — three significant figures, not two.
- Stating — confusing the formula with the wrong arrangement.
Things to Be Careful About
- is a useful mental check: , consistent with the answer.
- The mark is awarded for the final numerical value; the working shown above is good practice but the answer line is the only thing that scores. Make sure is clearly written on the answer line.
MLD is a rare autosomal recessive disease. It is estimated that there is one case of MLD in every 40000 births worldwide. Children with MLD have a reduced life expectancy.
- MLD is a degenerative disease that causes severe disability.
- Before 2022, there was no known cure for MLD and the only treatment for symptoms was to provide pain relief.
A new gene therapy treatment known as Libmeldy® became available in a number of countries in 2022. The treatment must start before symptoms are present. Although the treatment may provide a cure for MLD, a single dose is extremely expensive.
Blood samples from newborn babies are screened for a number of rare genetic diseases (neonatal screening) in most countries of the world, but none include screening for MLD.
Discuss the social and ethical considerations of including screening for MLD when carrying out neonatal screening in a country where gene therapy for MLD is available.
Answer
A balanced discussion must weigh the benefits of screening (early treatment, family information, equity) against the drawbacks (cost, accuracy, uncertain long-term safety).
Arguments in favour:
- MLD is an autosomal recessive disease, so a child can be affected even when neither parent nor any family member has the disease / there is no family history; screening therefore identifies cases that would otherwise be missed.
- Gene therapy (Libmeldy®) must start before symptoms appear; neonatal screening enables early detection and so gives affected children the chance of curative treatment.
- Early treatment can improve quality of life / extend life expectancy for an otherwise severely disabling and life-limiting disease.
- A positive result would inform family planning for future pregnancies (parents and relatives could be offered carrier testing and genetic counselling).
- Because the blood sample is already taken for routine neonatal screening, adding an MLD test requires no extra invasive procedure for the baby.
Arguments against / cautions:
- The screening test and (especially) the gene therapy are extremely expensive, raising questions about the opportunity cost of funding one rare disease when the same money could benefit many more people with common conditions.
- The test may give false positives or false negatives, causing unnecessary anxiety or false reassurance.
- The long-term safety and efficacy of Libmeldy® is not yet fully known (treatment only became available in 2022), so screening commits families to an intervention of unproven long-term outcome.
Conclusion
A defensible position is that neonatal screening for MLD is justified only in countries that can afford both the screening programme and the gene therapy, because the medical benefit depends on access to early treatment; in lower-resource settings the same money may be better spent elsewhere.
Discussion — for: detects cases with no family history, allows early curative treatment, improves life expectancy, informs family planning, uses existing sample. Against: high cost of test and treatment, possible inaccuracy, long-term effects of gene therapy unknown.
Background Concept
Neonatal screening is a public-health programme in which newborn babies are tested for certain genetic or metabolic conditions that benefit from very early intervention (the classic UK example is the heel-prick test for phenylketonuria, PKU). Decisions about whether to add a condition to a screening programme are usually judged against the Wilson and Jungner criteria, which include:
- the condition is an important health problem;
- there is an accepted treatment;
- facilities for diagnosis and treatment are available;
- the test is suitable and acceptable;
- the cost of case-finding is balanced against the benefit.
MLD fits several of these well (important health problem, treatment now exists) but fails others (cost, uncertain long-term outcome). The discussion in this question is therefore genuinely balanced.
MLD itself is caused by mutations in the ARSA gene (chromosome 22), inherited in an autosomal recessive pattern. Both parents of an affected child are typically unaffected carriers — there is often no family history of the disease.
Understanding the Question
The stem supplies four pieces of background:
- MLD is autosomal recessive, very rare (1 in 40 000 births), with reduced life expectancy.
- It causes severe disability and previously had no cure.
- A new gene therapy (Libmeldy®) is available from 2022, but only works if given before symptoms appear and is extremely expensive.
- Most countries already perform neonatal screening for other diseases using the same blood sample.
The candidate is asked to discuss the social and ethical considerations of adding MLD to that screening programme, assuming gene therapy is available in the country. "Discuss" demands a balanced argument with points on both sides, not a one-sided essay.
Approach
Structure the argument around three questions:
- Who benefits? (the child, the family, society)
- At what cost? (financial, psychological, medical)
- With what certainty? (test accuracy, long-term outcome of treatment)
For each, give at least one mark-worthy point on each side where possible, and aim to use the information supplied in the stem.
Step-by-Step Reasoning
Argument 1 — MLD can affect children with no family history. Because MLD is autosomal recessive, two unaffected carrier parents can have an affected child. Screening therefore identifies cases that would otherwise be missed — a positive social argument for inclusion. (mark point 1)
Argument 2 — Early detection is essential for treatment to work. Libmeldy® must be given before symptoms appear. Without screening, the diagnosis would normally be made only after irreversible neurological damage has occurred, by which time the therapy is useless. Screening therefore directly enables curative treatment. (mark point 2)
Argument 3 — Improved outcome. Early treatment can greatly improve the child's quality of life and life expectancy, transforming a fatal childhood disease into a survivable one. (mark point 3)
Argument 4 — Family planning. A positive neonatal screen alerts the family and extended relatives (who may also be carriers) to the risk in future pregnancies. They can be offered genetic counselling and prenatal testing in subsequent pregnancies. (mark point 4)
Argument 5 — No extra sampling. Neonatal screening is performed on a blood sample already taken for other tests; adding MLD adds no further invasive procedure for the baby. (mark point 5)
Argument 6 — Cost of screening. Screening an entire newborn population for a disease affecting only 1 in 40 000 is expensive per case detected. Healthcare budgets are finite; money spent on MLD screening is not available for other services. (mark point 6)
Argument 7 — Cost of treatment. Even if a baby is screened positive, the gene therapy itself is described as extremely expensive — likely beyond the reach of most families without state funding, raising issues of equity of access. (mark point 7)
Argument 8 — Test accuracy. No screening test is perfect; false positives cause unnecessary anxiety and possibly unnecessary treatment, false negatives give false reassurance. (mark point 8)
Argument 9 — Unknown long-term effects of the gene therapy. The treatment only became available in 2022; its long-term safety and durability of cure are not yet established. Committing a child to a novel therapy carries unknown risks. (mark point 9)
Any four of these nine points, with a sensible mix of for-and-against, earns full marks. The strongest answers explicitly link each point back to the information in the stem (autosomal recessive, treatment must be early, expensive, 2022) and to a named ethical principle (autonomy, justice, non-maleficence, equity).
Key Takeaways
- "Discuss" means present both sides, not just the advantages.
- Use the stem's information: autosomal recessive (no family history needed), gene therapy only works if early, very expensive.
- Common ethical principles to deploy: autonomy (parental choice), beneficence (improving the child's life), non-maleficence (avoid harm from inaccurate tests or unknown treatment effects), justice (fair allocation of healthcare resources).
- A strong conclusion states a defensible position; a weak conclusion merely summarises both sides without taking a view.
Common Mistakes
- Writing a one-sided essay that only lists benefits — this caps the mark even if the points are correct.
- Repeating the same idea in different words (e.g. "early treatment is good" + "treatment before symptoms helps") instead of giving distinct points.
- Forgetting that the question specifies "in a country where gene therapy for MLD is available" — the treatment-cost point is therefore about who pays for an existing therapy, not about whether the therapy exists.
- Confusing screening with diagnosis: screening identifies likely cases in a healthy population; diagnosis confirms the disease in a person with symptoms or a positive screen.
Things to Be Careful About
- Watch the wording: "social and ethical considerations" is broader than "medical considerations" — include family, equity and resource-allocation arguments, not just clinical ones.
- Connect each ethical point to the specific facts in the stem (rarity, recessiveness, cost, novelty of treatment). Generic ethics points ("it is right to save lives") do not score.
- Marks are awarded for any four distinct, well-justified points; aim to give five or six to be safe.
Phosphoinositide 3-kinase (PI3K) and protein kinase B (PKB) are enzymes involved in the regulation of blood glucose concentration.
Fig. 6.1 shows a cell-signalling pathway involving insulin, PI3K and PKB in a muscle cell.
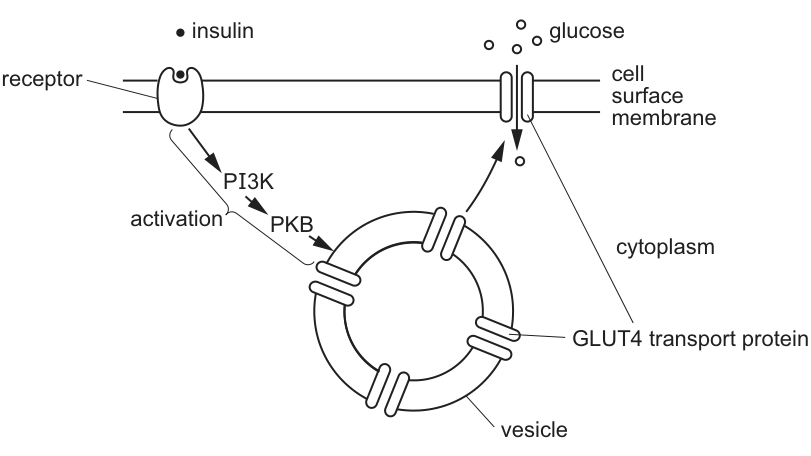
Type 2 diabetes mellitus is a common disease. Some people with type 2 diabetes have a low concentration of PI3K in their muscle cells and cannot maintain their blood glucose concentration within normal limits.
With reference to Fig. 6.1, suggest why a low concentration of PI3K can lead to type 2 diabetes.
Answer
- Less / no PKB is activated (by PI3K).
- Fewer / no vesicles, containing GLUT4, move to / fuse with the cell surface membrane.
- Fewer / no GLUT4 transport proteins are added to the membrane, so the membrane is less / not permeable to glucose.
- Less / no glucose enters the muscle cell by facilitated diffusion.
- Blood glucose concentration remains high(er) / does not decrease (within normal limits).
A low concentration of PI3K leads to insufficient activation of PKB, so GLUT4-containing vesicles do not fuse with the muscle cell surface membrane. Glucose cannot enter the cells by facilitated diffusion, so blood glucose concentration remains high.
Background Concept
Insulin is the hormone that lowers blood glucose concentration after a meal. It does not enter muscle or adipose cells; instead it binds to a specific tyrosine-kinase receptor on the cell surface membrane. This binding triggers an intracellular cascade of enzymes — in this question, PI3K (phosphoinositide 3-kinase) and PKB (protein kinase B, also called Akt). The end-point of the cascade is the insertion of GLUT4 glucose transporter proteins into the cell surface membrane. GLUT4 is stored in vesicles inside the cytoplasm; when insulin signals, these vesicles fuse with the membrane so that glucose can enter the cell down its concentration gradient by facilitated diffusion. In liver and pancreatic β-cells other transporters (GLUT2) are always present, but in muscle and fat cells GLUT4 is insulin-dependent, so the cell-signalling cascade controls how much glucose these tissues take up.
Type 2 diabetes mellitus is a disorder in which target cells become resistant to insulin, or in which the signalling cascade downstream of the insulin receptor is defective. The result is that blood glucose cannot be cleared efficiently into muscle, liver and adipose tissue, so it remains elevated (chronic hyperglycaemia).
Understanding the Question
This is a "suggest" question worth 4 marks. You are given Fig. 6.1, which is a simplified diagram of the cascade:
insulin → receptor → PI3K → PKB → vesicle (with GLUT4) → vesicle fuses with cell surface membrane → glucose enters cell.
The stem tells you that some people with type 2 diabetes have a low concentration of PI3K. You must use Fig. 6.1 to work out the chain of consequences: what happens downstream of PI3K when PI3K is scarce, and how that links back to a high blood glucose concentration.
The command word "suggest" means you are being asked to apply the pathway to an unfamiliar scenario — you are not just describing normal insulin action, you are explaining the consequences of removing a step.
Approach
Read the diagram in the direction the arrows point. PI3K sits between the insulin receptor and PKB. If PI3K is reduced, every step after it is reduced. Walk down the chain — PKB activation, vesicle movement/fusion, GLUT4 insertion, glucose entry, blood glucose level — and write each step as a separate marking point. End with the final physiological consequence (blood glucose remains high), because that is what defines diabetes.
Step-by-Step Reasoning
- PI3K activates PKB. Fig. 6.1 shows the arrow from PI3K to PKB with the label "activation". If there is less PI3K, less PKB is activated. (Marking point 1.)
- PKB normally triggers vesicle movement. The diagram shows the arrow from PKB to the vesicle. With less active PKB, fewer vesicles are triggered to move to and fuse with the cell surface membrane. (Marking point 2.)
- GLUT4 must reach the membrane. The vesicles carry GLUT4 transporters. If fewer vesicles fuse, fewer GLUT4 proteins are inserted into the cell surface membrane, and the membrane is less permeable to glucose. (Marking point 3 — note the mark scheme accepts either fewer GLUT4 added to the membrane, or the membrane being less/not permeable to glucose.)
- Glucose entry is reduced. Glucose can only enter the muscle cell by facilitated diffusion through GLUT4. With fewer transporters, less glucose is taken up. (Marking point 4.)
- Blood glucose remains high. Because muscle is a major site of glucose disposal, blood glucose is not cleared from the blood and remains higher than normal. (Marking point 5 — note the mark scheme says "blood" specifically; do not just say "glucose concentration".)
Key Takeaways
- Insulin acts through a cell-signalling cascade; the response is amplified at each step, so loss of one enzyme has a disproportionate effect on the whole pathway.
- The key end-point of insulin in muscle and fat cells is the insertion of GLUT4 into the cell surface membrane.
- In a "suggest" question on a pathway, walk step by step from the missing/defective component to the final physiological outcome, and make each step a separate mark.
Common Mistakes
- Saying "insulin cannot bind to its receptor" — the question states that insulin signalling begins normally; the problem is downstream (PI3K is low). The receptor step is unaffected.
- Saying "glucose cannot enter the cell" without naming facilitated diffusion / GLUT4. The mark scheme credits the mechanism, not just the outcome.
- Writing "glucose concentration is high" instead of "blood glucose concentration is high" — the qualifier matters because the disease is defined by the blood concentration, not the intracellular one.
- Missing the chain — for example, jumping straight from "less PI3K" to "high blood glucose" without the intermediate steps (PKB, vesicle, GLUT4). Each of those intermediates is its own mark.
Things to Be Careful About
- The mark scheme rewards quantitative/comparative wording: "less / no", "fewer / no", "remains higher". Avoid absolute statements like "PKB is inactive" if you mean "less PKB is activated" — the cascade is not all-or-nothing.
- The membrane is not "impermeable" to glucose in absolute terms; it simply has fewer GLUT4 channels. The correct wording is "less permeable" or "not as permeable".
- The mark scheme requires the word "blood" before "glucose concentration" in the final point.
Answer
- A biosensor has a recognition layer containing the immobilised enzyme glucose oxidase.
- A blood sample is added to the biosensor.
- Glucose (in the blood) passes through a partially / selectively permeable membrane to reach the immobilised enzyme.
- Glucose oxidase catalyses / oxidises glucose, producing gluconic acid and hydrogen peroxide.
- The products of the reaction are detected by a transducer, which converts the chemical signal into an electrical current.
- The current is amplified.
- The amplifier is connected to a digital / numerical / quantitative display giving a reading.
- The size of the current is proportional to the glucose concentration in the sample.
- The result is instant and accurate (compared with visual test strips).
A drop of blood is placed on the biosensor; glucose diffuses through a partially permeable membrane to immobilised glucose oxidase, which catalyses its oxidation to gluconic acid and hydrogen peroxide. A transducer converts this into an electrical current proportional to glucose concentration; the current is amplified and displayed as a digital reading, giving an instant, accurate result.
Background Concept
A biosensor is an analytical device that combines a biological recognition element (an enzyme, antibody, or whole cell) with a physical transducer that converts the biological signal into a measurable electrical one. The biological element binds or reacts with the analyte (the substance being measured) very specifically, and the transducer turns that interaction into a current, voltage, or other signal that can be quantified.
A blood glucose biosensor exploits the enzyme glucose oxidase, which is highly specific for β-D-glucose. The overall reaction is:
The hydrogen peroxide produced can be detected electrochemically — at an electrode it is oxidised, releasing electrons. The current that flows is proportional to how much H₂O₂ (and therefore how much glucose) was present in the original sample.
Biosensors are widely used by people with diabetes for self-monitoring, because they are portable, give a numerical reading, and produce a result in seconds from a tiny drop of capillary blood.
Understanding the Question
This is a 7-mark "describe" question. You are asked to give a structured account of how a biosensor measures blood glucose. The mark scheme lists ten separate credit-worthy points and asks for any seven, so you need to cover the major stages of the process: the recognition element, sample introduction, selective membrane, enzyme reaction, transducer, amplification, and quantitative readout.
A "describe" question rewards a logical sequence of clearly stated points rather than a single long paragraph. Use a numbered or bulleted layout that mirrors the order in which events happen in the device.
Approach
Think of the biosensor as a pipeline that turns glucose concentration into a digital number:
- Recognition layer — what biological molecule captures the analyte (glucose oxidase).
- Sample handling — how the blood is introduced and how glucose reaches the enzyme (partially permeable membrane).
- Enzyme reaction — what the enzyme does (oxidises glucose; products = gluconic acid + H₂O₂).
- Transduction — how the chemical change becomes an electrical signal (electrode produces a current).
- Signal processing and display — amplification and a digital read-out, with the current proportional to concentration.
A useful mnemonic is R-SET-A-D: Recognition, Sample/SElective membrane, Enzymatic reaction, Transduction, Amplification, Digital display.
Step-by-Step Reasoning
- Recognition layer (point 1). The biosensor contains glucose oxidase, immobilised on a recognition layer. This is the biological component that gives the device its specificity for glucose.
- Sample addition (point 2). A small volume of capillary blood is placed on the biosensor.
- Selective membrane (point 3). Glucose must reach the immobilised enzyme. Other blood components (red cells, proteins) are excluded by a partially / selectively permeable membrane that lets small molecules like glucose through but keeps out larger components. This protects the enzyme and prevents interference.
- Enzyme reaction (points 4–5). Glucose oxidase catalyses the oxidation of glucose. The two products are gluconic acid and hydrogen peroxide (H₂O₂). The mark scheme rewards naming both products.
- Transduction (point 6). A transducer (electrode) detects the products and converts the chemical signal into an electrical current.
- Amplification (point 7). The current is very small, so it is amplified before being read.
- Display (points 8–9). The amplified current is shown on a digital / numerical display as a quantitative value. The size of the current is proportional to the glucose concentration — this is the key relationship that allows the device to give a true concentration reading rather than just a yes/no answer.
- Advantages (point 10). The result is instant (seconds) and accurate / quantitative (an actual number, not just a colour comparison like a urine dipstick or older test strip).
Key Takeaways
- A biosensor has three essential parts: a biological recognition element (glucose oxidase), a transducer (electrode producing a current), and a display (digital readout).
- The reaction catalysed by glucose oxidase is the chemical basis: glucose + O₂ → gluconic acid + H₂O₂.
- Quantitative output (a number, not a colour) and the proportionality between signal and analyte concentration are what distinguish a biosensor from a simple test strip.
Common Mistakes
- Writing only "an enzyme is used" without naming glucose oxidase. The mark scheme requires the specific enzyme.
- Omitting the partially permeable membrane — students often describe the device as if the blood simply contacts the enzyme directly.
- Naming only one of the two products (gluconic acid and hydrogen peroxide are both required).
- Confusing the biosensor with a urine test strip (e.g. mentioning a colour change compared with a chart). The mark scheme rejects the colour/comparison approach because biosensors give a digital, current-based reading.
- Forgetting the amplifier, or forgetting to say that current is proportional to glucose concentration.
Things to Be Careful About
- "Describe" questions on biosensors always expect the order of events as well as the named components. Lay the points out in the sequence in which the sample encounters each part of the device.
- Use the precise term transducer for the component that converts chemical signal to electrical signal.
- Use digital / numerical / quantitative to describe the readout — avoid "analogue", "colour" or "visual".
- The mark scheme says "any seven from ten"; aim to make seven clear, distinct points rather than padding a few points with extra words. Each numbered point above is independent and credit-worthy.
The Venus fly trap, Dionaea muscipula, is a plant that can capture insects. Each leaf of a Venus fly trap is modified to form 2 lobes.
Fig. 7.1 shows how the leaf of a Venus fly trap appears folded (closed) when an insect has been captured.
Suggest a reason why the Venus fly trap needs to capture insects, even though it carries out photosynthesis.
Answer
The Venus fly trap grows in soil that is deficient in mineral ions such as nitrate / it is found in shaded areas where the rate of photosynthesis is low, so it captures insects to obtain additional nutrients (especially nitrogen-containing compounds).
The Venus fly trap grows in soil that is deficient in mineral ions such as nitrate (or in shaded areas where photosynthesis is limited), so it captures insects to obtain additional nutrients.
Background Concept
All green plants photosynthesise: they use light energy to fix carbon dioxide into organic molecules such as sugars. Photosynthesis supplies the plant with carbohydrate (and, via further reactions, lipids), but it does NOT supply the plant with all of the elements it needs. Plants still need to absorb dissolved mineral ions from the soil — particularly nitrate (NO₃⁻) for amino acids and proteins, phosphate for DNA/ATP, magnesium for chlorophyll, and potassium for enzyme function. Dionaea muscipula is native to the waterlogged, peaty bogs of the Carolinas (USA), where the soil is acidic and very poor in nitrate and phosphate. Carnivory is therefore an adaptation that supplements the diet in an environment where the soil cannot supply enough nitrogen.
Understanding the Question
The stem tells you the Venus fly trap is a plant that photosynthesises, yet also catches insects. You must suggest a reason why the insect-trapping behaviour is still worthwhile despite the plant being able to make its own sugars.
Approach
Think about what photosynthesis can and cannot supply. Photosynthesis supplies reduced carbon (carbohydrate), but the plant still needs mineral ions — especially nitrogen — for proteins, nucleic acids and other N-containing molecules. In the boggy habitat where Dionaea lives, those ions are scarce in the soil, and some populations are also shaded by other vegetation, limiting photosynthesis. Catching prey therefore supplies what the soil and light cannot.
Step-by-Step Reasoning
- Photosynthesis supplies carbohydrate but cannot manufacture nitrogen-containing compounds from the soil if nitrate ions are scarce.
- Dionaea muscipula naturally grows in wet, peaty, nutrient-poor soils where nitrate (and phosphate) ions are limited.
- Captured insects provide proteins and amino acids that are broken down to release the nitrogen the plant needs.
- (Alternative: plants in heavily shaded habitats photosynthesise too slowly to meet all energy needs, so insect prey is an extra source of carbon/energy.) Either answer scores the mark.
Key Takeaways
Carnivorous plants are not exceptions to the rule that plants make their own sugars — they are exceptions to the rule that plants get all their nitrogen from the soil. Carnivory is an adaptation to nutrient-poor (especially nitrogen-poor) habitats.
Common Mistakes
- Saying the plant "needs food" or "needs energy" — photosynthesis already supplies energy, so this does not earn the mark.
- Saying the plant "cannot make proteins" — it can, but it needs nitrogen for the proteins, and nitrogen is what is in short supply.
- Not naming a specific mineral ion or habitat limitation.
Things to Be Careful About
The marking scheme accepts EITHER a soil-mineral answer OR a shaded-habitat answer. If you give the mineral one, name a specific ion (nitrate / phosphate) to be safe — vague phrases like "minerals from the soil" alone are not credited.
The leaves are specialised to form 2 lobes. The lobes are red on the upper surface.
Suggest why the lobes are red.
Answer
The red colour attracts insects to the trap.
The red colour attracts insects to the trap.
Background Concept
Many flowers and fruits use bright pigments — anthocyanins (red/purple) and carotenoids (yellow/orange) — to attract pollinators and seed dispersers. Anthocyanins in particular absorb green light strongly and appear vivid red to animal visual systems. The Venus fly trap exploits the same visual channel: its inner lobe surface is intensely red, mimicking the appearance of a flower or ripe fruit.
Understanding the Question
The stem points out that the upper surface of the lobes is red. You must suggest WHY that colour is advantageous.
Approach
Consider the animal that the plant is trying to manipulate (the insect prey) and what its sensory world looks like. Insects are strongly attracted to bright colours, especially in the red/yellow range, because these are typical signals of nectar or ripe fruit in their foraging environment.
Step-by-Step Reasoning
- Insects locate flowers and ripe fruit partly by colour.
- Red is a conspicuous, high-contrast colour against the green background of a bog.
- A red lobe therefore acts as a visual lure, drawing insects to land on the trigger hairs of the trap.
Key Takeaways
Bright pigmentation in carnivorous plants is an example of a plant manipulating an animal's sensory system for its own benefit — analogous to the role of petal colour in pollinator attraction.
Common Mistakes
- Saying "camouflage" — camouflage would hide the plant from prey, the opposite of what is needed.
- Saying "to perform photosynthesis" — red surfaces of these lobes are not the main photosynthetic tissue; chlorophyll is in the green outer surface.
- Confusing red colour with chlorophyll absorption — chlorophyll absorbs red light, so red surfaces actually REFLECT red wavelengths and are not the most photosynthetically active region.
Things to Be Careful About
The mark scheme only credits the prey-attraction idea. There is no need to explain the chemistry of anthocyanins.
The lobes have sensory hairs. Touching 1 sensory hair will not cause a response by the leaf. At least 2 sensory hairs need to be touched within 20 seconds to cause a response in the leaves.
State the advantage to the plant of producing a response only when 2 sensory hairs are touched within 20 seconds.
Answer
The plant is not stimulated to close by non-edible objects (e.g. raindrops or debris), so energy / ATP is not wasted.
The plant avoids wasting energy / ATP by not responding to non-edible objects such as raindrops or debris.
Background Concept
Plant movements — including the rapid nastic closure of a Venus fly trap lobe — require ATP. The ion fluxes that drive the sudden loss of turgor in the motor cells, and the subsequent recovery of turgor when the trap reopens, are all ATP-requiring processes. A trap closure that turns out to be a false alarm therefore costs the plant real metabolic energy, and the reopening takes days.
Sensory systems in animals and plants often use coincidence detection — requiring two near-simultaneous signals before firing — as a way to filter out background noise. The Venus fly trap's "two hairs within 20 seconds" rule is exactly this.
Understanding the Question
You are told that one hair is not enough; two must be touched within 20 s to trigger closure. You have to suggest why this requirement is useful TO THE PLANT.
Approach
Think of all the non-prey things that could brush a single sensory hair — a raindrop, a falling leaf, a passing spider's leg, wind-blown debris. Each would trigger a closure, and the plant would spend days reopening without gaining any nitrogen. Then ask what two hairs touched within 20 s really signifies: something large and moving (i.e. an insect walking across the trap), not a single small event.
Step-by-Step Reasoning
- Trap closure and reopening costs ATP and several days of lost photosynthesis.
- A single hair could be triggered by a raindrop, a leaf fragment, or wind-blown debris — none of which are prey.
- Two hairs stimulated within 20 s almost certainly means a struggling insect is moving across the lobe — the trigger is biologically meaningful.
- The plant therefore avoids wasting energy/ATP by closing only when the stimulus is likely to be genuine prey.
Key Takeaways
Sensory thresholds in biology are usually set high enough to suppress false positives; the cost of a wrong response (wasted ATP, lost foraging opportunity) is balanced against the cost of missing a real stimulus (a lost meal). The "two hairs in 20 s" rule is the plant's filter for distinguishing a real insect from random mechanical noise.
Common Mistakes
- Saying "to make sure it really is an insect" — too vague; the mark scheme wants the energy/ATP argument.
- Saying "to kill the insect" — the trap does not kill the insect by closing; digestion does that over days.
- Talking about digestion time — that is the subject of part (a)(iv), not (iii).
Things to Be Careful About
The mark scheme credits the energy/ATP point. Mention "energy" or "ATP" explicitly; do not leave it as "wasteful" alone.
When an insect has been trapped, the leaves have to remain closed for a number of days.
Suggest why this needs to happen.
Answer
Time is needed for enzymes to digest the insect and for the products of digestion to be absorbed (and assimilated) by the plant.
Time is needed for enzymes to digest the insect and for the soluble products to be absorbed by the plant.
Background Concept
Like animal digestion, plant carnivory depends on hydrolytic enzymes — proteases, phosphatases, nucleases — that break the prey's proteins, nucleic acids and other macromolecules into soluble products (amino acids, phosphate, sugars). These products are then absorbed across the inner surface of the trap and assimilated into the plant's metabolism. None of this happens instantaneously.
Understanding the Question
The stem says the trap must stay closed for several days. You must suggest why a multi-day closure is necessary rather than the trap reopening almost immediately.
Approach
Think about what has to happen while the trap is closed: enzymes must act on the prey (digestion), and the resulting soluble molecules must move into the plant tissue (absorption). Both processes are slow compared to the snap-closure of the lobes.
Step-by-Step Reasoning
- Enzymes secreted by glands on the inner lobe surface must hydrolyse the insect's proteins, chitin and nucleic acids.
- The soluble products of digestion must be absorbed across the lobe epidermis.
- Once inside the plant, the products must be assimilated into amino acids, nucleotides and other metabolites.
- All of these are enzyme-catalysed, diffusion-limited processes that take hours to days — far longer than the ~0.1 s trap-closure itself.
Key Takeaways
Carnivorous-plant trapping is a multi-stage process: rapid mechanical closure (seconds), enzyme secretion and digestion (hours–days), absorption and assimilation (hours–days). The duration of closure is matched to the slowest of these — usually digestion.
Common Mistakes
- Saying "to kill the insect" — most insects are still alive when first trapped; death is a by-product of digestion, not a goal in itself.
- Saying "to digest the insect" alone is fine, but "to digest and absorb" is better; the mark scheme credits both.
- Confusing this with part (iii): (iii) is about not wasting energy on false triggers; (iv) is about the genuine digestion phase.
Things to Be Careful About
Any one of the words digestion, enzyme action, absorption or assimilation is enough for the mark — but pick the one that best matches your phrasing.
Action potentials are produced by the Venus fly trap during the closure of a leaf. Each action potential is also associated with a refractory period. This is similar to the action potential and refractory period observed in a mammalian neurone during nerve impulse transmission.
Explain the role played by the refractory period in the transmission of an impulse in a mammalian neurone.
Answer
- The refractory period ensures that action potentials are discrete (separate) events, so one impulse cannot merge into another.
- The refractory period makes action potentials unidirectional — the membrane behind the impulse is in refractory period and cannot be re-stimulated, so the impulse can only travel forwards.
- The refractory period determines / limits the maximum frequency of action potentials, because a new impulse can only be initiated once the previous refractory period is over.
The refractory period makes action potentials discrete, unidirectional events and limits their maximum frequency of transmission.
Background Concept
An action potential is a brief, all-or-nothing depolarisation of the membrane that travels along a neurone. It is followed by an absolute refractory period — during which voltage-gated Na⁺ channels are inactivated and no stimulus, however strong, can trigger another action potential — and a relative refractory period — during which a stronger-than-normal stimulus is needed to reach threshold because some Na⁺ channels are still inactivated and K⁺ channels are still open.
Together, these two phases constitute the refractory period. The refractory period is not just an unavoidable consequence of ion-channel kinetics — it is essential to how a nerve impulse is shaped.
Understanding the Question
You are told that Venus fly traps produce action potentials with a refractory period similar to those in mammalian neurones. You must EXPLAIN the role of the refractory period in the transmission of a nerve impulse in a mammalian neurone. Three marks are available, so three linked points are expected.
Approach
Think of the refractory period as a brief "dead zone" in the membrane behind the action potential. Ask yourself what consequences this dead zone has for the shape, direction and frequency of the impulse. The three consequences the mark scheme rewards are: (1) discreteness, (2) unidirectionality and (3) frequency limitation.
Step-by-Step Reasoning
Point 1 — discreteness of impulses.
During the refractory period the Na⁺ channels cannot reopen. This means a second action potential cannot be triggered on top of the first — they cannot summate or merge. Each impulse therefore remains a discrete, separate event with a clear beginning and end.
Point 2 — unidirectionality of impulses.
The membrane immediately behind the advancing action potential is in its refractory period. Even if a stimulus reached that region, it could not re-excite it. The action potential can therefore only move on into the next region of resting membrane ahead of it. This forces the impulse to travel in one direction only along the axon, from the receptor (or cell body) towards the synapse.
Point 3 — frequency limit.
Because the membrane cannot fire again until the refractory period is over, there is a minimum time interval between successive action potentials. In a mammalian motor neurone this gives a maximum firing rate of a few hundred impulses per second (the AVP mark-scheme example is "200–300 action potentials per second"). The refractory period therefore sets an upper limit on how often a neurone can signal — important because frequency of impulses encodes stimulus intensity.
Key Takeaways
The refractory period is not just a recovery phase — it is the reason nerve impulses are single, all-or-nothing pulses that march in one direction only along an axon and that cannot occur faster than a maximum frequency. Without the refractory period, impulses would merge, travel in both directions, and the frequency code would collapse.
Common Mistakes
- Saying "the neurone rests" — the refractory period is not rest; it is an active, ion-channel-mediated state.
- Saying only "limits frequency" without explaining why (must connect frequency limit to the inability to re-stimulate the membrane during the refractory period).
- Confusing absolute and relative refractory periods, or omitting the fact that the absolute refractory period is what enforces unidirectionality.
- Drifting into describing the phases of an action potential rather than the FUNCTION of the refractory period — the question asks for the role, not the events.
Things to Be Careful About
The mark scheme rewards any three of the points above. To be safe, aim to cover all three (discreteness, unidirectionality, frequency limit). The "unidirectional" point is the most commonly missed — make the link between "the region behind is refractory" and "impulse cannot go backwards" explicit.
Palm oil is the most widely used vegetable oil. It is obtained from the African oil palm, Elaeis guineensis. Oil palms are the highest yielding vegetable oil crop, needing only 10% of the land area required by other crops to produce the same quantity of oil.
On the island of Borneo, tropical rainforests are cut down and cleared to create oil palm plantations. This has a large effect on biodiversity.
The Bornean orangutan, Pongo pygmaeus, is only found on the island of Borneo and is classified as critically endangered on the International Union for Conservation of Nature (IUCN) Red List of Threatened Species™.
Fig. 8.1 shows Bornean orangutans.
Answer
Any four from:
- (named) protected reserves;
- limit palm oil plantations / use sustainable palm oil production;
- restore lost habitat / reforestation / reduce deforestation;
- captive breeding programmes;
- release (captive-bred individuals) into the wild;
- ban hunting / ban trade in orangutans / their body parts;
- raise public awareness / education;
- research into the species' ecology and population.
Any four of: protected reserves; limit palm oil plantations/sustainable palm oil; reforestation/reduce deforestation; captive breeding (and release); ban hunting/trade; education; research.
Background Concept
Conservation of an endangered species requires actions that address the immediate threats (in this case, habitat loss from deforestation for oil-palm plantations and possible hunting/trade) and that maintain or rebuild populations. Strategies fall into two broad groups: in-situ conservation (protecting the species where it naturally lives) and ex-situ conservation (removing individuals from the wild to breed or safeguard them). Legislation, education, and research underpin both approaches.
Understanding the Question
The stem tells us that the Bornean orangutan (Pongo pygmaeus) is critically endangered because tropical rainforest on Borneo is being cleared for oil-palm plantations. The command word is "suggest", so the examiner will accept any reasonable, biologically sensible conservation measure — but each must be a distinct point and clearly linked to the orangutan's situation (e.g. it would not be sensible to suggest "seed banks", which are a plant-conservation measure).
Approach
Read the mark scheme's eight creditable points and select the four that best fit the orangutan case. Try to choose a mix of in-situ and ex-situ approaches, plus legislative and social ones, because the question gives four marks and the examiner is looking for breadth.
Step-by-Step Reasoning
- Protected reserves (e.g. national parks, IUCN Category I–IV areas) prevent logging and plantation expansion within defined areas of rainforest, so orangutans continue to have suitable habitat. The mark scheme explicitly accepts "named" reserves, so an example such as "Bornean Orangutan Sanctuary" is fine.
- Limit palm oil plantations / use sustainable palm oil directly addresses the named threat in the stem. Certification schemes (e.g. RSPO) reduce the rate of forest conversion.
- Restoring lost habitat / reforestation rebuilds forest that has already been cleared, eventually re-connecting fragmented populations and allowing population sizes to increase.
- Captive breeding programmes maintain a safety-net population in zoos/sanctuaries and can supply individuals for release.
- Release into the wild (a follow-up to captive breeding) re-establishes or augments wild populations. This and the previous point are paired in the mark scheme, so if both are written they are credited.
- Ban hunting / trade removes a direct source of mortality. International trade is controlled under CITES, and orangutans are listed on Appendix I, which prohibits commercial trade.
- Raise awareness / education changes consumer behaviour (e.g. choosing sustainable palm oil) and reduces demand for illegal pet trade.
- Research into population size, distribution, genetics and ecology is essential for designing and monitoring the other measures.
Any four of these are worth one mark each.
Key Takeaways
- Conservation has in-situ and ex-situ components; both are needed for critically endangered species.
- The best answers tailor the measure to the named threat — here, deforestation for oil palm is the headline pressure, so habitat-based and palm-oil-specific actions are particularly apt.
- Legislation (bans, protected-area designation) and socio-economic measures (education, certification) are equally part of conservation.
Common Mistakes
- Suggesting seed banks or frozen zoos for an animal — these are appropriate for plants or for genetic material, not for a mammal like the orangutan.
- Vague answers like "look after them better" or "stop pollution" — too general to credit.
- Repeating the same idea twice in different words — e.g. "ban hunting" and "stop killing orangutans" earn only one mark.
Things to Be Careful About
- "Suggest" questions have many acceptable answers, but each answer must be a specific, distinct measure. Generic statements such as "conserve them" score nothing.
- Where the mark scheme uses "R" or "reject" annotations elsewhere, "R" is not present here, but be aware that the mark scheme caps this question at four marks even though eight points are listed — only the best four need to be offered.
Biodiversity can be assessed at different levels.
Outline the main levels at which biodiversity can be assessed.
Answer
- Ecosystem (habitat) diversity — variety of different ecosystems/habitats in an area;
- Species (diversity / richness) — number of different species and their relative abundance;
- Genetic diversity — variety of alleles / genes within a species (or within a population).
Ecosystem (habitat) diversity; species diversity (richness); genetic diversity.
Background Concept
Biodiversity is a multi-level concept: it is not just "how many species are there?" but also "how different are the habitats?" and "how varied are the genes inside a single species?" The Cambridge syllabus treats these as three nested, complementary levels.
Understanding the Question
The command word is "outline", which means a short description of each level is enough — one sentence or a tight bullet per level. Three marks means the examiner expects three distinct points, one for each level.
Approach
Recall the three levels in order from the broadest (ecosystem) to the most specific (genetic) and give a short defining phrase for each.
Step-by-Step Reasoning
- Ecosystem (habitat) diversity — the variety of different ecosystems or habitats in a given area (e.g. rainforest, mangrove, peat-swamp, riverine). A region with many habitat types is more biodiverse at this level than one with only a single habitat.
- Species diversity (richness) — the number of different species in an area and their relative abundance. This is the level usually meant when a non-specialist talks about "biodiversity".
- Genetic diversity — the variety of alleles and genotypes within a single species (or a single population). High genetic diversity gives a species more raw material for evolution and a better chance of surviving environmental change.
Key Takeaways
- Biodiversity has three levels: ecosystem, species, genetic.
- Loss can happen at any of the three: habitat destruction (ecosystem), local extinction (species), and inbreeding / population bottlenecks (genetic).
Common Mistakes
- Listing "plants and animals" or "flora and fauna" as levels — these are groups of organisms, not levels of biodiversity.
- Confusing species richness with species evenness — the two together make up species diversity, but the level itself is just "species diversity".
- Writing only two of the three levels and splitting the third into two points — only three marks are available, so a fourth point scores nothing.
Things to Be Careful About
- "Outline" does not require a long essay; a one-line definition of each level is enough.
- Make sure the genetic-level point is about within-species variation, not about variation between species (that is species diversity).
The biodiversity of a habitat can be measured by calculating Simpson’s index of diversity ().
The formula for Simpson’s index of diversity () is:
Key to symbols:
= number of individuals of each type present in the sample
= the total number of all individuals of all types present in the sample
A survey of shrubs and trees in a temperate woodland was carried out. The results are shown in Table 8.1.
Table 8.1
| common name | |||
|---|---|---|---|
| maple | 807 | 0.196 | 0.0384 |
| alder | 6 | 0.001 | 0.0000 |
| hazel | 1856 | 0.451 | ........... |
| hawthorn | 82 | 0.020 | 0.0004 |
| blackthorn | 40 | 0.010 | 0.0001 |
| willow | 101 | 0.025 | 0.0006 |
| birch | 78 | 0.019 | 0.0004 |
| wild rose | 84 | 0.020 | 0.0004 |
| oak | 1036 | 0.252 | 0.0635 |
| dogwood | 29 | 0.007 | 0.0000 |
| Total = | ........... |
Working
Hazel:
Total of column:
Answer
Hazel: ; Total:
(n/N)² for hazel = 0.2034; Σ(n/N)² = 0.3072
Background Concept
Simpson's index of diversity is built from a sum of squared proportions, . Each term is the probability that two individuals chosen at random from the sample both belong to the same species. Summing across all species gives the probability that two random individuals are conspecific; minus that sum is the probability that they belong to different species, which is Simpson's .
Understanding the Question
The table is mostly filled in. Two cells are blank: the value for hazel (where ) and the total of the squared-proportion column. The mark scheme credits each correct value as one mark, so the job is simply to compute them.
Approach
Square hazel's value, then add up every entry in the right-hand column. The squaring step is one mark; the summation is the other.
Step-by-Step Reasoning
- Hazel: , which to four decimal places is 0.2034 (this matches the precision of the rest of the table).
- Total:
- maple 0.0384 + alder 0.0000 + hazel 0.2034 + hawthorn 0.0004 + blackthorn 0.0001 + willow 0.0006 + birch 0.0004 + wild rose 0.0004 + oak 0.0635 + dogwood 0.0000 = 0.3072.
- The mark scheme allows ecf for the second mark if the first is wrong, so even an incorrect hazel entry followed by a correctly summed total (i.e. including the candidate's own value) still earns the second mark. Watch the 4 dp format: 0.2034 is correct, but 0.20 would lose a mark.
Key Takeaways
- Always square the proportion, not the raw count.
- Match the precision (4 dp) used in the rest of the table.
- The ecf rule means a candidate can still pick up the summation mark even if they slip up on the squaring step.
Common Mistakes
- Forgetting to square 0.451 and entering 0.451 in the squared column.
- Writing 0.2034 but mis-summing the column (e.g. omitting oak's 0.0635).
- Using too few decimal places (e.g. 0.2 for hazel or 0.3 for the total).
Things to Be Careful About
- The values 0.001 (alder) and 0.007 (dogwood) square to 0.000001 and 0.000049 respectively, which round to 0.0000 at 4 dp; these are already entered in the table.
- Keep track of significant figures: 0.451 has three significant figures, so the squared result is given to four decimal places to be safe (0.2034).
Working
Answer
(accept )
0.6928
Background Concept
Simpson's index of diversity,
measures the probability that two individuals selected at random from a sample belong to different species. It runs from 0 (only one species in the sample — minimum diversity) towards 1 (very high diversity, where every individual is a different species).
Understanding the Question
Part (c)(ii) is a direct plug-in: take the total from part (c)(i) and apply the formula. The mark scheme allows ecf, so the answer is (the candidate's own total from the previous part).
Approach
Substitute the summed value 0.3072 into the formula and subtract from 1. Quote the answer to 4 dp to match the rest of the calculation, although the mark scheme also accepts 0.693 (3 dp).
Step-by-Step Reasoning
- Substitute the total from (c)(i): .
- Compute: .
- The mark scheme accepts 0.693 (rounded) as well as 0.6928. If the candidate's (c)(i) total was wrong, the ecf allows (their value) for the mark.
Key Takeaways
- Simpson's is a complement — you subtract the "same-species probability" from 1 to get the "different-species probability".
- The index is dimensionless and bounded between 0 and 1.
- Always use the candidate's own (c)(i) value if it differs from the printed 0.3072.
Common Mistakes
- Forgetting to subtract from 1 and writing 0.3072 as the answer.
- Rounding too early (e.g. quoting 0.7), which loses precision.
- Using the wrong variable (e.g. substituting or instead of ).
Things to Be Careful About
- This is a single-mark question, but the mark scheme explicitly grants ecf from (c)(i), so a slip in the previous part does not necessarily forfeit this mark.
Answer
- is closer to 1 than to 0 (and is greater than 0.5);
- therefore the temperate woodland has a high(er) biodiversity.
D is close to 1 / greater than 0.5, so the woodland has high biodiversity.
Background Concept
The value of Simpson's lies between 0 and 1. Values approaching 1 indicate very high diversity (many species with relatively even abundances); values close to 0 indicate very low diversity (one or a few species dominate). A working rule of thumb used in the syllabus and mark scheme is that a value greater than about 0.5 represents moderate-to-high diversity, while a value below about 0.5 suggests a community dominated by a few species.
Understanding the Question
Part (c)(iii) asks the candidate to comment on the biodiversity using the calculated value. The mark scheme requires two points: (1) a numerical observation about where sits on the 0–1 scale, and (2) a biodiversity interpretation.
Approach
Compare 0.6928 to the boundaries of the scale, then state the biodiversity implication. Two short sentences earn both marks.
Step-by-Step Reasoning
- is much closer to 1 than to 0, and is clearly greater than 0.5.
- A value that close to 1 means the probability that two randomly chosen trees are of different species is high; the woodland is not dominated by a single species.
- Therefore the temperate woodland has a high level of biodiversity (it is a species-rich community with reasonably even abundances).
Key Takeaways
- Simpson's is interpreted against the 0–1 scale, not in absolute units.
- "Comment" requires both a numerical comparison and a verbal conclusion.
- Even modest-looking numbers (0.69) indicate high diversity because of how Simpson's is mathematically defined.
Common Mistakes
- Writing only the numerical observation (" is closer to 1") without the biodiversity conclusion — this is worth one mark, not two.
- Stating "the biodiversity is high" without any numerical reference — worth one mark, not two.
- Misinterpreting a high as "low diversity" (e.g. confusing with , where a small value means high diversity).
Things to Be Careful About
- The mark scheme requires the numerical comparison AND the conclusion. Both must be present.
- "Comment on" expects a value-laden statement, not a paraphrase of the question.
Fig. 9.1 shows an absorption spectrum for chlorophyll a and the corresponding action spectrum for a species of plant.
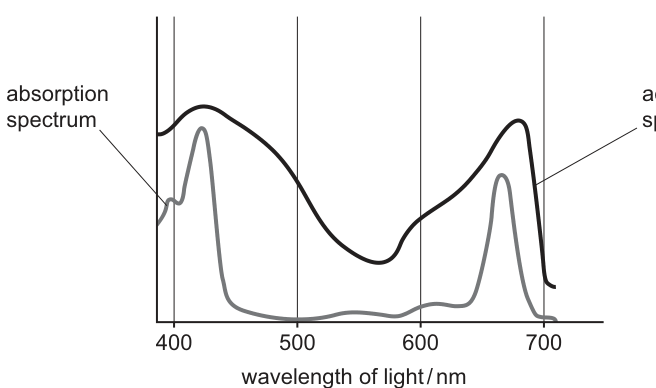
Answer
- Absorption spectrum: a graph showing the absorption of different wavelengths of light by (a named) pigment(s) such as chlorophyll.
- Action spectrum: a graph showing the rate of photosynthesis at different wavelengths of light.
Absorption spectrum: absorption of different wavelengths of light by a pigment. Action spectrum: rate of photosynthesis at different wavelengths of light.
Background Concept
Light is a form of electromagnetic radiation that travels in waves of different lengths. The visible range relevant to photosynthesis runs from about 400 nm (violet/blue) to 700 nm (red), with green/yellow light in the middle (roughly 500–600 nm). Each pigment molecule (such as chlorophyll a, chlorophyll b or a carotenoid) has its own characteristic pattern of wavelengths that it can absorb, determined by the arrangement of alternating single and double bonds in its porphyrin (chlorophyll) or isoprenoid (carotenoid) structure. When a photon of the right wavelength strikes a pigment, an electron is excited to a higher energy level, and that energy can be used to drive the light-dependent reactions of photosynthesis.
An absorption spectrum is the physical property of a pigment — a plot of how strongly it absorbs each wavelength of light. It is measured in a spectrophotometer by passing light of known wavelength through a solution of the pigment and recording how much is absorbed.
An action spectrum is the biological outcome of that absorption — a plot of the rate of photosynthesis (typically measured as released or taken up) against wavelength, using the same range of wavelengths as the light source. Comparing the two spectra tells you whether the pigments present are responsible for the photosynthesis observed.
Understanding the Question
Part (a)(i) is a straightforward 'explain what is meant by' question: it wants clean, accurate definitions of the two terms that appear on the axes of Fig. 9.1. The candidate does not yet need to discuss why the two curves differ — that comes in (a)(ii). The two marks are awarded for two complete definitions (one per spectrum), so each term must be precisely defined.
Approach
Match the wording of the mark scheme:
- Absorption spectrum — emphasise 'different wavelengths' and 'pigment(s)'. Do not say 'chlorophyll' on its own; the spectrum is a property of any pigment.
- Action spectrum — emphasise 'rate of photosynthesis' and 'different wavelengths'. Do not confuse with 'amount' or 'efficiency'.
Step-by-Step Reasoning
- An absorption spectrum is a graph plotting the proportion of light absorbed (y-axis) against the wavelength of light (x-axis) for a particular pigment. The shape of the curve is determined by the molecular structure of that pigment.
- An action spectrum is a graph plotting the rate of photosynthesis (y-axis) against the wavelength of light (x-axis) for a whole plant, chloroplast suspension, or alga. It shows how effectively each wavelength drives photosynthesis.
Key Takeaways
- The absorption spectrum is a property of isolated pigment molecules; the action spectrum is a property of the whole photosynthetic system.
- The two share the same x-axis (wavelength, in nm) and they peak at the same wavelengths if chlorophyll a is the only pigment doing the work.
- Where they diverge, accessory pigments (chlorophyll b, carotenoids) must be contributing absorbed energy to the reaction centres.
Common Mistakes
- Saying the absorption spectrum is the 'amount of light absorbed' (mark scheme wants 'absorption of different wavelengths by a pigment' — i.e. the curve is a property of the pigment, not a number).
- Confusing the action spectrum with the absorption spectrum in the definition — the action spectrum must be tied to the rate of photosynthesis.
- Writing 'photosynthetic rate' without mentioning 'at different wavelengths of light' — the wavelength axis is what makes it a 'spectrum'.
Things to Be Careful About
- Use the singular 'a pigment' or list 'pigments'; the spectrum is the property of the pigment sample, not the light source.
- 'Action' refers to the biological action of photosynthesis, not the chemical action of absorption.
Suggest and explain why the curve shown in Fig. 9.1 for the absorption spectrum is different from the curve for the action spectrum for wavelengths of light between 450 nm and 550 nm.
Answer
- Chlorophyll b and carotenoids (accessory pigments) are present in the chloroplasts of the plant.
- These accessory pigments absorb light at wavelengths (450–550 nm) that chlorophyll a alone absorbs only weakly.
- The energy they absorb is transferred to chlorophyll a in the reaction centre, where it drives the light-dependent reactions (photophosphorylation and photolysis of water).
Accessory pigments (chlorophyll b, carotenoids) absorb light at 450–550 nm and pass the energy to chlorophyll a at the reaction centre, so the action spectrum is higher than the absorption spectrum of chlorophyll a alone in this region.
Background Concept
A photosynthesising plant contains not just chlorophyll a but a mixture of pigments embedded in the thylakoid membranes:
- Chlorophyll a — the primary pigment, located in the reaction centres of PSI and PSII. It absorbs mainly blue light (around 430 nm) and red light (around 660 nm), and absorbs very little green/yellow light (500–600 nm).
- Chlorophyll b — an accessory pigment, structurally very similar to chlorophyll a but with a –CHO group instead of a –CH3. Its absorption peaks are shifted slightly, with significant absorption in the 450–470 nm blue-green region.
- Carotenoids (e.g. β-carotene, xanthophylls) — accessory pigments that absorb strongly in the blue (400–500 nm) and extend into the green region, giving them their yellow/orange colour.
All these pigments sit together in light-harvesting antenna complexes that funnel the absorbed energy, by resonance transfer, to the special pair of chlorophyll a molecules in the reaction centre (P680 in PSII, P700 in PSI). Once the energy reaches the reaction centre, it drives the light-dependent reactions: photoactivation of P680, photolysis of water, and electron transport leading to photophosphorylation.
Understanding the Question
The question points specifically at the 450–550 nm window on Fig. 9.1 and asks why the action spectrum (which measures the rate of photosynthesis) sits higher than the absorption spectrum of chlorophyll a in this region. The candidate must link the gap between the two curves to a biological cause — the presence of other pigments that are harvesting light chlorophyll a cannot.
Approach
Reach for the concept of accessory pigments and their role in the light-harvesting antenna. The argument has three parts:
- Identify what else is in the chloroplast besides chlorophyll a.
- Show that those pigments absorb strongly where chlorophyll a is weak.
- Explain how that absorbed energy still ends up driving photosynthesis (resonance transfer → reaction centre → light-dependent reactions).
Step-by-Step Reasoning
- In the 450–550 nm window of Fig. 9.1, the absorption spectrum of chlorophyll a falls to a low value (a trough between the blue and red peaks), but the action spectrum stays high. This means that wavelengths in this range are still producing a lot of photosynthesis even though chlorophyll a is not absorbing them directly.
- The chloroplast must contain other pigments that do absorb in this range: chlorophyll b (strong absorption around 450–470 nm) and the carotenoids (broad absorption in the 450–500 nm region, tailing into the green).
- These accessory pigments are arranged in light-harvesting complexes surrounding the reaction centre. When their pigment molecules absorb a photon, the excitation energy is passed from one pigment to the next by resonance transfer until it reaches the special pair of chlorophyll a molecules in the reaction centre.
- Once in the reaction centre, the energy drives the photoactivation of P680, the photolysis of water, and the rest of the light-dependent reactions, ultimately producing ATP and reduced NADP for the Calvin cycle. So even though chlorophyll a is not directly absorbing this light, the plant can still use it for photosynthesis — which is why the action spectrum sits above the absorption spectrum of chlorophyll a alone in this region.
Key Takeaways
- The action spectrum is the result of all pigments in the chloroplast working together, not just chlorophyll a.
- Accessory pigments broaden the range of wavelengths usable for photosynthesis.
- Energy transfer is by resonance (no chemical intermediate) from antenna pigments to the reaction-centre chlorophyll a.
Common Mistakes
- Saying 'chlorophyll' without specifying chlorophyll b or carotenoids (mark scheme requires naming the accessory pigment).
- Saying accessory pigments 'carry out photosynthesis themselves' — they only absorb and pass on energy; the reaction-centre chlorophyll a is where the photochemistry happens.
- Failing to mention the destination of the energy (reaction centre / light-dependent reactions) — the mark scheme credits 'for the light-dependent reactions / photophosphorylation / photolysis' as a separate point.
Things to Be Careful About
- Use the precise term 'accessory pigment' or name the specific pigment (chlorophyll b, carotenoid).
- The 450–550 nm range is the blue-green to green-yellow window, not the red. Stay within the wavelength range given in the question.
- The mark scheme has four possible points; any three of them score full marks. Cover (1) which pigment, (2) what it absorbs, and (3) where the energy goes — these are the three that always earn marks.
Scientists investigated the effect of temperature on the rate of photosynthesis and the rate of respiration of the trailing azalea, Kalmia procumbens, at a high light intensity.
Fig. 9.2 shows the results of this investigation.
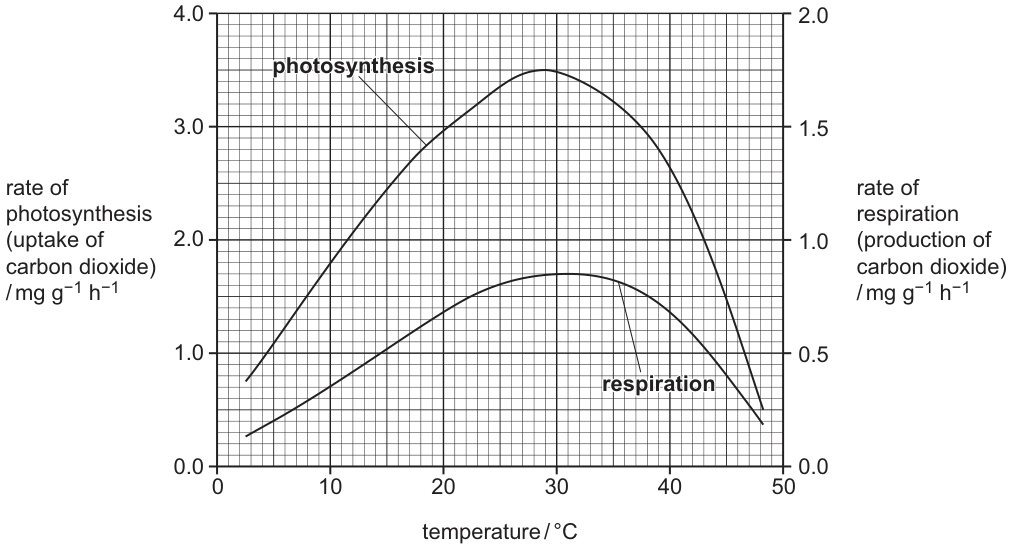
With reference to Fig. 9.2, describe and explain the effect of temperature on the rate of photosynthesis for K. procumbens.
Answer
- The rate of photosynthesis increases with temperature from 5 °C to an optimum of 29 °C, then decreases sharply above 29 °C.
- Data quote: at 5 °C the rate is 1.1 , rising to 3.5 at 29 °C.
- Increase (5–29 °C): higher temperature gives the enzymes (e.g. rubisco) more kinetic energy, so the rate of enzyme-catalysed reactions (Calvin cycle) increases; temperature is the limiting factor in this range.
- Decrease (above 29 °C): the enzymes (rubisco and the oxygen-evolving complex in PSII) denature, so their tertiary structure is lost and they can no longer catalyse the reactions, so the rate of photosynthesis falls.
Rate rises to an optimum at 29 °C (3.5 mg g⁻¹ h⁻¹) then falls: increase due to greater kinetic energy for enzymes (temperature is limiting); decrease due to denaturation of rubisco and the oxygen-evolving complex.
Background Concept
Photosynthesis consists of the light-dependent reactions (on the thylakoid membranes) and the light-independent reactions / Calvin cycle (in the stroma, catalysed by rubisco and other enzymes). All of the enzymes involved — and even the oxygen-evolving complex of PSII, which is partly protein — are sensitive to temperature in the same way as any other enzyme:
- As temperature rises towards the optimum, the enzymes and substrates have more kinetic energy. This increases the frequency of successful enzyme–substrate collisions and so increases the rate of reaction. In this range temperature is the limiting factor.
- Above the optimum temperature, the weak bonds (hydrogen bonds, hydrophobic interactions) that hold the enzyme in its specific tertiary structure begin to break. The active site loses its shape, the substrate can no longer bind, and the enzyme is said to be denatured. The reaction rate falls steeply.
A plant such as the trailing azalea Kalmia procumbens lives in cold alpine environments, so its photosynthetic enzymes are adapted to function at relatively low temperatures, with an optimum around 29 °C — well below that of many tropical plants.
Understanding the Question
The candidate is given Fig. 9.2, a graph of photosynthesis rate (left axis) and respiration rate (right axis) plotted against temperature. The instruction is to describe the shape of the photosynthesis curve and explain it in terms of enzyme behaviour. The mark scheme rewards:
- a description of the trend and identification of the optimum,
- a data quote with two temperatures, two rates, and units,
- an explanation for the rising part (kinetic energy / temperature is limiting), and
- an explanation for the falling part (denaturation).
Approach
- Describe: the curve rises, peaks, then falls — give the optimum temperature in °C.
- Quote: pick two clear points from the table, e.g. 5 °C and 29 °C, with their rates and the unit .
- Explain rise: kinetic energy → more successful collisions → faster enzyme-catalysed reactions; temperature is the limiting factor.
- Explain fall: above 29 °C, enzymes denature (specifically rubisco and/or the oxygen-evolving complex); active site loses shape; reaction rate drops.
Step-by-Step Reasoning
- Trend: between 5 °C and 29 °C, the rate of photosynthesis rises steadily. Above 29 °C, the rate falls sharply, reaching only 0.5 at 48 °C.
- Optimum: the maximum rate of 3.5 occurs at 29 °C.
- Data quote: at 5 °C the rate is 1.1 ; at 29 °C it is 3.5 . The increase over this range is 2.4 .
- Why it rises: at temperatures below the optimum, increasing the temperature gives the enzyme molecules and their substrates more kinetic energy. They move faster, collide more often, and a higher proportion of collisions have the activation energy needed for a reaction. Calvin-cycle enzymes (especially rubisco, the most abundant protein on Earth) work faster. Light intensity is high and non-limiting, so temperature is the factor limiting the rate.
- Why it falls: above 29 °C, the increasing thermal energy disrupts the hydrogen bonds and hydrophobic interactions that maintain the specific 3D shape of the enzyme's active site. The active site denatures, the substrate can no longer bind, and the enzyme's catalytic activity is lost. The oxygen-evolving complex in PSII is particularly heat-sensitive, and rubisco also begins to favour oxygenation over carboxylation, increasing photorespiration. As a result, the overall rate of photosynthesis falls steeply.
Key Takeaways
- A typical photosynthetic rate vs temperature curve is bell-shaped, with an optimum and a steep fall-off above it.
- Below the optimum, the limiting factor is temperature; above it, the limiting factor becomes the denaturation of enzymes.
- Photosynthesis has a higher temperature optimum than respiration in this species (29 °C vs ~35 °C for respiration from Fig. 9.2), suggesting different enzymes are involved, or the same enzymes have different heat stabilities in the two pathways.
Common Mistakes
- Quoting the data without units — the mark scheme insists on 'with units'.
- Quoting the peak rate and optimum but not the trend (the 'increase then decrease' shape is itself a mark).
- Saying photosynthesis is an 'enzyme' that denatures. Photosynthesis is a multi-step pathway catalysed by many enzymes; name at least one (rubisco) or the oxygen-evolving complex.
- Confusing this with the effect of temperature on respiration — the question asks about photosynthesis, and the falling part of the photosynthesis curve is steeper and at a lower temperature than the falling part of the respiration curve.
Things to Be Careful About
- The mark scheme marks description and explanation separately. Don't write only an explanation, or only a description; both are needed for the 4 marks.
- Use the unit exactly, not 'mg/g/h' or 'mg per gram per hour' — the exam mark scheme wants the printed form.
- Quote two temperatures and two rates, with units. A single data point will not earn the data-quote mark.
The rate of photosynthesis in this investigation was obtained by measuring the uptake of carbon dioxide from the atmosphere. It did not take into account the use of carbon dioxide produced by respiration.
Using Fig. 9.2, calculate the rate of photosynthesis at 20°C when the carbon dioxide produced by respiration is taken into account.
rate of photosynthesis = ______
Working
The 'apparent' (net) rate of photosynthesis measured by uptake does not include the released by the plant's own respiration. The true (gross) rate of photosynthesis is therefore:
Reading from Fig. 9.2 at 20 °C:
- apparent rate of photosynthesis (left axis)
- rate of respiration (right axis)
Answer
Rate of photosynthesis =
3.55 mg g⁻¹ h⁻¹
Background Concept
When a photosynthesising plant is in the light, two gas-exchange processes happen simultaneously:
- Photosynthesis takes up from the atmosphere (and releases ).
- Respiration releases (and takes up ).
A gas-exchange experiment in the light measures the net (apparent) rate of uptake, which is the difference between what photosynthesis takes up and what respiration releases:
To get the gross (true) rate of photosynthesis — the rate at which the Calvin cycle is actually fixing — you must add back the that respiration has put back into the air:
The two curves on Fig. 9.2 sit on different y-axes (photosynthesis on the left, respiration on the right) precisely so the candidate can read both off at the same temperature and combine them.
Understanding the Question
The question states that the measured rate does not take into account the produced by respiration. At 20 °C, read the apparent photosynthesis rate from the left axis and the respiration rate from the right axis, then add them to find the true rate. Two marks: one for the numerical value (in the mark scheme's accepted range 3.525–3.675), one for the unit.
Approach
- Read the photosynthesis curve at 20 °C, using the left y-axis (rate of photosynthesis).
- Read the respiration curve at 20 °C, using the right y-axis (rate of respiration).
- Add the two values.
- Quote the answer with units.
Step-by-Step Reasoning
- Locate 20 °C on the x-axis. Move vertically up to the photosynthesis curve (the higher curve, peaking at 3.5 around 28 °C). The left-axis reading is approximately 2.95 (this is the value the mark scheme's own data table records at 20 °C).
- At the same x-coordinate, move vertically up to the respiration curve (the lower curve, peaking at 0.8 around 35 °C). The right-axis reading is approximately 0.6 (between 0.5 and 0.7).
- Add them: .
- This falls inside the mark scheme's accepted range of 3.525–3.675, so the value is correct.
- The mark scheme splits the 2 marks: 1 mark for the numerical value in the accepted range, 1 mark for the correct unit .
Key Takeaways
- 'Apparent' (net) photosynthesis is what gas-exchange measures; 'true' (gross) photosynthesis is what the Calvin cycle is actually doing.
- True photosynthesis = apparent photosynthesis + respiration (since respiration produces that cancels out part of the taken up by photosynthesis).
- When a graph has two y-axes, read each curve against its own axis label and scale.
Common Mistakes
- Reading the respiration rate against the left axis by mistake — it would look much higher than it is and the answer would be wrong.
- Subtracting respiration instead of adding it. The question explicitly tells you that respiration produces , which means the measured uptake is less than the true uptake; you must add respiration back on.
- Forgetting the unit. The mark scheme gives one mark for the unit, written in the form (or equivalently mg g⁻¹ h⁻¹).
- Quoting a value to too many significant figures. The mark scheme's range (3.525–3.675) implies two decimal places from a graph read.
Things to Be Careful About
- Use the printed unit exactly: .
- The photosynthesis value (2.95) is confirmed in the mark scheme's data table, so the only source of variation is the respiration reading at 20 °C — accept any value that gives a sum in 3.525–3.675.
- This is a two-step task: read both values, add them. Candidates who forget the + respiration step typically answer 2.95, which scores zero.
Nerve impulses can be transmitted along a myelinated motor neurone to a neuromuscular junction at fast speeds of up to .
Outline how a transmission speed of is achieved by the neurone.
Answer
- The myelin sheath (Schwann cells) acts as an electrical insulator, preventing ion movement across the axon membrane in the myelinated regions.
- Depolarisation / the action potential can only occur at the nodes of Ranvier, where the membrane is exposed.
- Action potentials jump from node to node (saltatory conduction), with long local circuits between nodes giving a faster apparent conduction velocity.
Saltatory conduction via the myelin sheath and nodes of Ranvier.
Background Concept
Neurones transmit electrical signals (action potentials) along their length. In an unmyelinated axon the action potential must be regenerated at every point along the membrane — voltage-gated Na⁺ channels open, Na⁺ floods in, the membrane reverses polarity, K⁺ then leaves, and the cycle repeats a micrometre further along. This is continuous conduction and is relatively slow because the local circuits of passive depolarisation are very short.
In a myelinated axon, Schwann cells wrap tightly around the axon, leaving only the nodes of Ranvier exposed. Myelin is lipid-rich and acts as an excellent electrical insulator: ions cannot cross the membrane in the wrapped regions, and the membrane capacitance is dramatically reduced. The action potential therefore cannot be regenerated in the myelinated stretches; it can only be regenerated at the nodes, where the membrane is bare and densely packed with voltage-gated Na⁺ channels.
Understanding the Question
The stem sets a myelinated motor neurone conducting at up to and asks for an outline of how this speed is achieved. The command word "outline" means a short, structured description of the main features, not an essay. Three marks means three distinct creditable points. The figure is signalling that the answer is about saltatory conduction rather than about the action potential itself.
Approach
Reach for the concept of saltatory conduction. State that myelin insulates, that depolarisation is restricted to the nodes, and that the action potential therefore "jumps" from node to node. The mark scheme additionally credits longer local circuits and a wide axon diameter as alternative points (AVP).
Step-by-Step Reasoning
- The myelin sheath is formed by Schwann cells wrapped concentrically around the axon. Its lipid-rich membranes act as an electrical insulator, so ions cannot flow across the membrane in the wrapped regions.
- Because no ion movement is possible through myelin, depolarisation and the action potential can only be regenerated at the nodes of Ranvier, where the axon membrane is exposed and densely packed with voltage-gated Na⁺ channels.
- The action potential therefore effectively "jumps" from one node to the next — this is saltatory conduction (from the Latin saltare, to leap).
- Between nodes, depolarisation spreads passively as a local circuit. In a myelinated axon these local circuits are much longer than in an unmyelinated axon (myelin reduces capacitance and increases the length constant), so the impulse effectively leaps long distances without continuous regeneration.
- (AVP) A wider axon diameter also increases conduction velocity because internal longitudinal resistance to ion flow is lower. This is an acceptable extra marking point.
Key Takeaways
- Myelin = insulation; nodes = the only sites of action potential regeneration.
- Saltatory conduction = action potentials jumping from node to node.
- Faster than continuous conduction because local circuits are long.
- Wider axons also help.
Common Mistakes
- Stating that "the myelin sheath speeds up the impulse" — myelin does not change the local speed of the action potential itself; it allows the impulse to skip ahead in larger jumps.
- Confusing the nodes of Ranvier with synapses — they are gaps in the myelin on the same neurone, not connections between neurones.
- Stating that impulses "jump" without explaining that they must be regenerated at each node.
Things to Be Careful About
- The mark scheme explicitly rejects the word "impulses" for point 2 — use "depolarisation" or "action potential".
- The mark scheme offers an AVP slot, so a correct additional point (e.g. wide axon diameter) is also acceptable for one of the three marks.
When a nerve impulse reaches the neuromuscular junction, acetylcholine is released and diffuses to the sarcolemma.
Describe how the release of acetylcholine can result in the binding of calcium ions to troponin in the sarcomere.
Answer
- Acetylcholine (ACh) binds to receptors on the sarcolemma, opening (ligand-gated) Na⁺ channels; Na⁺ enters the muscle cell, depolarising the sarcolemma.
- The depolarisation / action potential spreads down the T-tubules.
- Voltage-gated Ca²⁺ channels open in the sarcoplasmic reticulum (SR) membrane.
- Ca²⁺ diffuses out of the SR and binds to troponin on the thin filament.
ACh → Na⁺ entry → sarcolemma depolarised → action potential down T-tubules → SR Ca²⁺ channels open → Ca²⁺ binds to troponin.
Background Concept
The neuromuscular junction (NMJ) is the synapse between a motor neurone and a skeletal muscle fibre. The motor neurone's axon terminal sits in a shallow trough on the muscle surface, separated from the sarcolemma by a narrow synaptic cleft. When an action potential reaches the terminal, voltage-gated Ca²⁺ channels in the presynaptic membrane open, Ca²⁺ enters, and vesicles of acetylcholine (ACh) fuse with the presynaptic membrane, releasing ACh into the cleft. ACh then diffuses across the cleft and binds to nicotinic receptors on the sarcolemma.
The sarcolemma is not a flat sheet — it has deep invaginations called transverse tubules (T-tubules) that run into the interior of the muscle fibre. Wrapped around the myofibrils is a network of modified endoplasmic reticulum called the sarcoplasmic reticulum (SR), which is the Ca²⁺ store of the muscle cell. The T-tubules lie very close to the SR, so that an electrical signal reaching the T-tubule can rapidly open voltage-gated Ca²⁺ channels on the adjacent SR membrane.
Excitation-contraction coupling is the term for the chain of events that links an action potential in the sarcolemma to the release of Ca²⁺ around the myofibrils, and ultimately to the binding of that Ca²⁺ to troponin on the actin filaments.
Understanding the Question
The stem reminds you that ACh is released and diffuses to the sarcolemma. The command word is "describe", asking you to trace the chain from ACh binding on the sarcolemma through to Ca²⁺ release from the SR and its binding to troponin. Four marks means four distinct creditable points (the mark scheme offers six, of which any four are credited).
Approach
Work step by step through excitation-contraction coupling: ACh receptor → Na⁺ entry → depolarisation → T-tubules → voltage-gated Ca²⁺ channels on the SR → Ca²⁺ release → troponin binding. Use the precise terms (ligand-gated, voltage-gated, sarcolemma, T-tubules, sarcoplasmic reticulum) because each is a marking point.
Step-by-Step Reasoning
- ACh diffuses across the synaptic cleft and binds to receptors on the sarcolemma. The receptors are nicotinic, ligand-gated Na⁺ channels.
- Binding of ACh opens the channels; Na⁺ flows into the muscle cell down its electrochemical gradient. This depolarises the sarcolemma, producing an end-plate potential that triggers an action potential in the adjacent membrane.
- The action potential spreads across the surface of the sarcolemma and is carried deep into the fibre by the T-tubules, which are continuous with the sarcolemma.
- The depolarisation of the T-tubule membrane activates voltage-gated Ca²⁺ channels (dihydropyridine receptors coupled to ryanodine receptors) on the membrane of the sarcoplasmic reticulum. Note: the trigger for these channels is the voltage change, not extracellular Ca²⁺.
- Ca²⁺ stored in the SR at very high concentration flows out into the sarcoplasm down its concentration gradient.
- The Ca²⁺ diffuses to the thin filaments and binds to troponin, changing its shape and pulling tropomyosin away from the myosin-binding sites on actin.
Key Takeaways
- ACh → Na⁺ entry → depolarisation → T-tubule → voltage-gated Ca²⁺ channels on SR → Ca²⁺ release → troponin binding.
- The Ca²⁺ that triggers contraction is from internal stores (the SR), not from outside the cell.
- Two distinct channel types: ligand-gated (ACh receptor = Na⁺ channel on the sarcolemma) and voltage-gated (Ca²⁺ channel on the SR).
Common Mistakes
- Saying "Ca²⁺ enters the cell" as the next step after ACh binding — the ion that enters first is Na⁺, not Ca²⁺.
- Confusing the sarcoplasmic reticulum with the sarcoplasm — the SR is a separate membrane-bound compartment, not the cytoplasm.
- Omitting the T-tubule step, or saying the action potential "diffuses through the cell".
- Saying "Ca²⁺ channels on the sarcolemma" — the channels on the SR membrane are a different population from those on the sarcolemma.
Things to Be Careful About
- "Voltage-gated" is a specific mark-scheme requirement for the SR Ca²⁺ channels — say it.
- "Ligand-gated" is implicitly required for the ACh/Na⁺ channel pair; saying simply that "channels open" is weaker.
- The Ca²⁺ that binds to troponin is the same Ca²⁺ that flowed out of the SR — do not introduce an additional source.
Muscle contraction can be affected by a low blood glucose concentration.
Suggest how a low blood glucose concentration would affect the functioning of the sarcomere.
Answer
- Low blood glucose → decreased rate of respiration → less / no ATP produced.
- Less ATP available to pump Ca²⁺ back into the sarcoplasmic reticulum, so Ca²⁺ remains bound to troponin and myosin heads cannot detach from actin.
- The sarcomere cannot relax / is permanently contracted (rigor); or contraction is slower and the power stroke is weaker.
Less ATP → Ca²⁺ remains bound to troponin → sarcomere cannot relax.
Background Concept
Skeletal muscle contraction is powered by ATP, which is needed for three distinct steps:
- The hydrolysis of ATP by the myosin head, which cocks the head into its high-energy position and provides the energy for the power stroke (the movement of actin relative to myosin).
- The binding of a new ATP molecule to the myosin head, which causes myosin to detach from actin — without this, cross-bridges cannot break.
- Active reuptake of Ca²⁺ into the sarcoplasmic reticulum by the SERCA (sarcoplasmic/endoplasmic reticulum Ca²⁺-ATPase) pump. While Ca²⁺ remains bound to troponin, the sarcomere cannot relax.
Glucose is the principal respiratory substrate for most cells, including skeletal muscle. A low blood glucose concentration (hypoglycaemia) means less glucose reaches the muscle cells by facilitated diffusion, so the rate of aerobic respiration (and of glycolysis) falls, and less ATP is generated per unit time. Anaerobic respiration can continue briefly but cannot sustain the ATP demand of active muscle.
Understanding the Question
The command word is "suggest" — you are being asked to apply what you know about muscle contraction to a new scenario (low blood glucose). The stem tells you the link exists; you must construct the mechanism. Three marks means three distinct creditable points. The most common correct chain is: low glucose → less respiration → less ATP → Ca²⁺ not pumped back into SR → sarcomere cannot relax. The less obvious step is the role of ATP in relaxation, which many students miss — without ATP, the muscle cannot let go.
Approach
Start at the top of the chain (substrate availability) and work down to the sarcomere level. Show that ATP has at least two critical roles in the sarcomere, both of which are compromised by a fall in ATP supply: powering the power stroke and reuptake of Ca²⁺ into the SR.
Step-by-Step Reasoning
- Low blood glucose reduces the substrate available for respiration in the muscle cell. With less glucose, the rate of glycolysis, the link reaction, Krebs cycle and oxidative phosphorylation all decrease, so the rate of ATP synthesis falls.
- ATP is required by the SERCA pump to actively transport Ca²⁺ from the sarcoplasm back into the lumen of the sarcoplasmic reticulum. Without sufficient ATP, this pump runs slowly (or not at all), so Ca²⁺ accumulates in the sarcoplasm and remains bound to troponin.
- Because troponin stays bound to Ca²⁺, tropomyosin remains displaced from the myosin-binding sites on actin, so myosin heads continue to form cross-bridges. The sarcomere is therefore permanently contracted and cannot relax — this is essentially rigor. (The mark scheme accepts "paralysis" as an alternative wording.)
- Additionally, with less ATP available, the hydrolysis of ATP by the myosin head (which powers the power stroke) is reduced, so the speed of sarcomere shortening and the force of contraction are reduced; and the detachment step (which needs a new ATP to bind) is also impaired, so cross-bridges are not broken efficiently.
- Both directions of effect are valid to mention: failure of relaxation (the more obvious answer) and weaker/slower contraction (the alternative).
Key Takeaways
- ATP is required both for contraction and for relaxation.
- Without ATP, Ca²⁺ cannot be pumped back into the SR, so the sarcomere stays contracted.
- Rigor mortis after death is the real-world illustration of ATP depletion in muscle — exactly the situation this question describes.
Common Mistakes
- Stating that there is "less energy" without naming ATP — the marking point requires the word ATP.
- Forgetting that relaxation requires ATP, and saying only that contraction will slow down.
- Saying the muscle "weakens" without explaining the mechanism.
- Saying "no respiration" (rather than "decreased respiration") — muscle can still respire other substrates, and anaerobic respiration can continue briefly.
Things to Be Careful About
- The mark scheme accepts either "permanently contracted / cannot relax" or "slower / weaker contraction" — give the first as the main point and the second as a bonus if room allows.
- "Rigor" or "paralysis" are credited, but be ready to justify the term.
- The question says "low blood glucose", not "no glucose" — the appropriate phrasing is "decreased rate of respiration" or "less ATP produced", not an absolute zero.