Biology 9700/54 — May/June 2025
Cambridge A-Level · Planning, Analysis and Evaluation · worked solutions for every part, with the mark scheme
Topics Planning · Analysis, Conclusions and Evaluation
A student investigated the effect of gibberellin (GA) and abscisic acid (ABA) on the germination of wheat grains.
The student found out the following information.
- The molecular mass of GA is .
- The molecular mass of ABA is .
- The range of concentrations at which GA is active in plant tissues is from to .
- The range of concentrations at which ABA is active in plant tissues is from to .
- Newly formed wheat grains contain a high concentration of ABA which decreases over time.
- When the concentration of ABA falls low enough the GA is able to promote germination.
- Wheat germinates best at temperatures from to and without light.
Fig. 1.1 shows the germination and early growth of wheat.
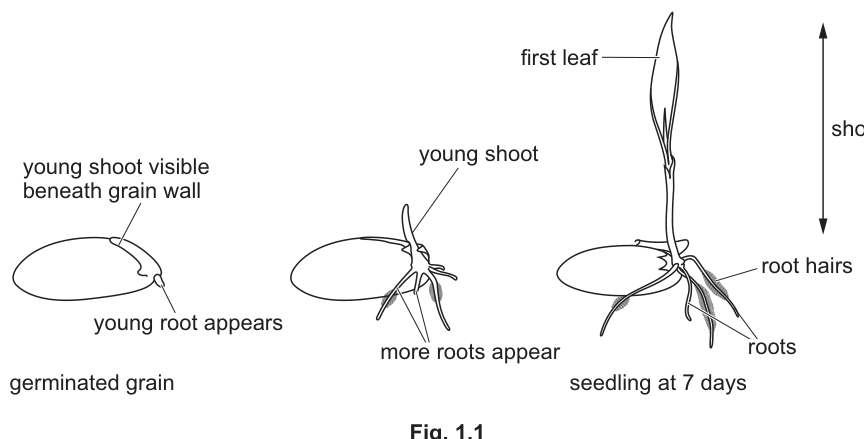
To test the effects on germination of adding ABA, the student started by soaking wheat grains for 24 hours in a solution of GA. These were then split into several groups of 50 grains and a different concentration of ABA was added to each group.
The student made a stock solution of ABA with a concentration of which was then diluted to make the solutions needed for the investigation.
Using the information about ABA above, describe how the student made a stock solution of ABA.
Answer
Weigh 0.264 g of ABA and dissolve it in distilled (deionised) water, making the volume up to 1 dm³.
0.264 g of ABA dissolved in distilled water and made up to 1 dm³.
Background Concept
A solution of stated molarity contains a fixed number of moles of solute per cubic decimetre (dm³) of solution. By definition, 1 mol dm⁻³ requires one mole (in grams equal to the molecular mass) dissolved in 1 dm³. A 1 × 10⁻³ mol dm⁻³ solution therefore requires 1/1000 of that mass in 1 dm³. The diluent must be pure (distilled or deionised) water because tap-water salts and chlorine could interfere with the grains' germination.
Understanding the Question
You are told the molecular mass of ABA is 264 g and that the student must prepare a stock solution of concentration 1 × 10⁻³ mol dm⁻³. The mark scheme credits two points: the correct diluent and the correct mass in 1 dm³.
Approach
Use
For 1 dm³ of 1 × 10⁻³ mol dm⁻³ ABA: 1 × 10⁻³ × 264 × 1 = 0.264 g. State the diluent, the mass and the final volume.
Step-by-Step Reasoning
- 1 dm³ of a 1 × 10⁻³ mol dm⁻³ solution must contain 1 × 10⁻³ mol of ABA.
- The molecular mass of ABA is 264 g mol⁻¹, so 1 × 10⁻³ mol weighs 0.264 g.
- Dissolve 0.264 g of ABA in distilled (deionised) water.
- Make the solution up to exactly 1 dm³ in a volumetric flask.
- The diluent must be distilled/deionised water so contaminants do not affect germination.
Key Takeaways
- Molarity (mol dm⁻³) × molecular mass (g) × volume (dm³) gives the mass of solute.
- A stock solution is the concentrated solution from which all working dilutions are subsequently prepared.
- Distilled/deionised water is required to avoid confounding variables.
Common Mistakes
- Stating 264 g (using the molecular mass directly, ignoring the 1 × 10⁻³ factor).
- Naming the volume but not the mass, or the mass but not the diluent.
- Saying "water" without qualifying it as distilled/deionised.
Things to Be Careful About
- "Stock solution" means concentrated; this is then diluted in part (a)(ii).
- The mass should be measured on a balance, not assumed, and the final volume should be made up precisely in a volumetric flask.
The student used the stock solution of ABA to prepare a range of dilutions from to to use in their investigation.
Each dilution had a volume of .
Describe how the student prepared these dilutions.
Answer
- Add 10 cm³ of the 1 × 10⁻³ mol dm⁻³ stock solution to 90 cm³ of distilled water to make 100 cm³ of 1 × 10⁻⁴ mol dm⁻³ ABA.
- Take 10 cm³ of this 1 × 10⁻⁴ solution, add to 90 cm³ of distilled water and mix to make 100 cm³ of 1 × 10⁻⁵ mol dm⁻³ ABA. Repeat for 1 × 10⁻⁶ and 1 × 10⁻⁷ mol dm⁻³.
10 cm³ of stock + 90 cm³ water (→ 1 × 10⁻⁴), then serial 1-in-10 dilutions down to 1 × 10⁻⁷ mol dm⁻³.
Background Concept
A serial dilution is a sequence of ten-fold (or other factor) dilutions, each made by diluting a fixed fraction of the previous solution into the next volume. It is much faster and more accurate than weighing out four separate masses. Each step reduces the concentration by the dilution factor (here 10), and the concentration is calculated by:
where V₁ is the volume transferred and V₂ is the total volume after the diluent is added.
Understanding the Question
The student has a 1 × 10⁻³ mol dm⁻³ stock and needs four working concentrations (1 × 10⁻⁴, 1 × 10⁻⁵, 1 × 10⁻⁶ and 1 × 10⁻⁷ mol dm⁻³), each made up to a final volume of 100 cm³. You must describe how to make these dilutions, but should not repeat the procedure for making the stock itself (that was part (a)(i)).
Approach
Recognise that consecutive ten-fold dilutions are the most efficient method. Show how the first dilution is performed (10 cm³ stock into 90 cm³ water to give 100 cm³ of 1 × 10⁻⁴), then describe one subsequent step (10 cm³ of that into 90 cm³ water to give 1 × 10⁻⁵, and so on).
Step-by-Step Reasoning
- First dilution: take 10 cm³ of the 1 × 10⁻³ mol dm⁻³ stock and add it to 90 cm³ of distilled water. The total volume is 100 cm³ and the concentration has fallen by a factor of 10, giving 1 × 10⁻⁴ mol dm⁻³ ABA.
- Second dilution: take 10 cm³ of this 1 × 10⁻⁴ solution and add to 90 cm³ of distilled water → 1 × 10⁻⁵ mol dm⁻³ ABA.
- Third dilution: take 10 cm³ of the 1 × 10⁻⁵ solution and add to 90 cm³ of distilled water → 1 × 10⁻⁶ mol dm⁻³ ABA.
- Fourth dilution: take 10 cm³ of the 1 × 10⁻⁶ solution and add to 90 cm³ of distilled water → 1 × 10⁻⁷ mol dm⁻³ ABA.
- Each dilution should be mixed thoroughly (e.g. using a separate glass rod or by shaking a stoppered flask) before the next transfer.
Key Takeaways
- A serial dilution multiplies small errors if the same pipette or rod is reused without rinsing — use clean, rinsed glassware between steps.
- Distilled/deionised water is the diluent of choice.
- Each working concentration must be made up to exactly 100 cm³ so that subsequent additions to the grains are equal in volume.
Common Mistakes
- Adding 1 cm³ to 99 cm³ (which is also correct, but the mark scheme prefers 10 + 90) — either is acceptable.
- Stating the final concentration but not the volumes used.
- Repeating the stock-solution preparation in this part — the question explicitly forbids it.
- Forgetting to mix between dilutions.
Things to Be Careful About
- Volumes must sum to 100 cm³ for each working solution.
- A separate, clean pipette (or rinsed one) should be used at each step to avoid carry-over contamination.
Identify the independent and the dependent variables in this investigation.
independent variable = ______
dependent variable = ______
Answer
independent variable = concentration of ABA
dependent variable = number of grains germinated (or length of shoot)
IV: concentration of ABA; DV: number of grains germinated (or length of shoot).
Background Concept
The independent variable (IV) is the one the experimenter deliberately changes; the dependent variable (DV) is what is measured to record the effect of that change. Anything else that could influence the result must be kept constant — these are the controlled variables. Confusing the IV with the DV is the single most common mistake in planning questions.
Understanding the Question
The student has soaked the grains in a fixed concentration of GA and is now adding different concentrations of ABA. The IV must therefore be the concentration of ABA. The DV is the response of the wheat grains — how many germinate, or alternatively how much the shoot grows. The mark scheme accepts either answer for the DV.
Approach
Read the stem carefully: the student varies the ABA concentration and observes germination (and, from part (c), shoots are also measured). The variable deliberately altered is the IV; the outcome measured is the DV.
Step-by-Step Reasoning
- The student makes several different ABA solutions (1 × 10⁻⁴, 1 × 10⁻⁵, 1 × 10⁻⁶ and 1 × 10⁻⁷ mol dm⁻³) and adds each to a different group of 50 grains.
- The variable deliberately changed from one group to the next is the concentration of ABA — so this is the IV.
- The variable measured at the end of the experiment — how many grains have germinated, or how long the shoots are — is the DV.
- Everything else (GA pre-soak time, GA concentration, temperature, light, time of measurement, number of grains per group) must be standardised as controlled variables.
Key Takeaways
- IV = what you change; DV = what you measure.
- The mark scheme accepts "number of grains germinated" OR "length of shoot" as the DV.
- All other conditions must be controlled to make a fair test.
Common Mistakes
- Saying "amount of ABA" rather than "concentration of ABA" — concentration is the precise scientific term.
- Confusing IV and DV — e.g. writing the number germinated as the IV.
- Adding "time" as the IV when the question is about different concentrations.
Things to Be Careful About
- "Concentration" must be used; "amount" is too vague.
- The independent variable is what is varied, not what is added (even though ABA is added).
Describe a procedure that the student could use to complete the investigation to find the effect of different concentrations of ABA on the germination of wheat grains.
Your method should be detailed enough for another person to use and should not repeat any details from (a)(ii) of how to dilute the stock solution.
Answer
- Set up a control group of 50 GA-soaked grains to which the same volume of distilled water is added (instead of ABA).
- Place each group of 50 grains on moist paper / soil in a separate, labelled container (Petri dish / beaker).
- Add the same stated volume (e.g. 20 cm³) of each ABA concentration to its container.
- Incubate all containers together in the dark, at a constant temperature between 10 °C and 25 °C (e.g. 20 °C in an incubator).
- After a fixed time (e.g. 7 days), count and record the number of grains that have germinated in each container.
- Safety: ABA is an irritant / allergen — wear gloves and a face mask (PPE) when handling it.
Five-stage controlled procedure with control, dark, constant temperature, same volume, fixed counting time, and PPE for ABA.
Background Concept
A valid experiment must include (i) a control that receives every treatment except the IV, (ii) standardisation of every other variable, (iii) replication so a mean can be calculated, (iv) a clear, quantitative measurement of the DV at a fixed time, and (v) appropriate safety. Each of these earns marks under the mark scheme's "quality of results" category.
The biology: ABA inhibits germination; without light and at the right temperature (10–25 °C), wheat germinates best. So the experiment must be conducted in the dark, at a controlled temperature within that range, and germination must be assessed after a known period.
Understanding the Question
You are asked to write a procedure (NOT including how to dilute the stock — that was part (a)(ii)) that another person could follow. Five marks are available from a list of seven creditable points in the mark scheme. Cover as many as you can; aim for at least five distinct, well-stated points.
Approach
Structure the procedure logically:
- Control
- Set-up of each group
- Standardisation of environmental variables (dark, temperature, volume)
- Measurement at a fixed time
- Safety
Step-by-Step Reasoning
- Control. Set up one extra group of 50 GA-soaked grains and add the same volume of distilled water instead of any ABA solution. This shows the effect of GA alone, against which ABA treatments can be compared.
- Substrate. Place the grains on moist filter paper, cotton wool or soil in a labelled container (e.g. Petri dish) — the substrate must support germination.
- Dark. Place all containers in the dark (e.g. in a cupboard or wrapped in black paper / foil) because wheat germinates best without light.
- Constant temperature. Use an incubator or a temperature-controlled room set to a constant value within 10–25 °C (e.g. 20 °C). This rules out temperature as a confounding factor.
- Equal volumes. Add the same stated volume (e.g. 20 cm³) of each ABA solution to each container so that any difference is due to concentration, not volume.
- Measurement at a fixed time. After a stated, identical time period (e.g. 7 days) for every group, count the number of grains that have germinated (those with an emerged shoot and root), or measure shoot length.
- Safety. ABA is an irritant / allergen. Hazard = ABA; risk = skin/eye irritation or allergic reaction; precaution = wear gloves and a face mask (PPE). Wheat grains themselves may also cause allergies — same PPE applies.
Key Takeaways
- A control is essential for a fair test.
- All variables other than the IV must be standardised.
- The DV must be measured quantitatively at a single, fixed time.
- Safety must state hazard + risk + precaution.
- Procedure should be written so that another person could replicate it without further instruction.
Common Mistakes
- Omitting the control.
- Failing to keep temperature constant or to specify a temperature within 10–25 °C.
- Saying "leave in a warm place" instead of naming a controlled temperature.
- Vague safety — "be careful" or "human error" scores nothing; you must name a hazard, a risk and a precaution.
- Forgetting to state a time for measurement.
Things to Be Careful About
- "Constant temperature" or "stated temperature" within the 10–25 °C window is required.
- The control is the GA-only group (no ABA), not "no GA".
- Use precise volumes (cm³) and times (days).
The student calculated the percentage germination of the grains in the different concentrations of ABA.
Answer
(number of germinated grains ÷ total number of grains) × 100.
Background Concept
Percentage germination standardises the count to a 0–100 scale, allowing fair comparison between groups that started with the same number of grains (here, 50 per group). It expresses the proportion that succeeded as a fraction of 100.
Understanding the Question
You are told the student divided the grains into groups of 50 and treated each with a different ABA concentration. You must state the formula used to convert the raw count of germinated grains into a percentage.
Approach
Use the universal percentage formula:
Apply it to germination: part = grains that germinated, whole = total grains in the group.
Step-by-Step Reasoning
- After the experiment, the student counts the grains in each group that have germinated (e.g. shoot and root emerged).
- The total per group is 50 (given in the stem).
- The percentage germination is therefore:
- This yields a value between 0 % and 100 % for each ABA concentration.
Key Takeaways
- Percentage = (part / whole) × 100.
- Standardising the starting number (here 50 per group) is what makes the comparison valid.
Common Mistakes
- Writing "divide by 50" without multiplying by 100.
- Using the wrong denominator (e.g. dividing by number germinated).
- Forgetting the ×100 step.
Things to Be Careful About
- Mark scheme requires the formula to be stated as "number germinated ÷ total × 100" — not just "mean of 50".
Complete Fig. 1.2 by sketching a graph to predict the results the student might expect. On the axes, show the range of values and the units that might be used to plot the graph.
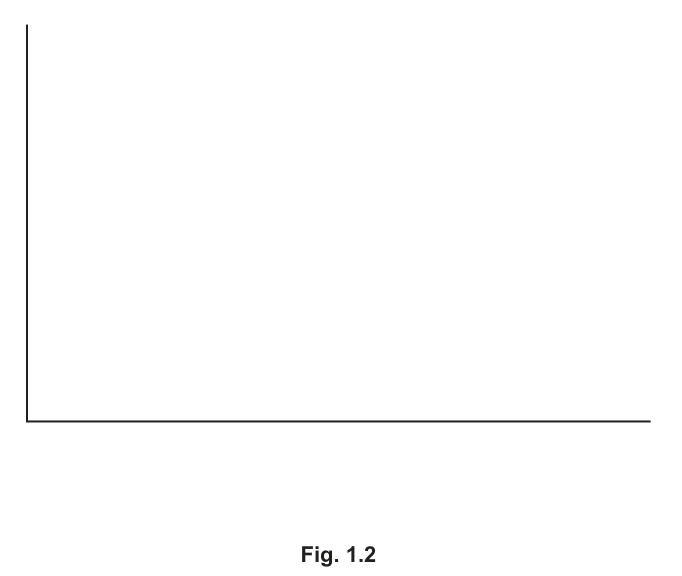
Answer
Axes:
- y-axis: percentage germination (scale 0 to 100)
- x-axis: concentration of ABA / mol dm⁻³ (values 1 × 10⁻⁷ to 1 × 10⁻³, marked at 1 × 10⁻⁷ and 1 × 10⁻³ or 1 × 10⁻⁴)
The line starts near 100 % at the lowest ABA concentration and decreases to near 0 % at the highest, because ABA inhibits germination and its effect is greater at higher concentrations.
Decreasing curve from ~100 % germination at low ABA concentration to ~0 % at high ABA concentration.
Background Concept
When asked to predict a graph, you must use information already given. Here the stem tells you ABA inhibits germination and that it is active in plant tissues between 1 × 10⁻⁶ and 1 × 10⁻⁴ mol dm⁻³, with the concentrations tested ranging from 1 × 10⁻⁷ to 1 × 10⁻⁴ mol dm⁻³. Therefore as the concentration of ABA rises, the percentage germination should fall — the highest concentrations prevent germination entirely, while very low concentrations (1 × 10⁻⁷) have negligible effect and germination is essentially 100 %.
Understanding the Question
You are asked to complete the blank axes of Fig. 1.2 by sketching the graph you would expect. Three marks: correctly oriented axes with labels and units (1), correct values on the x-axis (1), correct trend line (1).
Approach
- The IV (concentration of ABA) goes on the x-axis.
- The DV (percentage germination) goes on the y-axis, scaled 0–100.
- The x-axis values must match the range of ABA concentrations used in the experiment (1 × 10⁻⁷ to 1 × 10⁻⁴ mol dm⁻³), and the points can be marked at 1 × 10⁻⁷ and at 1 × 10⁻⁴ (or 1 × 10⁻³).
- The line must show percentage germination falling as ABA concentration rises.
Step-by-Step Reasoning
- y-axis: label "percentage germination" (no units — it is a %). Scale from 0 to 100.
- x-axis: label "concentration of ABA / mol dm⁻³". Mark 1 × 10⁻⁷ and (at least) 1 × 10⁻⁴ — these are the extreme concentrations the student actually tested.
- Sketch a smooth curve starting near 100 % at the lowest ABA concentration (1 × 10⁻⁷ mol dm⁻³ — well below the active range, so GA still promotes germination) and decreasing to near 0 % at the highest ABA concentration the student tested (1 × 10⁻⁴ mol dm⁻³ — within the active range, so germination is strongly inhibited).
- The curve should be concave-up (steeper fall at the higher end), reflecting the biological fact that inhibition increases with concentration up to a maximum.
Key Takeaways
- Always place the IV on the x-axis and the DV on the y-axis.
- Label each axis with both quantity AND unit.
- The predicted trend must be biologically justified — here, ABA inhibits germination, so high [ABA] means low germination.
Common Mistakes
- Swapping the axes (concentration on y, germination on x).
- Omitting units (especially mol dm⁻³).
- Drawing a straight line instead of a curve.
- Drawing the curve the wrong way (rising) because of confusion with GA.
- Marking x-axis values that do not match the actual concentrations used.
Things to Be Careful About
- The x-axis range must include the concentrations used in the experiment.
- The curve does not have to pass through specific numerical points — it is a sketch showing trend.
In another investigation the student tested the effect of gibberellin (GA) on the elongation of shoots. Five groups of 20 wheat grains were soaked in GA solution. Each group was treated with a different concentration of GA and then left to germinate and grow for 10 days. The length of each shoot was measured and a mean shoot length was calculated for each GA concentration.
Table 1.1 shows the results of this investigation.
Table 1.1
| concentration of GA / | 0 | ||||
|---|---|---|---|---|---|
| mean shoot length / |
Explain what standard error (SE) shows about the reliability of the results in Table 1.1.
Answer
A smaller standard error (SE) indicates that the calculated sample mean is more reliable, because it is closer to the true population mean.
Example from Table 1.1: the SE for 1 × 10⁻⁷ mol dm⁻³ GA is ±5 mm and the SE for 1 × 10⁻⁶ mol dm⁻³ GA is ±15 mm — these do not overlap, so the difference between these two means may be statistically significant.
Smaller SE = more reliable mean, closer to the true mean; non-overlapping SEs suggest a significant difference.
Background Concept
The standard error of the mean (SEM) estimates how far the sample mean is likely to lie from the true population mean. It is calculated from the standard deviation divided by √n. A small SE means the sample mean is a precise estimate; a large SE means it could be quite far from the true value. Means with non-overlapping SEs are likely to be significantly different; means whose SEs overlap substantially are unlikely to be so.
Understanding the Question
You are given Table 1.1 with five mean shoot lengths, each ± a standard error. You must explain what the SE tells you about the reliability of the means, ideally with reference to actual values in the table.
Approach
State the general principle (smaller SE = more reliable mean), then give a worked example from the table (e.g. compare the SEs of two concentrations and comment on overlap / non-overlap).
Step-by-Step Reasoning
- The SE is a measure of how precisely the sample mean estimates the true mean of the population.
- A smaller SE means that the mean is more reliable — repeated samples would give similar values.
- Equivalently, a smaller SE implies the sample mean is closer to the true population mean.
- From Table 1.1, the smallest SE is ±5 mm (at 1 × 10⁻⁷ mol dm⁻³), so that mean (150 mm) is the most reliable.
- Comparing 1 × 10⁻⁷ mol dm⁻³ (150 ± 5 mm) and 1 × 10⁻⁶ mol dm⁻³ (175 ± 15 mm): the SEs do not overlap (150 ± 5 = 145–155; 175 ± 15 = 160–190), so the difference between these two means is likely to be statistically significant.
- Conversely, 1 × 10⁻⁶ mol dm⁻³ (175 ± 15 mm) and 1 × 10⁻⁴ mol dm⁻³ (180 ± 8 mm) have SEs that overlap (175 ± 15 = 160–190; 180 ± 8 = 172–188), so those means are unlikely to differ significantly.
Key Takeaways
- SE indicates precision of the mean estimate; the smaller, the more reliable.
- Non-overlapping SEs are a useful (though not strict) indication of a significant difference.
- Always quote specific values from the table to support your interpretation.
Common Mistakes
- Defining SE without relating it to the mean's reliability.
- Failing to quote values from Table 1.1.
- Confusing standard error with standard deviation (SD measures spread of individuals; SE measures precision of the mean).
Things to Be Careful About
- The mark scheme requires both the principle AND a numerical example.
- Do not overstate: SE overlap is suggestive but the proper test is the t-test (part d iii).
The student carried out a number of -tests.
In each -test, the student compared the mean shoot length of the seedlings grown from grains that were not treated with GA with those that were treated with GA.
Suggest a null hypothesis for the -test between no GA treatment and those treated with GA.
Answer
There is no (significant) difference between the mean shoot length of seedlings grown from wheat grains with no GA treatment and the mean shoot length of seedlings grown from wheat grains treated with 1 × 10⁻⁵ mol dm⁻³ GA.
No (significant) difference between the mean shoot lengths of the no-GA group and the 1 × 10⁻⁵ mol dm⁻³ GA group.
Background Concept
A null hypothesis (H₀) is a statement of "no effect" or "no difference" between the groups being compared. It is what a statistical test either rejects or fails to reject. For a t-test comparing two means, the null hypothesis is that the two population means are equal. The alternative hypothesis (H₁) is the converse, that there IS a difference.
Understanding the Question
You are told the student ran a t-test comparing the no-GA group with the 1 × 10⁻⁵ mol dm⁻³ GA group. From Table 1.1 the means are 120 mm (no GA) and 210 mm (1 × 10⁻⁵ mol dm⁻³). You must state the null hypothesis for this comparison.
Approach
A null hypothesis always specifies:
- The two groups being compared
- The variable measured
- A statement that there is NO difference between them.
Step-by-Step Reasoning
- The two groups are: (a) wheat grains with no GA treatment, and (b) wheat grains treated with 1 × 10⁻⁵ mol dm⁻³ GA.
- The variable measured is the mean shoot length.
- Therefore the null hypothesis is: there is no significant difference between the mean shoot length of these two groups.
- The wording must include both groups and the variable; do not simply say "GA has no effect".
Key Takeaways
- Null hypothesis = statement of no difference.
- It must mention both groups and the variable being compared.
- It is what the t-test either rejects (significant difference) or fails to reject (no significant difference).
Common Mistakes
- Phrasing it as a question ("is there a difference ...?") — a hypothesis is a statement.
- Omitting one of the two groups.
- Saying "no difference" without saying "no significant difference" (though "no difference" alone is usually accepted by CIE).
Things to Be Careful About
- The mark scheme requires the wording to mention both treatments and the shoot length.
Explain how the student should use the values for to determine if there is a significant difference between the mean shoot length of wheat grown with no GA treatment and the mean shoot length of wheat grown with GA treatment.
Answer
- The degrees of freedom for the t-test are
- The calculated t-value is compared with the critical t-value at p = 0.05 for 38 df (≈ 2.024, from a statistical table).
- If the calculated t-value is greater than the critical value, reject the null hypothesis and conclude there is a significant difference between the two mean shoot lengths. If it is lower, accept (or fail to reject) the null hypothesis and conclude there is no significant difference.
Use df = 38; compare calculated t with critical value at p = 0.05; reject H₀ if calculated t exceeds the critical value.
Background Concept
The t-test assesses whether the difference between two sample means is statistically significant. The result is a calculated t-value; this is compared against a critical value (looked up in a t-table) at a chosen probability (p = 0.05 is conventional) and the appropriate degrees of freedom.
Degrees of freedom for a two-sample (unpaired) t-test:
where n₁ and n₂ are the sample sizes of the two groups. The critical value decreases as df increases.
The decision rule:
- If |calculated t| > critical t → reject H₀ (significant difference).
- If |calculated t| ≤ critical t → accept H₀ (no significant difference).
Understanding the Question
Each group of wheat grains contained 20 grains (n = 20), so each t-test comparison has df = 20 + 20 − 2 = 38. You must explain the three steps to determine whether the difference is significant.
Approach
Lay out the procedure in order:
- Calculate df from sample sizes.
- Look up the critical t-value at p = 0.05 for that df.
- Compare the calculated t with the critical t and state the decision.
Step-by-Step Reasoning
- Sample sizes: each group has 20 wheat grains, so n₁ = 20 and n₂ = 20.
- Degrees of freedom:
- From a t-table, the critical value at p = 0.05 and df = 38 is approximately 2.024 (one-tailed) or 2.024 for a two-tailed test (the mark scheme accepts either orientation).
- The student calculates a t-value for the two groups from their means and SEs.
- If the calculated t-value exceeds 2.024, the difference is significant at the 5 % level — reject the null hypothesis.
- If the calculated t-value is less than or equal to 2.024, accept (fail to reject) the null hypothesis — no significant difference.
In this investigation, the means are very different (120 vs 210 mm at the peak), so the calculated t is large and H₀ is rejected — confirming that GA significantly increases shoot length at 1 × 10⁻⁵ mol dm⁻³.
Key Takeaways
- df = n₁ + n₂ − 2 for an unpaired two-sample t-test.
- Compare calculated t with the critical value at p = 0.05 for that df.
- Reject H₀ if calculated t > critical t; otherwise accept it.
Common Mistakes
- Using the wrong df formula (e.g. n₁ × n₂ or n₁ + n₂).
- Comparing the calculated t with a critical value at the wrong probability (e.g. p = 0.01).
- Stating "accept" rather than "fail to reject" — both are accepted by CIE, but be clear about the logic.
Things to Be Careful About
- The mark scheme requires three linked points: df, comparison with critical value at p = 0.05, and the reject/accept decision.
- Critical value depends on df; do not quote a single fixed number like 1.96 unless df is appropriate.
A student investigated the oxygen consumption of isolated mitochondria under different conditions.
Mitochondria were isolated by crushing liver cells in ice cold buffer and filtering to remove cell debris. The filtrate was centrifuged to separate the mitochondria. The mitochondria were suspended in ice cold buffer.
State one reason for keeping the mitochondria in cold buffer solution during isolation.
Answer
The cold buffer prevents the (mitochondrial) enzymes / proteins from denaturing;
or
the cold temperature prevents damage to the mitochondria by enzymes released from broken cells;
or
the buffer prevents (osmotic) lysis of the mitochondria.
Cold buffer prevents the enzymes/proteins from denaturing.
Background Concept
When cells are disrupted to isolate organelles such as mitochondria, the contents of other compartments (especially lysosomes) are released into the homogenate. Lysosomes contain hydrolytic enzymes (proteases, lipases, nucleases) that work optimally at body temperature. Mitochondrial enzymes of the Krebs cycle and oxidative phosphorylation are themselves proteins that lose tertiary structure and active-site shape if conditions become too warm or if the osmotic environment is unfavourable. Mitochondria are bounded by a double membrane; if the surrounding solution is too hypotonic, water enters by osmosis, the matrix swells and the outer membrane ruptures — osmotic lysis.
Understanding the Question
The stem tells us mitochondria were 'isolated by crushing liver cells in ice cold buffer and filtering to remove cell debris.' Part (a) asks for one specific reason why the cold buffer is essential. The question is a 'state' question — one credit, one reason.
Approach
Identify the most direct threat to a freshly-isolated mitochondrion in a cell homogenate, then pick the mark-scheme line that describes it. Either enzymatic self-digestion by released lysosomal enzymes, denaturation of the mitochondrial enzymes themselves by warming, or osmotic lysis by an unbalanced buffer are all creditable.
Step-by-Step Reasoning
A cell homogenate contains lysosomal hydrolases at body temperature, which would digest the freshly isolated mitochondria if given the chance. Keeping the suspension close to 0 °C greatly slows enzyme activity (rate roughly halves per 10 °C fall, so very few lysosomal reactions occur). Low temperature also slows general denaturation kinetics. At the same time, an isotonic 'buffer' matches the cytoplasmic ionic strength so water does not move into the matrix down the water-potential gradient and rupture the outer membrane. Any one of these three lines is enough for the single mark.
Key Takeaways
Cold, isotonic buffer protects both the structural integrity of organelles (against osmotic lysis) and the functional integrity of their enzymes (against denaturation and digestion by released lysosomal enzymes).
Common Mistakes
Stating only 'to keep them cold' without specifying what cold prevents; or stating 'so they don't dry out' or 'to make them respiring faster' — both rejected by the mark scheme.
Things to Be Careful About
A CIE mark scheme usually offers several alternative creditable reasons for this question. Any one is sufficient for the single mark, but the phrasing must link 'cold' or 'buffer' to a specific biological consequence (denaturation, lysosomal damage or osmotic lysis).
Fig. 2.1 shows the apparatus used to measure the oxygen consumption of the isolated mitochondria.
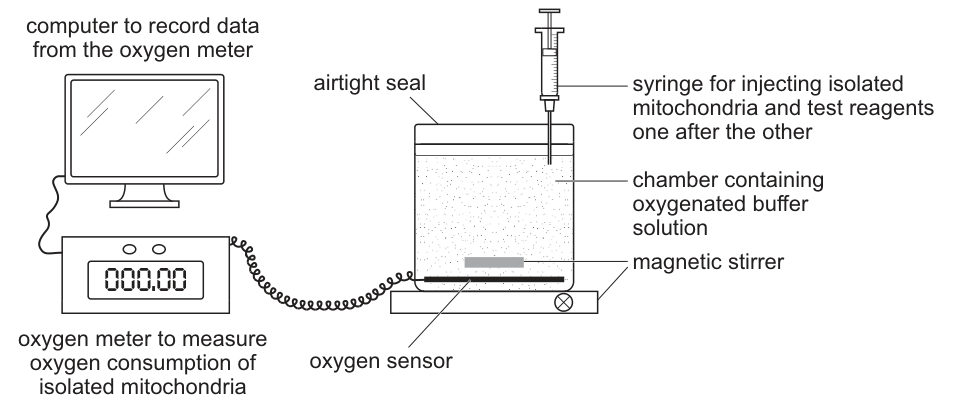
The apparatus was used as follows.
- The apparatus was set up as shown in Fig. 2.1 and left for 1 minute to equilibrate.
- At 1 minute, a standard volume of mitochondria in buffer solution was injected through the seal.
- At 2 minutes, a solution of succinate, a Krebs cycle intermediate, was injected through the seal.
- At 5 minutes, a solution of ADP was injected through the seal.
- At 6 minutes, a solution of cyanide was injected through the seal.
During this procedure the oxygen concentration in the chamber was measured continuously and displayed as a trace on the computer screen as shown in Fig. 2.2.
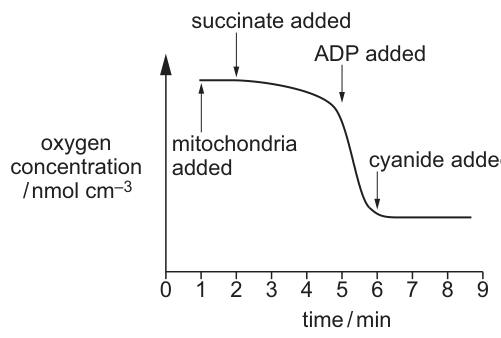
Using the figures from the trace, the computer calculated the rate of oxygen consumption following each addition. This procedure was repeated three more times using fresh samples of mitochondria.
Table 2.1 shows the rates of oxygen consumption for each of the four trials.
Table 2.1
| rate of oxygen consumption / | |||||
|---|---|---|---|---|---|
| trial 1 | trial 2 | trial 3 | trial 4 | mean | |
| mitochondria alone | 0.03 | 0.02 | 0.03 | 0.01 | 0.02 |
| mitochondria with succinate | 50.22 | 49.10 | 48.53 | 50.15 | |
| mitochondria with ADP and succinate | 139.23 | 170.10 | 142.67 | 138.10 | 147.53 |
| mitochondria with cyanide, ADP and succinate | 0.00 | 0.10 | 0.00 | 0.01 | 0.03 |
Calculate the mean rate of oxygen consumption for mitochondria with succinate.
Write your answer in Table 2.1.
Working
Answer
49.50
49.50 nmol min⁻¹
Background Concept
The arithmetic mean summarises a set of repeated measurements. For measurements , . Quoting the mean with the same units and decimal places as the original readings keeps the table consistent and shows the reader the precision of the data.
Understanding the Question
The four trial values for 'mitochondria with succinate' are 50.22, 49.10, 48.53 and 50.15 (all in ). The mean cell in Table 2.1 is blank and needs filling.
Approach
Add the four values and divide by 4. Give the answer to two decimal places to match the precision of the data.
Step-by-Step Reasoning
; ; . Dividing by 4: . Units as given in the column heading.
Key Takeaways
A mean must be quoted with the units of the original quantity and (here) to 2 d.p. to match the data. A quick reasonableness check: the four values cluster at 49–50, so a mean just under 50 is sensible.
Common Mistakes
Forgetting the unit, rounding incorrectly (e.g. to one significant figure), or dividing by the wrong number of trials.
Things to Be Careful About
Use the exact figures from the table; do not introduce rounding errors at the intermediate step.
On Table 2.1 indicate, by placing a circle around each value, two results that may be anomalous.
Answer
Circle 170.10 in the 'mitochondria with ADP and succinate' row (trial 2) and 0.10 in the 'mitochondria with cyanide, ADP and succinate' row (trial 2). These two values lie far from the other three trials in their rows and are the likely anomalies.
170.10 (ADP + succinate row) and 0.10 (cyanide + ADP + succinate row)
Background Concept
An 'anomalous' result is a reading that does not fit the pattern shown by the other replicates — it lies well outside the cluster formed by the other trials. With only four trials, judgement is made from how far a single value deviates from the cluster.
Understanding the Question
Each row of Table 2.1 has four trial values and a mean. Candidates must circle two values that look anomalous (one mark each).
Approach
Look at each row separately and ask which value lies furthest from the cluster of the other three.
Step-by-Step Reasoning
Row 1 (mitochondria alone): 0.03, 0.02, 0.03, 0.01 — all close to 0.02; no clear anomaly.
Row 2 (with succinate): 50.22, 49.10, 48.53, 50.15 — all lie between 48.5 and 50.2; no clear anomaly.
Row 3 (with ADP and succinate): 139.23, 170.10, 142.67, 138.10 — three values cluster at ~139–143 while trial 2 (170.10) sits ~30 units above them. 170.10 is anomalous.
Row 4 (with cyanide, ADP and succinate): 0.00, 0.10, 0.00, 0.01 — three values are essentially 0, while trial 2 (0.10) is an order of magnitude higher. 0.10 is anomalous.
Both anomalies happen to come from trial 2, suggesting a procedural issue specific to that run (e.g. a leaky seal, incomplete cyanide addition, or contamination with an oxidisable substrate).
Key Takeaways
Identifying anomalies is a judgement based on the spread of replicates; in this paper the marks go to the candidate's reasoning, not to a strict statistical test.
Common Mistakes
Circling a value in the 'mitochondria alone' row (those values are all very small and within noise) or circling two values in the same row (only one per row is anomalous).
Things to Be Careful About
CIE normally wants the two values to come from different rows so the candidate has actually inspected every row. One mark per correct circle.
State two ways that the student could have processed the results to allow for these possible anomalies.
Answer
- Exclude the anomalies and recalculate (a more accurate) mean from the remaining values.
- Calculate the standard deviation, standard error or 95% confidence limits for each condition to quantify the spread of the data.
Exclude anomalies and recalculate the mean; calculate standard deviation / standard error / 95% confidence limits.
Background Concept
A single mean hides the spread of the underlying data. Two refinements standard in CIE Paper 5 are:
• Excluding anomalies before re-computing the mean, on the grounds that one rogue value can pull the mean well away from the bulk of the readings.
• Reporting the dispersion — standard deviation (sd), standard error of the mean (), or a 95% confidence interval (mean 2 SEM) — so a reader can see whether replicates agree.
Understanding the Question
Part (ii) identified 170.10 and 0.10 as probable anomalies. The question asks for two processing steps that handle these without throwing away all the data.
Approach
One approach acts on the anomalies directly; the other describes the data around them.
Step-by-Step Reasoning
Approach 1 — exclude and re-average. Removing the two circled values and re-averaging the remaining three trials in each row gives a 'cleaner' mean that is not pulled by the rogue reading.
Approach 2 — quantify the spread. Computing a standard deviation (or standard error, or 95% confidence limits) for each row gives a numerical measure of the spread and an indication of which rows are reproducible and which are not. These statistics are valid whether or not the anomalies are kept.
Key Takeaways
Discarding a possible anomaly is not the same as discarding all the data; statistical description of the spread is the complementary habit.
Common Mistakes
Saying 'repeat the experiment' or 'take more readings' — these are improvements to the method, not processing steps applied to the data already collected. Saying 'calculate a percentage error' — not on the mark scheme here.
Things to Be Careful About
The two marks must be distinct, processing-based responses. CIE wording matters: 'standard deviation', 'standard error' and '95% confidence limits' are individually credit-worthy; pairing them in one answer only counts once.
Answer
- With mitochondria alone the oxygen concentration barely changes: there is no respiratory substrate, so the Krebs cycle cannot run and oxidative phosphorylation is essentially absent.
- Adding succinate supplies a substrate for the Krebs cycle, so the rate of (aerobic) respiration / oxidative phosphorylation rises and oxygen uptake increases.
- Adding ADP (with succinate) gives a still larger rise: ADP is the substrate for ATP synthase, so oxidative phosphorylation is now fully active and electrons flow rapidly down the electron transport chain, with O₂ acting as the final electron acceptor.
- Adding cyanide blocks the electron transport chain (cytochrome oxidase), so electron flow and oxygen consumption both stop and the trace becomes flat.
No substrate → almost no O₂ uptake; succinate feeds the Krebs cycle so uptake rises; adding ADP drives oxidative phosphorylation so uptake rises further; cyanide blocks the electron transport chain so uptake stops.
Background Concept
Mitochondria carry out the Krebs cycle in the matrix and oxidative phosphorylation on the inner membrane. The Krebs cycle oxidises acetyl-CoA (derived from pyruvate, fatty acids or intermediates such as succinate) and reduces NAD⁺ and FAD to NADH and FADH₂. These carriers donate electrons to the electron transport chain (ETC) on the inner mitochondrial membrane; the chain passes electrons through complexes I–IV, with O₂ as the final electron acceptor at complex IV (cytochrome oxidase). The energy released pumps protons, creating a proton-motive force that drives ATP synthase. ATP synthase requires ADP + Pi to make ATP; without ADP the gradient builds up and electron flow is throttled (respiratory control). Cyanide binds the Fe of cytochrome oxidase and stops electron flow — O₂ is no longer consumed.
Understanding the Question
The trace in Fig. 2.2 shows four phases of oxygen concentration after sequential additions of (1) mitochondria, (2) succinate, (3) ADP and (4) cyanide. Table 2.1 quantifies the rate in each phase. The question wants a biochemical explanation that links each phase to the underlying enzymic events.
Approach
Take each phase of the experiment in turn and explain what is being supplied or removed and how that changes the rate of electron flow, hence oxygen consumption. Use the standard terminology: 'substrate for the Krebs cycle', 'final electron acceptor', 'oxidative phosphorylation'.
Step-by-Step Reasoning
Phase 1 — mitochondria alone. The isolated mitochondria have no added substrate, so the dehydrogenases of the Krebs cycle have nothing to oxidise and the ETC has no donors. Oxygen consumption is essentially zero (Table 2.1: mean 0.02 nmol min⁻¹).
Phase 2 — succinate added. Succinate is a Krebs-cycle intermediate; it feeds complex II. It is oxidised to fumarate, generating FADH₂, which feeds electrons into the ETC. Electrons flow to O₂, so oxygen uptake begins (mean 49.50 nmol min⁻¹). Without added ADP, however, the proton gradient can build up and partially throttle the chain, so the rate is moderate rather than maximal.
Phase 3 — succinate + ADP. ADP is the substrate for ATP synthase. Adding ADP removes the throttle: protons flow back through ATP synthase, the gradient is dissipated and electron flow accelerates. O₂ consumption rises sharply (mean 147.53 nmol min⁻¹ — the steepest part of the Fig. 2.2 trace). This is the 'state 3' rate of Chance and Williams.
Phase 4 — cyanide added. Cyanide binds cytochrome c oxidase (complex IV), the terminal oxidase. Electron flow is blocked at the end of the chain; even though substrate and ADP are present, electrons cannot reach O₂ and oxygen consumption drops to ~0 (mean 0.03 nmol min⁻¹). The trace flattens, confirming that the previous oxygen uptake was due to mitochondrial electron transport and not, for example, to a non-specific chemical reaction with succinate.
Key Takeaways
Mitochondrial respiration needs three things to run at full speed: a substrate to supply electrons (succinate), an electron acceptor (O₂), and a way to dissipate the proton gradient (ADP → ATP). Removing any one of these — substrate, ADP or O₂ — or blocking the chain with cyanide slows or stops oxygen uptake.
Common Mistakes
Stating that 'cyanide kills the mitochondria' — it does not kill them; it specifically inhibits cytochrome oxidase. Stating that 'succinate is the final electron acceptor' — succinate is the substrate; O₂ is the final electron acceptor. Confusing ADP with ATP in oxidative phosphorylation — ATP synthase uses ADP + Pi, not ATP.
Things to Be Careful About
'State 3 respiration' (ADP-stimulated) versus 'state 4' (ADP-limited) is exactly what the experiment displays. The mark-scheme wording 'oxygen acts as the final electron acceptor' must appear in any complete explanation of why oxygen is consumed at all. Each of the four phases of the trace corresponds to a single, named biochemical event.