Biology 9700/53 — May/June 2025
Cambridge A-Level · Planning, Analysis and Evaluation · worked solutions for every part, with the mark scheme
Topics Planning · Analysis, Conclusions and Evaluation
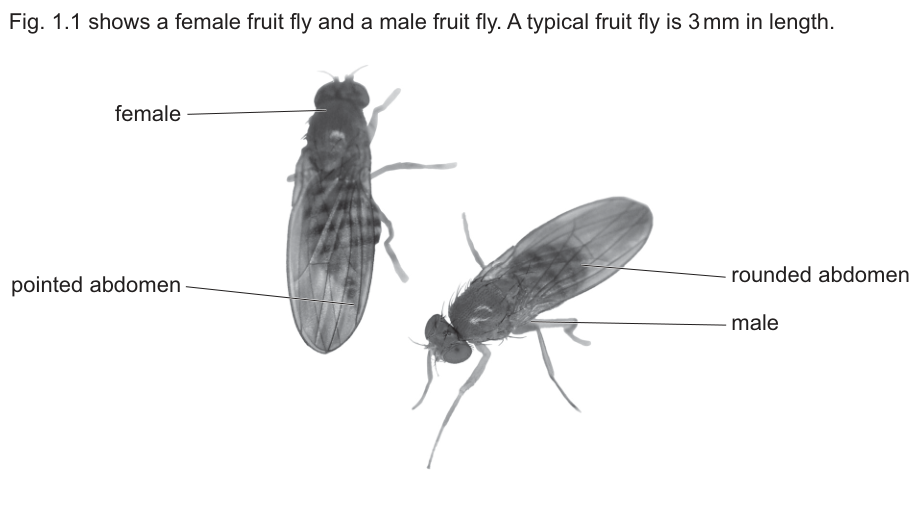
Drosophila melanogaster is a species of fruit fly.
Fig. 1.1 shows a female fruit fly and a male fruit fly. A typical fruit fly is in length.
Scientists have studied the inheritance patterns of many genetic traits in fruit flies.
To carry out genetic crosses with fruit flies:
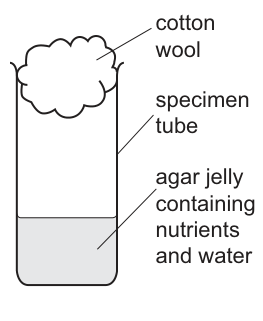
- a specimen tube is prepared with food for the fruit flies, as shown in Fig. 1.2
- adult male and female fruit flies are added to the specimen tube to allow mating to take place
- the specimen tube is kept in warm conditions for several days
- the eggs laid by female fruit flies develop into pupae
- adults are removed from the specimen tube before pupae mature into adult fruit flies
- offspring emerge as adult flies 10-15 days after eggs are laid.
One of the genetic traits studied in fruit flies is eye colour. The normal (wild type) eye colour of D. melanogaster is red.
Eye colour in D. melanogaster is controlled by several genes, including two genes that are located on separate chromosomes, A/a and D/d.
- Allele A is dominant to allele a.
- Allele D is dominant to allele d.
Table 1.1 summarises eye colour in D. melanogaster for these two genes.
Table 1.1
| eye colour phenotype | genotypes |
|---|---|
| red | AADD, AaDD, AaDd, AADd |
| brown | AAdd, Aadd |
| scarlet (bright red) | aaDD, aaDd |
| white | aadd |
A student was provided with two populations of fruit fly:
- brown-eyed fruit flies with genotype AAdd
- scarlet-eyed fruit flies with genotype aaDD.
In each population, males and females were provided in separate specimen tubes.
The student decided to carry out two genetic crosses.
The first cross used fruit flies from the initial populations to produce offspring that are heterozygous for each of the two genes (double heterozygotes).
The second cross used the double heterozygotes produced from the first cross.
To carry out the genetic crosses, the student was provided with standard laboratory equipment and:
- specimen tubes containing food
- a chemical to anaesthetise the flies – this chemical, when given at a particular dose, makes the flies immobile for more than 30 minutes
- small brushes for sorting immobile flies without harming them.
Identify a hazard in this investigation and state a risk associated with the hazard and state one precaution that the student should take.
Answer
The anaesthetic is a hazardous chemical; the risk is that it is toxic/irritant if inhaled or if it contacts skin or eyes; the precaution is to wear gloves (and goggles/mask) and use the anaesthetic inside a fume cupboard.
Hazard: the anaesthetic; risk: toxic/irritant; precaution: wear gloves/PPE and use a fume cupboard.
Background Concept
In any practical biological investigation the student must distinguish between a hazard (something with the potential to cause harm), a risk (the likelihood and severity of that harm occurring), and a precaution (a control measure that reduces the risk). All three must be stated together for credit. Common categories in school/university labs include chemicals (toxic, irritant, flammable, corrosive), biological agents (allergens, pathogens, live organisms) and physical hazards (sharp objects, broken glass, electricity).
Understanding the Question
This part asks for one complete triple drawn from the investigation described in the question. The investigation uses an anaesthetic chemical, live Drosophila fruit flies, and agar-jelly food — any one of these can form the basis of a valid answer. The mark is awarded only if hazard, risk and precaution are all present and clearly linked.
Approach
Pick one hazard (the example below uses the anaesthetic). State the hazard, state the harm it could cause (the risk), then state a specific, practical control measure. Tie all three together so the link is obvious.
Step-by-Step Reasoning
- Hazard — the anaesthetic used to immobilise the flies. It is a volatile chemical.
- Risk — it is toxic/irritant if inhaled or if it contacts skin or eyes; some people may also be allergic to it.
- Precaution — wear gloves (and goggles/mask as PPE) and use the anaesthetic inside a fume cupboard so that the vapour is not breathed in.
The mark scheme accepts any one of three triples (anaesthetic chemical / Drosophila / agar jelly), each with its own risk and PPE-based precaution; the answer above illustrates the chemical triple.
Key Takeaways
- A hazard is the source of potential harm; a risk is how likely that harm is and how serious; a precaution is a control measure.
- For full credit, all three elements must be stated and clearly connected.
- Personal protective equipment (PPE) — gloves, goggles, masks — is the standard precaution for chemical, biological and food-related hazards.
Common Mistakes
- Stating only the hazard or only the precaution without linking it to a specific risk.
- Vague precautions such as 'be careful' — these do not earn credit because they do not name a specific control.
- Confusing hazard with risk (e.g. 'the chemical is dangerous' — 'dangerous' is the hazard, not the risk).
Things to Be Careful About
- The hazard must come from THIS investigation — it must be something actually used (the anaesthetic, the flies, or the food).
- Risk and precaution must match the hazard — do not mix them up.
- 'Use a fume cupboard' is more specific than 'be careful in a well-ventilated area' and is preferred.
Describe a method the student could use to carry out:
- the first cross using fruit flies from the initial two populations to produce double heterozygotes (genotype AaDd)
- the second cross using the double heterozygotes produced from the first cross
- an analysis of the offspring phenotype ratio from the second cross.
The description of your method should be set out in a logical way and be detailed enough for another person to follow.
The method should include a description of how offspring phenotypes would be identified.
Answer
First cross (P × P → F1 double heterozygotes):
- Select several brown-eyed females (AAdd) and several scarlet-eyed males (aaDD) from the initial populations.
- Anaesthetise the flies using the stated/recommended dose of the anaesthetic and transfer them with a small brush into a fresh specimen tube containing food (agar jelly); seal with cotton wool.
- Keep the tube at a constant warm temperature (e.g. 25 °C) and allow mating and egg-laying.
- After several days, but before day 10 (before pupae mature into adults), anaesthetise and remove all adult parents so they do not mate with their own offspring.
- Wait 10–15 days for F1 adults to emerge; they should all be red-eyed (AaDd) — confirm under a hand lens.
Second cross (F1 × F1 → F2):
- Anaesthetise the F1 adults using the same stated dose of anaesthetic and sort them with a brush.
- Confirm each fly is red-eyed using a microscope, hand lens or magnifying glass.
- Place several male and several female AaDd flies into a new specimen tube with food; seal with cotton wool. Use enough flies to obtain a large number of F2 offspring.
- Maintain at the same constant temperature.
- Remove the adults before pupae mature (before day 10).
- Wait 10–15 days for F2 adults to emerge.
Analysis of the offspring phenotype ratio:
- Anaesthetise the F2 adults in batches using the standard dose of anaesthetic.
- Identify each fly's eye colour under a hand lens / microscope — red, brown, scarlet or white.
- Record the number of flies of each phenotype in a tally table / with a tally counter.
- Prevent double counting — for example, place each fly into a separate empty tube after it has been counted, then dispose of it. Continue until every F2 fly has been examined and recorded once only.
First cross: AAdd × aaDD → AaDd. Remove parents before day 10; verify F1 are red-eyed. Second cross: AaDd × AaDd → F2; maintain constant temperature; anaesthetise with the stated dose; identify eye colour under magnification; count each phenotype once into a tally table; prevent double counting by removing counted flies to a separate tube.
Background Concept
A genetic cross between two homozygous parents differing at two loci (here AAdd × aaDD) gives F1 offspring that are all heterozygous at both loci (AaDd) — these are the double heterozygotes. Crossing two double heterozygotes (AaDd × AaDd) is the classic dihybrid cross, which gives a 9 : 3 : 3 : 1 phenotypic ratio when the two genes assort independently. To perform the crosses reliably in Drosophila, students must control temperature, prevent the parental generation from mating with the offspring, anaesthetise the flies safely for sorting, and identify the eye-colour phenotype of each fly.
Understanding the Question
This part asks for a method in three sections:
- The first cross — AAdd (brown-eyed) × aaDD (scarlet-eyed) to obtain AaDd F1.
- The second cross — AaDd × AaDd, using the F1 from the first cross, to obtain F2.
- Analysis of the F2 phenotype ratio — how each phenotype would be identified and counted.
The description must be detailed enough for another person to follow; it must include how phenotypes are identified; it should mention the controls that make the experiment reliable (temperature, dose of anaesthetic, removal of parents, prevention of double counting).
Approach
Work through each cross sequentially — first cross produces AaDd, second cross produces F2, then analyse F2. For each step, list the apparatus and chemicals, the procedure, and the controls that ensure reliability.
Step-by-Step Reasoning
First cross (P × P → AaDd):
- Select several brown-eyed females (AAdd) and several scarlet-eyed males (aaDD) from the initial populations (or vice versa).
- Anaesthetise them briefly with the stated/recommended dose of anaesthetic and transfer them with a small brush into a fresh specimen tube containing food (agar jelly); seal with cotton wool.
- Place the tube at a constant warm temperature (e.g. 25 °C) and allow mating and egg-laying.
- After a few days, but before day 10 (before pupae mature into adults), anaesthetise and remove all parental adults so they do not mate with their own offspring.
- Wait 10–15 days for the F1 adults to emerge; they should all be red-eyed (AaDd) — verify under a hand lens.
Second cross (AaDd × AaDd):
6. Anaesthetise the F1 adults using the same stated dose of anaesthetic; sort them with a brush.
7. Confirm each fly's eye colour is red using a microscope, hand lens or magnifying glass.
8. Place several male and several female AaDd flies into a new specimen tube with food; seal with cotton wool. Use enough flies to obtain a large number of F2 offspring.
9. Maintain at the same constant temperature.
10. Remove the adults before pupae mature (before day 10).
11. Wait 10–15 days for F2 adults to emerge.
Analysis of F2 offspring:
12. Anaesthetise F2 adults in batches using the standard dose of anaesthetic.
13. Identify each fly's eye colour under a hand lens / microscope — red, brown, scarlet or white.
14. Record the number of flies of each phenotype in a tally table / with a tally counter.
15. Prevent double counting — for example, place each fly into a separate empty tube after it has been counted, then dispose of it. Continue until every F2 fly has been examined and recorded exactly once.
Key Takeaways
- A reliable Drosophila genetic cross needs four explicit controls: constant temperature, the correct stated dose of anaesthetic, removal of parents before the next generation emerges, and a method to prevent double counting.
- Double heterozygotes produced from two different homozygous parents are all genetically identical at the two loci, so the second cross is a true dihybrid cross.
- Phenotype identification must be done under magnification, because the four eye colours (red, brown, scarlet, white) are most reliably distinguished with a hand lens.
Common Mistakes
- Forgetting to remove the parents — they will then mate with their offspring and ruin the F1 or F2 generation.
- Not specifying the dose of anaesthetic — too high a dose kills the flies; too low immobilises them only briefly.
- Saying 'use a microscope' without saying what for — credit requires that the microscope is used to identify eye colour.
- Counting flies while they are still moving — leads to missing or double-counting.
- Using only one male and one female per cross — too few offspring; always use several of each.
Things to Be Careful About
- Remove parents before pupae mature, i.e. before day 10 from egg laying, to prevent adults emerging and mating with their siblings.
- Use several flies of each sex in each cross, not just one pair, so a single failure (e.g. one fly dies) does not end the cross.
- The two genes A/a and D/d are on separate chromosomes, so they assort independently — this is what gives the 9 : 3 : 3 : 1 ratio in F2.
- Identification must distinguish all four phenotypes, not just 'red' and 'not red'.
Predict the ratio of offspring phenotypes from the cross between parents that are heterozygous for the two genes (AaDd).
You may use this space for any working.
ratio = ______
phenotypes = ______
Working
Dihybrid cross: AaDd × AaDd.
Each parent produces four gametes in equal proportions (¼ each): AD, Ad, aD, ad.
A 4 × 4 Punnett square gives 16 equally likely offspring genotypes. Grouping by phenotype using Table 1.1:
- 9/16 carry at least one A and at least one D → red (A_D_)
- 3/16 carry at least one A but are dd → brown (A_dd)
- 3/16 are aa but carry at least one D → scarlet (aaD_)
- 1/16 is aadd → white
Answer
ratio = 9 : 3 : 3 : 1
phenotypes = red : brown : scarlet : white
9 : 3 : 3 : 1 (red : brown : scarlet : white)
Background Concept
A dihybrid cross is a cross between individuals that are heterozygous at two loci, each on a different chromosome. Because the chromosomes assort independently at meiosis I, the four gametes produced by an AaDd individual — AD, Ad, aD, ad — are formed in equal numbers (¼ each). A Punnett square therefore has 16 boxes, each equally likely. Combining the genotypes according to the dominance rules (A dominant over a, D dominant over d) and the additional rule from Table 1.1 (the red phenotype requires both A and D) yields the classic 9 : 3 : 3 : 1 phenotypic ratio.
Understanding the Question
You are asked to predict the offspring phenotype ratio from a cross between two double heterozygotes (AaDd × AaDd). Table 1.1 defines each phenotype:
- red: AADD, AaDD, AaDd, AADd → any genotype with at least one A and at least one D
- brown: AAdd, Aadd → at least one A, but dd
- scarlet: aaDD, aaDd → aa, but at least one D
- white: aadd → neither A nor D
You must give both the numerical ratio and the phenotype names in the matching order.
Approach
Set out the four gametes each parent can produce, work out the 16 offspring combinations, then group them into the four phenotypes defined in Table 1.1.
Step-by-Step Reasoning
- Each AaDd parent produces gametes AD, Ad, aD, ad in equal proportions (¼ each).
- Combining these in a 4 × 4 Punnett square gives 16 offspring combinations, each with probability 1/16.
- Counting by phenotype class:
- A_D_ → 9 boxes → red
- A_dd → 3 boxes → brown
- aaD_ → 3 boxes → scarlet
- aadd → 1 box → white
- Therefore the offspring phenotype ratio is 9 red : 3 brown : 3 scarlet : 1 white.
Key Takeaways
- Independent assortment of two genes on different chromosomes produces a 9 : 3 : 3 : 1 ratio in F2.
- Always read the phenotype table carefully — here, the red phenotype requires both dominant alleles (A and D), so it gets the 9 class.
- The order of phenotypes in the ratio must match the order of numbers, so 9 : 3 : 3 : 1 ↔ red : brown : scarlet : white.
Common Mistakes
- Writing 9 : 3 : 3 : 1 but listing the phenotypes in the wrong order (e.g. red : scarlet : brown : white).
- Confusing the genotype ratio (1 : 2 : 1 : 2 : 4 : 2 : 1 : 2 : 1, nine classes) with the phenotype ratio.
- Treating the dihybrid as if each phenotype were determined by a single gene — forgetting that red requires both A and D.
Things to Be Careful About
- The phenotype order must be red : brown : scarlet : white to match the 9 : 3 : 3 : 1 ratio.
- Do not give only the ratio (1 mark) without the phenotype names (the second mark).
- Independent assortment (and hence the 9 : 3 : 3 : 1 ratio) only holds when the two loci are on separate chromosomes, which the question states.
After crossing double heterozygotes (genotype AaDd), the student recorded the numbers of offspring in each of the four phenotypic groups.
The student used a chi-squared () test to analyse these data.
The null hypothesis for this test was:
There is no difference between the expected and observed numbers of offspring in each phenotypic group.
The calculated value of was 4.798.
The student compared 4.798 to the values in Table 1.2.
Table 1.2
| degrees of freedom | probability level () | ||
|---|---|---|---|
| 0.10 | 0.05 | 0.01 | |
| 1 | 2.706 | 3.841 | 6.635 |
| 2 | 4.605 | 5.991 | 9.210 |
| 3 | 6.251 | 7.815 | 11.345 |
| 4 | 7.779 | 9.488 | 13.277 |
| 5 | 9.236 | 11.070 | 15.086 |
Using Table 1.2 and the calculated value of of 4.798, state and explain what the student can conclude about the results.
Answer
- Degrees of freedom (df) = number of phenotype categories − 1 = 4 − 1 = 3.
- Critical value at df = 3 and (from Table 1.2) = 7.815.
- Calculated = 4.798, which is less than the critical value of 7.815.
- Therefore, at , the null hypothesis is accepted.
- There is no significant difference between the observed and expected numbers of offspring in each phenotypic group — the data are consistent with the expected 9 : 3 : 3 : 1 ratio.
At and df = 3, the critical value is 7.815. Calculated = 4.798 < 7.815, so the null hypothesis is accepted; there is no significant difference between observed and expected numbers (data fit the 9 : 3 : 3 : 1 ratio).
Background Concept
The chi-squared () test is a goodness-of-fit test that compares observed counts to those expected under a null hypothesis. The formula is
where is the observed count and is the expected count. Degrees of freedom (df) = (number of categories) − 1. The calculated value is compared with a critical value at a chosen probability level (commonly ). If the calculated value is less than the critical value, the null hypothesis is accepted — there is no significant difference between observed and expected. If greater, the null hypothesis is rejected.
Understanding the Question
You are given the calculated = 4.798 and a critical-value table for several degrees of freedom and probability levels. The student is comparing 4 phenotypic groups, so df = 3, and the question implicitly uses . You must state what the student can conclude about the results and explain why.
Approach
Identify df, look up the critical value at , compare the calculated to that critical value, then state whether the null hypothesis is accepted or rejected and what that means biologically.
Step-by-Step Reasoning
- df = number of phenotypic categories − 1 = 4 − 1 = 3.
- Critical value at df = 3 and = 7.815 (read from Table 1.2).
- Comparison: calculated = 4.798 is less than 7.815.
- Conclusion: because the calculated value is less than the critical value, the null hypothesis is accepted at .
- Biological meaning: there is no significant difference between the observed and expected numbers of offspring in each phenotypic group; the observed data are consistent with the expected 9 : 3 : 3 : 1 ratio.
Key Takeaways
- Always quote the critical value at the stated df and probability level.
- 'Accept the null' ≠ 'the genes definitely assort independently' — it means the data are not significantly different from expectation at the chosen p.
- If the calculated had been > 7.815, the null would have been rejected and the data judged significantly different from the expected ratio.
Common Mistakes
- Confusing 'accept' with 'reject' — at , 4.798 < 7.815, so the null is accepted, not rejected.
- Using the wrong df — df = 3 (four phenotype classes − 1), not 4.
- Quoting the calculated value (4.798) but the wrong critical value (e.g. 5.991 from the df = 2 row).
- Stating 'there is no difference at all' — the correct phrasing is 'there is no significant difference'.
Things to Be Careful About
- The conclusion must reference the probability level () — without it the conclusion is incomplete.
- 'Accepting the null hypothesis' is the language of this test; do not say 'the genes assort independently' as the test only supports the expected ratio, not the mechanism of inheritance.
- Limitations to note: small sample sizes reduce the power of the test, and any class with a very low expected number (e.g. 1/16 white) makes the test less reliable.
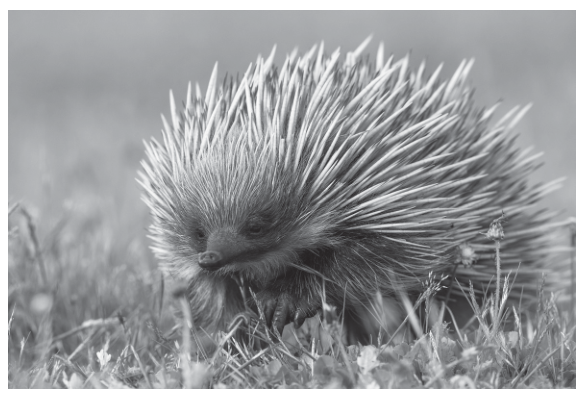
Echidnas are mammals that live in Australia and New Guinea.
Fig. 2.1 shows an echidna.
Scientists analysed the milk produced by female echidnas and identified a protein that they named EchAMP. The scientists predicted that EchAMP may have antibacterial properties.
The scientists tested the effect of EchAMP on the bacterium Escherichia coli.
- 100 E. coli cells were added to each well on a cell culture plate with 96 wells.
- A treatment solution that contained EchAMP was added to each well on the plate.
- A chemical that causes living E. coli cells to fluoresce was added to each well.
- The plate was incubated at .
- Every hour for 7 hours, the fluorescence emitted by the E. coli on the plate was recorded as a measure of E. coli population growth.
- Steps 1–5 were repeated eight times.
The scientists also carried out two control experiments.
- A negative control experiment repeated the procedure (steps 1–6), but the treatment solution did not contain EchAMP.
- A positive control experiment repeated the procedure (steps 1–6), but the treatment solution contained an antibiotic called bacitracin instead of EchAMP.
Answer
Type of treatment (solution)
Type of treatment (solution)
Background Concept
In any controlled experiment three categories of variable must be identified. The independent variable is the factor the experimenter deliberately changes between treatment groups. The dependent variable is the factor measured to assess the effect of that change. Controlled (or standardised) variables are all the other factors that could affect the result, and these are deliberately kept the same to make the comparison fair.
Understanding the Question
The investigation described has three sets of E. coli cultures given different additions: EchAMP, no treatment (negative control), or the antibiotic bacitracin (positive control). The question asks what the experimenter is deliberately varying, i.e. the independent variable.
Approach
Identify the single factor that differs between the experimental groups, distinct from the factors that are deliberately kept the same.
Step-by-Step Reasoning
- Step 3 of the procedure adds either EchAMP, nothing, or bacitracin to the wells.
- The temperature (37 °C), the starting number of E. coli cells (100), the volume/concentration of reagents, and the incubation conditions are kept the same for every well.
- The only deliberate difference between the groups is the substance added — i.e. the type of treatment solution.
Key Takeaways
- The independent variable is what the experimenter manipulates, not what they measure.
- Control groups are still values of the independent variable — they are simply the "no treatment" or "known treatment" levels.
Common Mistakes
- Naming the dependent variable (fluorescence / E. coli population growth) as the independent variable.
- Listing the standardised variables (e.g. temperature) instead.
Things to Be Careful About
- The independent variable here has three levels (EchAMP, no treatment, bacitracin); it is best described as "type of treatment", not just "EchAMP".
The scientists standardised the temperature and the initial number of E. coli cells.
State two other variables that the scientists should standardise in this investigation.
1 ______
2 ______
Answer
1 Volume of, treatment / EchAMP / bacitracin, solution ;
2 Concentration of, EchAMP / bacitracin, solution ;
(Also acceptable: concentration or volume of the fluorescence chemical)
Volume of treatment solution; concentration of treatment solution (or volume/concentration of the fluorescence chemical)
Background Concept
A valid comparison between treatments requires that every variable other than the independent variable is held constant. The more variables that are standardised, the more confidently any difference in the dependent variable can be attributed to the treatment itself.
Understanding the Question
The question already states that temperature (37 °C) and the initial number of E. coli cells (100) are standardised. The candidate must give two more variables that should be kept the same to make the comparison valid.
Approach
Think about what else could influence how much fluorescence is recorded (i.e. how much E. coli grows). Focus on the amount and strength of everything added to the wells, and on the detection system itself.
Step-by-Step Reasoning
- The treatment solutions (EchAMP and bacitracin) could be added at different volumes or strengths — these must be the same in every well.
- The fluorescence dye that marks live cells could be added in different amounts or concentrations — these must also be the same.
- The mark scheme credits any two of: volume of treatment solution; concentration of treatment solution; volume or concentration of the fluorescence chemical.
Key Takeaways
- Standardised variables are usually things added, the time allowed for them to act, or environmental conditions.
- The mark scheme accepts alternatives focused on the amount (volume) or strength (concentration) of what is added.
Common Mistakes
- Restating temperature or the initial E. coli count (already given).
- Naming the type of bacterium or species — these are implied to be the same.
- Giving vague factors such as "the equipment" or "human error".
Things to be Careful About
- "Concentration" rather than "amount" is the precise scientific term here; both are accepted but concentration is preferred.
Explain why the scientists included the negative control experiment in their investigation.
Answer
To compare the effect of (a solution with) no EchAMP with the effect of (a solution with) EchAMP on E. coli population growth — i.e. to provide a baseline showing what growth looks like without the test substance.
To compare the effect on E. coli growth of no EchAMP with that of EchAMP
Background Concept
A negative control is a treatment in which the active substance being tested is omitted. It receives everything else in the procedure (medium, vehicle, temperature, incubation time) so that the only difference between the negative control and the experimental group is the presence of the test substance. Comparing the two reveals whether the test substance has an effect above the background.
Understanding the Question
In this experiment the negative control received the same procedure as the EchAMP group except that the treatment solution did not contain EchAMP. The question asks why the scientists included this control.
Approach
Identify what the negative control reveals that the EchAMP group alone cannot show — i.e. whether E. coli would have grown anyway without EchAMP.
Step-by-Step Reasoning
- The negative control shows the E. coli population growth when no EchAMP is present.
- This is the baseline against which the EchAMP-treated group can be compared.
- If the EchAMP group grows less than the negative control, the difference can be attributed to EchAMP and not to other factors (medium, temperature, dye, etc., which are identical in both).
Key Takeaways
- A negative control isolates the effect of the test substance by showing what happens in its absence.
- Without it, one cannot tell whether E. coli growth in the EchAMP wells is due to EchAMP, the medium, the dye, or simply the incubation conditions.
Common Mistakes
- "To show the experiment works" — too vague; the negative control specifically compares the absence of the test substance to its presence.
- "To provide a comparison with bacitracin" — that is the purpose of the positive control.
Things to be Careful About
- The mark scheme requires comparison between growth with and without EchAMP, not just a generic statement about "checking the experiment".
Explain why the scientists included the positive control experiment in their investigation.
Answer
To compare the effect of EchAMP on E. coli growth with the effect of a known antibiotic (bacitracin) — i.e. to assess how effective EchAMP is relative to an established antibacterial treatment and to confirm that the assay can detect inhibition.
To compare the effect of EchAMP with that of a known antibiotic (bacitracin) on E. coli growth
Background Concept
A positive control is a treatment using a substance that is known to have the effect being tested. It confirms that the experimental set-up is capable of detecting that effect, and provides a benchmark against which the new treatment can be evaluated.
Understanding the Question
In this experiment the positive control used bacitracin, an established antibiotic, in place of EchAMP. The question asks why this control was needed.
Approach
Identify what comparing the unknown treatment (EchAMP) with a known effective treatment (bacitracin) allows the scientists to conclude.
Step-by-Step Reasoning
- Bacitracin is a well-characterised antibiotic, so it is known to inhibit E. coli growth.
- If bacitracin inhibits E. coli in this set-up, the experiment is valid — the fluorescence assay works and the conditions can detect inhibition.
- Comparing the inhibition produced by EchAMP with that produced by bacitracin tells the scientists how effective EchAMP is relative to a treatment that is already known to work.
Key Takeaways
- A positive control has two purposes: (i) to confirm the assay works, and (ii) to provide a benchmark.
- It is the partner to the negative control: together they bracket the range of possible responses.
Common Mistakes
- "To show EchAMP does not work" — the positive control does not test EchAMP; it tests the system with a substance known to inhibit growth.
- "To compare with the negative control" — the positive control is compared with both the EchAMP group and the negative control, but its defining feature is the use of a known effective treatment.
Things to be Careful About
- The mark scheme requires explicit comparison with bacitracin (or "an antibiotic"), not just a general statement about a control.
Some of the results are shown in Table 2.1.
Table 2.1
| time / hours | mean fluorescence / arbitrary units (au) | ||
|---|---|---|---|
| EchAMP | negative control | positive control | |
| 0 | 10 | 10 | 10 |
| 1 | 11 | 11 | 11 |
| 3 | 15 | 15 | 15 |
| 6 | 20 | 35 | 20 |
| 7 | 100 | 140 | 70 |
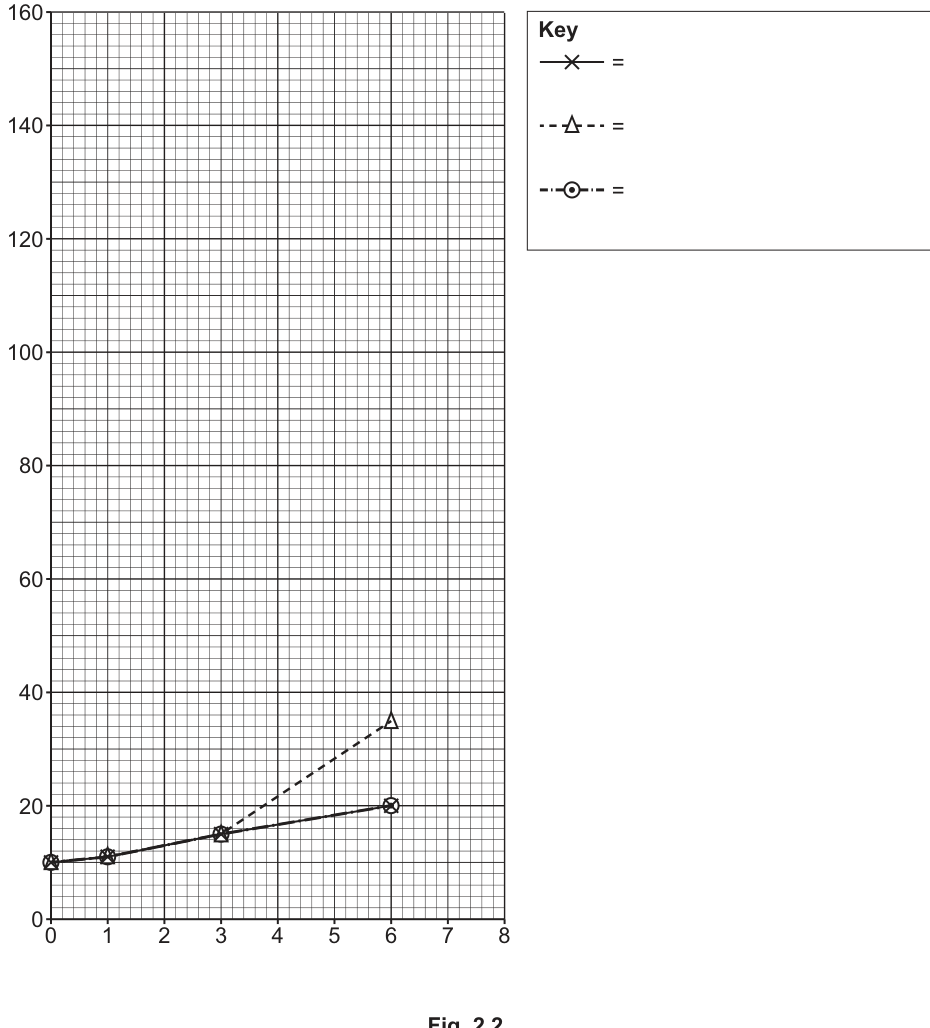
Use Table 2.1 to complete the graph in Fig. 2.2 by:
- plotting the three results at 7 hours
- adding axis labels
- completing the key.
Answer
- Y-axis label: mean fluorescence / arbitrary units (au)
- X-axis label: time / hours
- Three data points plotted at time = 7 h:
- EchAMP = 100 au
- Negative control = 140 au
- Positive control (bacitracin) = 70 au
- Each 7 h point joined by a straight line to the appropriate value at 6 h, using the same line style as that series earlier on the graph.
- Key completed so that each of the three line styles (solid 'x', dashed triangle, dash-dot circle) is identified with the treatment it represents (EchAMP, negative control and bacitracin respectively).
Axis labels added (y: mean fluorescence / au; x: time / hours); three points at 7 h (100, 140, 70) plotted and joined to their 6 h values; key completed.
Background Concept
Line graphs in biology must follow a small set of conventions: the independent variable on the x-axis, the dependent variable on the y-axis, each axis labelled with the quantity and its unit, all data points plotted accurately, and a key (legend) to identify each line when more than one series is shown.
Understanding the Question
The graph in Fig. 2.2 is partially drawn. The candidate must (i) add the three data points for 7 hours from Table 2.1, (ii) label both axes, and (iii) finish the key. Two marks are available: one for the axis labels and completed key, and one for the three plotted points joined to the correct 6-hour values.
Approach
First read the three new values from Table 2.1 at time 7 h. Then trace each existing line back to the 6 h point and continue the line of the same style to the new 7 h value. Finally, label the axes (matching the table headings) and complete the key so each line style is identified with a treatment.
Step-by-Step Reasoning
- Axis labels (taken from Table 2.1):
- y-axis = mean fluorescence / arbitrary units (au)
- x-axis = time / hours
- Units are compulsory.
- Plotting at 7 h (from Table 2.1):
- EchAMP = 100
- Negative control = 140
- Positive control (bacitracin) = 70
- Joining the points:
- The negative control line sits at 35 at 6 h; join it up to 140 at 7 h.
- EchAMP and bacitracin both sit at 20 at 6 h, so the two lines overlap up to 6 h. From 6 h onwards they diverge: one goes to 100 (EchAMP) and the other to 70 (bacitracin).
- Each new 7 h point is joined to its 6 h value by a straight line of the same style as the rest of that series.
- Key: the three symbols in the key box (solid 'x', dashed triangle, dash-dot circle) each need to be matched to a treatment — e.g. solid 'x' = negative control, dashed triangle = EchAMP, dash-dot circle = bacitracin. The exact assignment depends on which line is which on the printed grid; the key simply has to be unambiguous.
Key Takeaways
- The axis label must include both the quantity and the unit (here "mean fluorescence / arbitrary units (au)").
- Data points are read from the table, not estimated; the gridlines allow exact placement.
- When two series share the same values at early time points the lines are coincident; they only diverge where the data diverge.
Common Mistakes
- Forgetting the unit on the axis label, or writing only "fluorescence" instead of "mean fluorescence".
- Plotting a point at the wrong value (e.g. confusing 70 and 100).
- Leaving the key with "=" placeholders and no treatment name.
- Drawing free-floating dots at 7 h without joining them to the 6 h points.
Things to be Careful About
- A new line style on the key must be used for a new line on the graph — do not reuse the same line for two different treatments.
- The second marking point requires the points to be joined to the correct 6 h values, so an isolated 7 h point loses the mark even if its position is right.
Use Table 2.1 and Fig. 2.2 to compare the effect of EchAMP and bacitracin on the population growth of E. coli.
Answer
Any two from:
- Bacitracin reduces the population growth of E. coli more than EchAMP (after 6 hours / at 7 hours) [ORA].
- There is no difference in the effect on E. coli between EchAMP and bacitracin from 0 to 6 hours.
- Both bacitracin and EchAMP reduce the population growth of E. coli more than the negative control (after 3 hours / at 6 hours / at 7 hours).
Bacitracin inhibits growth more than EchAMP at 7 h; both inhibit growth more than the negative control; no difference in effect between 0 and 6 h.
Background Concept
A compare question requires the candidate to identify similarities and/or differences between two data sets, with reference to the values in the table or on the graph. A complete answer states how the two treatments differ at a named time point, and (if relevant) when they are the same.
Understanding the Question
The question asks the candidate to compare the effect of EchAMP with the effect of bacitracin on E. coli population growth, using Table 2.1 and the completed Fig. 2.2.
Approach
Read across the table at each time point. Decide where the two series agree, where they differ, and which series produces the lower fluorescence (i.e. less growth). Frame the answer as comparisons at specific time points.
Step-by-Step Reasoning
- 0, 1, 3 hours: EchAMP and bacitracin have identical values (10, 11, 15). No difference in their effect on growth in this period.
- 6 hours: EchAMP = 20, bacitracin = 20. Still no difference.
- 7 hours: EchAMP = 100, bacitracin = 70. Bacitracin produces lower fluorescence, so it has reduced E. coli growth more than EchAMP at this point.
- Versus the negative control: at 6 h the negative control is at 35 while EchAMP and bacitracin are both at 20; at 7 h it is at 140 while EchAMP is at 100 and bacitracin at 70. Both treatments therefore reduce growth more than the negative control.
The mark scheme credits any two of these comparisons, ideally with explicit time points and using comparative language ("more than", "less than").
Key Takeaways
- Comparisons need both direction (more/less) and time (at which time point).
- The greatest difference between EchAMP and bacitracin appears late, at 7 h; before that they look the same.
- Comparing each treatment with the negative control reveals whether each has any antibacterial effect at all.
Common Mistakes
- "Bacitracin is better than EchAMP" — too vague; a time point is required.
- Reading the data upside down (thinking lower fluorescence means more growth).
- Saying that EchAMP has no effect; it does reduce growth compared with the negative control, just less strongly than bacitracin at 7 h.
Things to be Careful About
- The mark scheme offers an ORA (or reverse argument) on point 1, so "EchAMP reduces growth less than bacitracin" is equally valid.
- The wording "after 3 hours / at 6 hours / at 7 hours" in the mark scheme means any one of these time points is acceptable for the third comparison.
The scientists used -tests to analyse the results.
The scientists compared the fluorescence emitted by E. coli after seven hours when exposed to:
- the negative control
- EchAMP.
Answer
There is no difference between the (mean) fluorescence emitted by E. coli after seven hours when exposed to the negative control and when exposed to EchAMP.
There is no difference between the mean fluorescence of E. coli after 7 h when exposed to the negative control and when exposed to EchAMP.
Background Concept
A null hypothesis () is the statistical statement that there is no significant difference between the populations being compared. The alternative hypothesis () is the opposite — that there is a significant difference. In a t-test, the null hypothesis is the one being tested directly: if the calculated t exceeds the critical value, is rejected.
Understanding the Question
The t-test described in the question compares the mean fluorescence of E. coli after 7 h under two conditions: the negative control, and EchAMP. The candidate must state the null hypothesis for this specific comparison.
Approach
Use the standard wording "there is no (significant) difference between …" and make sure the wording refers to the two groups actually being tested in the t-test (negative control vs. EchAMP at 7 h) and to the variable being measured (mean fluorescence).
Step-by-Step Reasoning
- The variable measured is fluorescence (in arbitrary units).
- The two groups are the negative control and the EchAMP treatment.
- The time point at which the comparison is made is 7 hours.
- The null hypothesis therefore states: there is no difference between the mean fluorescence of E. coli after 7 h in the negative control and in EchAMP.
Key Takeaways
- A null hypothesis always contains "no difference" or equivalent wording.
- It must refer to the specific groups and the specific variable, not a vague general statement.
- The t-test then evaluates whether the data provide enough evidence to reject that statement.
Common Mistakes
- Writing the alternative hypothesis ("there is a difference") by mistake.
- Omitting the variable ("no difference in E. coli") or the time point (7 h).
- Comparing the wrong two groups (e.g. EchAMP vs. bacitracin) — the question specifies negative control vs. EchAMP.
Things to be Careful About
- The word "significant" may be included but is not required by the mark scheme; the key point is "no difference".
For E. coli exposed to the negative control, after seven hours:
- the mean of nine fluorescence measurements was
- the sample standard deviation was .
For E. coli exposed to EchAMP, after seven hours:
- the mean of nine fluorescence measurements was
- the sample standard deviation was .
The formula for calculating a -test is:
key to symbols
= mean
= sample standard deviation
= sample size (number of observations)
Calculate a value of for these data.
Show your working and state your answer to four significant figures.
= ______
Working
Assign the symbols from the question:
- , , (negative control)
- , , (EchAMP)
Substitute the values:
Answer
(4 significant figures)
9.370
Background Concept
The t-test compares two means and asks whether the difference between them is large enough, relative to the spread of the data, to be unlikely to have arisen by chance. The formula given in the question
is the standard two-sample t-statistic. The numerator is the size of the difference between the two sample means; the denominator is a measure of the standard error of that difference. A larger t means the two means are further apart relative to the variability in the samples.
Understanding the Question
The candidate has to substitute the values given in the question into the formula and calculate t to four significant figures. Three marks are available: one for correct working, one for the answer to 3 s.f. (the intermediate value 9.37), and one for the final answer to 4 s.f. (9.370).
Approach
Step 1: identify the values of , and for each group.
Step 2: substitute them into the formula in the right places — note the formula uses , so the standard deviations must be squared.
Step 3: evaluate the expression carefully, and report the final answer to four significant figures.
Step-by-Step Reasoning
- The negative control group has , , .
- The EchAMP group has , , .
- Numerator: .
- Denominator: .
- Combining: .
- , so .
- To 4 significant figures, .
Key Takeaways
- The standard deviation is squared inside the formula — a common error is to forget the square.
- The numerator and denominator must be calculated separately; mixing them up produces a nonsense answer.
- The final answer must be quoted to the requested number of significant figures (here, 4); a 3-s.f. answer of 9.37 would earn the second mark but not the third.
Common Mistakes
- Using instead of in the formula (e.g. writing instead of ).
- Swapping the numerator and denominator (i.e. dividing the smaller number by the larger).
- Reporting the answer to the wrong number of significant figures (e.g. 9.4, 9.37, 9.3698).
- Rounding errors mid-calculation; keeping more digits throughout gives a more accurate 4-s.f. answer.
Things to be Careful About
- The formula provided uses sample standard deviation, , not population standard deviation, . Do not apply Bessel's correction here — the question has already given the correct values.
- The mark scheme accepts 9.37 (3 s.f.) for one mark, but the third mark requires 9.370 to 4 s.f.
The value calculated by the scientists was significant.
After reading the scientific paper published by the scientists, a student wrote the conclusion:
EchAMP would make a good treatment for bacterial infections in the human digestive system.
Suggest four reasons why this conclusion might not be valid.
1 ______
2 ______
3 ______
4 ______
Answer
Any four from:
- The experiment was carried out in the laboratory / in vitro, not in a person.
- The experiment only used E. coli / did not test other bacterial species.
- EchAMP may also kill beneficial bacteria in the human digestive system.
- EchAMP might not be as effective as other, existing antibiotics / treatments.
- EchAMP could, cause side effects / be toxic in humans (or: the experiment was only run for 7 hours, so longer-term effects are unknown).
- EchAMP is a protein and would be digested by proteases / enzymes in the digestive system before it could act.
- EchAMP did not kill all of the E. coli (the population still grew).
See answer list — any four scientifically specific reasons.
Background Concept
A conclusion can be statistically significant (the t-test rejects the null) and still not be valid as a basis for a real-world claim. Validity depends on (i) the experimental design being appropriate, (ii) the biological relevance of the model, and (iii) the safety and practicality of the proposed application. Even when an antibiotic works in a Petri dish, it may not work, or may not be safe, in a human patient.
Understanding the Question
The student concluded that "EchAMP would make a good treatment for bacterial infections in the human digestive system." The candidate must suggest four scientifically specific reasons why this conclusion is not valid, even though the t-test was significant.
Approach
Separate the problem into categories:
- Validity of the experimental model — was the test done in a way that represents a real human infection?
- Specificity of the effect — does EchAMP affect only harmful bacteria?
- Effectiveness — how does EchAMP compare with existing treatments?
- Safety — could EchAMP harm the patient?
- Pharmacological reality — can EchAMP even reach the bacteria in the human digestive system?
Step-by-Step Reasoning
- In vitro vs in vivo: the experiment was done on E. coli in wells on a plate, not in a living person. The environment in the human digestive system (other microbes, pH, immune system, food, enzymes) is very different.
- One species only: only E. coli was tested. Many different bacteria cause digestive-tract infections; EchAMP might not work against them.
- Effect on beneficial bacteria: the human digestive system contains many helpful bacteria. A treatment that kills indiscriminately could damage the natural microbiota.
- Comparison with existing treatments: bacitracin (the positive control) is less effective than some other antibiotics already used clinically, and EchAMP is less effective than bacitracin — so EchAMP is unlikely to be a frontline treatment.
- Safety / toxicity / duration: the trial ran for only 7 hours. Side effects, toxicity and longer-term consequences in humans are unknown. A drug that seems harmless for 7 hours may not be safe in the long term.
- Digestion of the protein: EchAMP is a protein. If taken orally, it would be hydrolysed by proteases (e.g. pepsin, trypsin) in the stomach and small intestine, so it would not reach the bacteria intact.
- Incomplete killing: the E. coli still grew in the EchAMP wells (fluorescence went from 10 to 100); EchAMP only slowed growth, it did not kill the bacteria. A useful treatment for an infection usually needs to clear the infection, not just slow it.
The mark scheme credits any four of these, with point 5 offering a choice between toxicity and short duration.
Key Takeaways
- Statistical significance is not the same as practical or clinical validity.
- A new treatment must be tested in the system where it will be used (in vivo), on the species it will be used against, and for long enough to detect side effects.
- The chemistry of the drug (here, a protein) and the route of administration (oral → digestive enzymes) must be compatible.
Common Mistakes
- "More research is needed" — too vague; the mark scheme wants a specific, scientific reason.
- Restating that the t-test was significant as a problem — significance is not the issue; it is the leap from E. coli in a well to humans in a digestive system.
- Suggesting reasons that have nothing to do with the experiment (e.g. "echidnas are protected species").
Things to be Careful About
- The mark scheme point 5 offers an "or" between toxicity/side effects and short duration — only one of these is needed for that mark.
- The protein-digestion point (mark scheme point 6) is specific: a protein taken orally is digested. A candidate who says "it will be broken down in the stomach" needs to mention that it is a protein and that enzymes (proteases) digest it.