Biology 9700/44 — May/June 2025
Cambridge A-Level · A Level Structured Questions · worked solutions for every part, with the mark scheme
Topics Inheritance · Energy and Respiration · Classification, Biodiversity and Conservation · Homeostasis · Genetic Technology · Selection and Evolution · +2 more
Describe how a decrease in the water potential of the blood leads to an increase in the concentration of antidiuretic hormone (ADH) in the blood.
Answer
- Osmoreceptors in the hypothalamus detect the decrease in blood water potential / the osmoreceptors shrink;
- The hypothalamus produces (more) ADH;
- The posterior pituitary releases (more) ADH into the blood.
Osmoreceptors detect the fall in water potential; the hypothalamus produces ADH; the posterior pituitary releases ADH into the blood.
Background Concept
Homeostasis is the maintenance of a relatively constant internal environment. Blood water potential must be kept within narrow limits because a fall (too much solute relative to water) causes cells to lose water by osmosis, while a rise causes them to gain water. The body corrects a fall in blood water potential by increasing the amount of water reabsorbed from the kidney tubules back into the blood, and this is achieved by the hormone antidiuretic hormone (ADH).
ADH is a peptide hormone synthesised by neurosecretory cells whose cell bodies lie in the hypothalamus of the brain. The axons of these cells run down the infundibulum and terminate in the posterior pituitary gland, where ADH is stored in the axon terminals. When a nerve signal reaches the terminals, ADH is released into the capillaries of the posterior pituitary and enters the systemic circulation. (This is why ADH is unusual: it is produced in the hypothalamus but released from the posterior pituitary.)
Osmoreceptors are specialised stretch-sensitive neurones located in the hypothalamus itself. When the water potential of the blood falling through them falls, water leaves the osmoreceptor cells by osmosis, they shrink, and this generates action potentials that travel to the ADH-producing neurosecretory cells, stimulating them to make and release more ADH.
Understanding the Question
The question is asking you to describe the complete chain of events that links a stimulus (lower blood water potential) to a response (higher ADH concentration in the blood). The command word "describe" here means give a clear, ordered account of the pathway, naming each structure involved.
The three marks correspond to: the receptor, the site of ADH production, and the site of ADH release. All three must be named correctly.
Approach
Use a stimulus → receptor → control centre → effector → response framework and identify the structures in this pathway:
- Stimulus: decreased water potential of the blood
- Receptor: osmoreceptors in the hypothalamus
- Control centre / production site: hypothalamus (neurosecretory cells)
- Release site: posterior pituitary
- Response: increased ADH in the blood
Step-by-Step Reasoning
-
Osmoreceptors in the hypothalamus detect the change. Because blood water potential has fallen (e.g. through sweating, not drinking), water moves out of the osmoreceptor cells by osmosis, they shrink slightly, and they fire impulses that stimulate the ADH-producing neurosecretory cells nearby. The mark scheme accepts either "osmoreceptors detect the decrease" or "osmoreceptors shrink".
-
The hypothalamus produces (more) ADH. The cell bodies of the neurosecretory cells are in the hypothalamus, so this is where ADH is synthesised. The mark scheme accepts "neurosecretory cells produce ADH" as an alternative, but rejects "secretion" here because the hypothalamus is producing, not releasing, the hormone at this point.
-
The posterior pituitary releases ADH into the blood. ADH is transported down the axons of the neurosecretory cells to the posterior pituitary, where it is stored in the axon terminals. Increased nerve activity from the osmoreceptors causes the terminals to release more ADH into the surrounding capillaries, raising the concentration of ADH in the blood. The mark scheme accepts "secretes" here (because it is the correct anatomical release site) but explicitly rejects "produces" — the posterior pituitary does not make ADH.
Key Takeaways
- ADH is produced in the hypothalamus by neurosecretory cells but released from the posterior pituitary.
- Osmoreceptors are located in the hypothalamus.
- The pathway in this question is: blood water potential falls → osmoreceptors in the hypothalamus are stimulated → hypothalamus produces more ADH → posterior pituitary releases more ADH into the blood.
Common Mistakes
- Saying the posterior pituitary "produces" ADH — this is wrong. The mark scheme rejects "produces" for the posterior pituitary; ADH is only stored and released there.
- Omitting the osmoreceptors and going straight to "the brain detects" or "the pituitary releases".
- Confusing anterior and posterior pituitary — only the posterior pituitary releases ADH; the anterior pituitary releases different hormones (e.g. GH, TSH, ACTH).
- Saying ADH is "secreted" by the hypothalamus — the mark scheme rejects "secretion" for the hypothalamus, because the release event is at the posterior pituitary, not the hypothalamus.
Things to Be Careful About
- Use the precise anatomical terms: osmoreceptors, hypothalamus, posterior pituitary.
- The verb is produces for the hypothalamus and releases (or secretes) for the posterior pituitary — do not mix these up.
- ADH travels in the blood (it is a hormone, not a neurotransmitter), even though it is released by neurones.
ADH is transported in the blood to the cells of the collecting duct of the kidney.
Fig. 1.1 is a diagram outlining the action of ADH on the cells of the collecting duct.
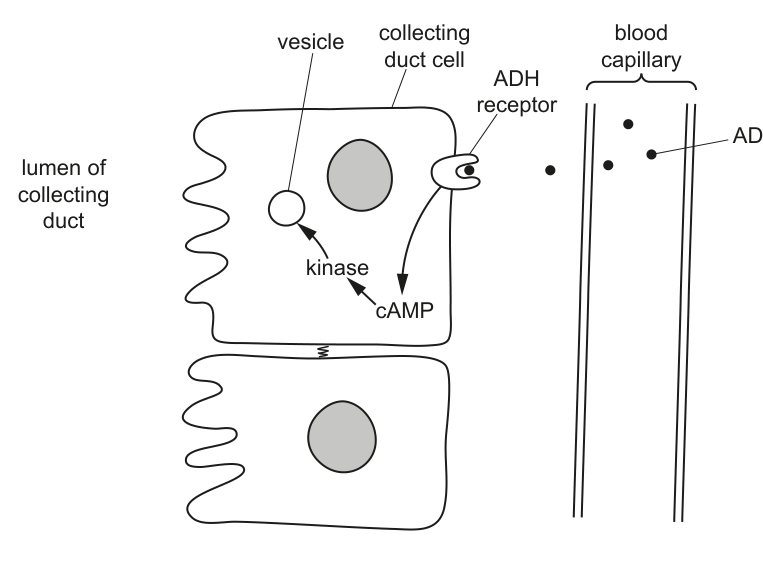
Binding of ADH to the ADH receptor triggers reactions within the cell. One of the first reactions is the production of cyclic AMP (cAMP).
State the term used to describe molecules such as cAMP in cell signalling.
Answer
Second(ary) messenger.
Secondary messenger.
Background Concept
In cell signalling, the first messenger is the extracellular signal that arrives at the cell — for ADH this is the ADH molecule itself, which is too large and hydrophilic to cross the plasma membrane. When the first messenger binds to its receptor on the outside of the cell, the receptor triggers a cascade of events inside the cell. To relay the signal from the inner face of the membrane to the enzymes or other machinery deep inside the cytoplasm, the cell uses small intracellular molecules called second messengers.
The most common second messenger is cyclic AMP (cAMP), made from ATP by the enzyme adenylyl cyclase. cAMP then activates protein kinases (such as protein kinase A), which phosphorylate target proteins and bring about the cell's response. Other second messengers include Ca²⁺, IP₃ and cGMP.
In the case of ADH on a collecting duct cell, the chain is: ADH (first messenger) → ADH receptor → G-protein → adenylyl cyclase → cAMP (second messenger) → protein kinase A → vesicle movement and aquaporin insertion.
Understanding the Question
The question is testing the specific vocabulary of cell signalling. You are told that cAMP is one of the first events inside the cell after ADH binds its receptor, and asked to name the category of molecule to which cAMP belongs.
Approach
This is a recall question. Apply the "first messenger / second messenger" distinction: the first messenger carries the signal from outside to the cell, and the second messenger carries the signal from the membrane into the cell's interior.
Step-by-Step Reasoning
ADH is the first messenger (it arrives from outside the cell). When ADH binds its receptor, adenylyl cyclase is activated on the inner face of the membrane and produces cAMP from ATP. cAMP then diffuses through the cytoplasm and activates kinases. Because cAMP is generated inside the cell in response to the external signal, it is a secondary (second) messenger.
The mark scheme accepts "second" or "secondary" messenger. Spelling it as "secondary messenger" is the most common and safest form.
Key Takeaways
- First messenger = the extracellular signal (the hormone or neurotransmitter itself).
- Second messenger = the small intracellular molecule that relays the signal inside the cell (e.g. cAMP, Ca²⁺, IP₃).
- ADH acts through the cAMP second-messenger pathway.
Common Mistakes
- Writing "first messenger" or "intracellular hormone" — both are wrong; cAMP is the second messenger, not the first.
- Writing "enzyme" — cAMP is a signalling molecule, not an enzyme.
- Writing "neurotransmitter" — cAMP is not a neurotransmitter; it is a second messenger.
Things to Be Careful About
- Use the exact term secondary messenger (or second messenger); avoid vague paraphrases such as "chemical signal" or "messenger inside the cell".
Answer
- The vesicle moves to and fuses with the cell surface membrane (on the luminal side) so that the (aquaporin) proteins in its membrane are added to / inserted into the cell surface membrane;
- This makes the collecting duct cell membrane more permeable to water, so more water can pass through by osmosis.
The vesicle moves to and fuses with the cell surface (luminal) membrane, inserting aquaporins so that the membrane becomes more permeable to water.
Background Concept
The collecting duct wall consists of cuboidal epithelial cells whose apical (luminal) membrane is normally only weakly permeable to water. The number of water channels (aquaporins) in this membrane determines how much water can move out of the filtrate and into the cell, and from there into the surrounding blood capillaries.
Aquaporins are stored pre-made in membrane-bound vesicles inside the cytoplasm of the collecting duct cells. The vesicles can be moved to the apical surface, where they fuse with the plasma membrane (exocytosis) and insert their aquaporins into it. This is a quick way for the cell to change its water permeability in response to a hormone signal without having to make new aquaporin proteins from scratch.
The trigger for vesicle movement is the cAMP-dependent protein kinase A (PKA) that is activated downstream of ADH binding. PKA phosphorylates target proteins that move the vesicles along the cytoskeleton and dock them at the apical membrane.
Understanding the Question
The question asks specifically what the vesicle does when stimulated by the kinase. The kinase is the cAMP-activated enzyme shown in Fig. 1.1 acting on the vesicle. You need to describe (a) the membrane event involving the vesicle and (b) the consequence of that event for water permeability.
Approach
Two linked steps to describe: a movement/fusion event, and a permeability consequence. Anchor your answer to Fig. 1.1: the vesicle sits in the cytoplasm of the collecting duct cell and the kinase (downstream of cAMP) acts on it.
Step-by-Step Reasoning
-
Membrane event: The vesicle moves to the cell surface (apical/luminal) membrane and fuses with it. This inserts the aquaporin proteins that are embedded in the vesicle membrane into the apical plasma membrane of the cell, so they are now exposed to the lumen of the collecting duct.
-
Consequence for water permeability: With many more aquaporins now in the apical membrane, the membrane becomes much more permeable to water. Water can therefore move out of the filtrate in the lumen, through the cell, and on into the tissue fluid and blood capillary by osmosis. The mark scheme awards the second mark for stating that the membrane becomes "more permeable to water".
Key Takeaways
- Vesicles are the storage and delivery system for aquaporins in collecting duct cells.
- The kinase signal causes vesicle movement and fusion with the apical membrane, not synthesis of new aquaporin proteins.
- More aquaporins in the membrane = higher water permeability = more water reabsorbed from the filtrate.
Common Mistakes
- Saying the kinase "makes" or "synthesises" aquaporins — wrong. The aquaporins already exist in the vesicle membrane; the kinase triggers vesicle movement/fusion.
- Saying the vesicle "destroys" or "removes" water — wrong. The vesicle inserts channels.
- Describing what the kinase does (activates a vesicle) rather than what the vesicle does, which is what the question asks.
- Failing to make the link from "inserting aquaporins" to "more water can be reabsorbed".
Things to Be Careful About
- Name both: the membrane event (vesicle fuses with cell surface / luminal membrane and inserts aquaporins) AND the physiological outcome (the membrane becomes more permeable to water).
- Reference to the luminal (apical) side matters; this is the side of the cell that faces the filtrate.
On Fig. 1.1, draw arrows to show the direction of movement of water molecules after the cells of the collecting duct have responded to ADH.
Answer
Draw an arrow from the lumen of the collecting duct into the collecting duct cell, and a second arrow from the cell into the blood capillary (or one continuous arrow from the lumen, through the cell, into the blood capillary).
The arrows show water moving by osmosis, down its water potential gradient, from the filtrate (higher water potential) into the cell and on into the blood capillary (lower water potential).
Arrows from the lumen into the cell and from the cell into the blood capillary (showing osmosis of water from filtrate into blood).
Background Concept
Water moves across membranes by osmosis, which is the net movement of water molecules from a region of higher water potential to a region of lower water potential across a partially permeable membrane. The aquaporins inserted by ADH make the collecting duct wall much more permeable to water, so once the cells have responded to ADH, osmosis occurs rapidly across the epithelium.
Inside the collecting duct cell, the cytoplasm provides a continuous aqueous pathway to the basal membrane, which is freely permeable to water. Water that enters at the apical (luminal) side passes through the cell and exits on the other side into the tissue fluid and the blood capillary, where the water potential of the plasma is lower than that of the filtrate because of the plasma proteins and dissolved solutes.
Understanding the Question
You are asked to add arrows to Fig. 1.1 showing where water moves once the cells of the collecting duct have responded to ADH. The mark scheme accepts either (a) two separate arrows (lumen → cell, and cell → blood capillary) or (b) a single continuous arrow passing through the cell from the lumen to the blood capillary. Both are equivalent and score the mark.
Approach
Identify the water potential gradient first. The filtrate in the lumen of the collecting duct has the highest water potential (relatively dilute tubular fluid). The blood in the capillary has a lower water potential (more dissolved solutes and plasma proteins). The cell cytoplasm is intermediate. Water therefore moves from high → low water potential, i.e. lumen → cell → blood.
Step-by-Step Reasoning
- Place the first arrow on the luminal (apical) side of the cell, pointing from the lumen into the cytoplasm of the collecting duct cell. This represents water entering through the newly inserted aquaporins by osmosis.
- Place the second arrow on the basal side of the cell, pointing from the cytoplasm into the blood capillary. This represents water leaving the cell and entering the blood.
- (Equivalent alternative) Draw a single arrow that starts in the lumen, passes through the cell, and ends in the blood capillary. Either layout scores the mark.
The arrows should not point in the opposite direction, because that would imply water moving up its water potential gradient, which does not happen.
Key Takeaways
- In the presence of ADH, water moves from the filtrate in the lumen, through the collecting duct cell, into the blood.
- The direction of water movement is set by the water potential gradient (lumen high Ψ → blood low Ψ), not by ADH itself.
- ADH controls the rate of osmosis by inserting aquaporins, but the direction is set by water potential.
Common Mistakes
- Arrows pointing from blood to lumen (i.e. backwards) — this would imply water moving against its water potential gradient, which is wrong.
- Drawing arrows only in the cell cytoplasm but not across either membrane — water must cross a membrane to be reabsorbed.
- Drawing arrows that loop or curl — keep them straight and clear, showing the path from lumen to blood.
Things to Be Careful About
- The arrows represent water movement, not solute movement.
- The arrows should pass through the cell, not around it, because the route of water reabsorption in the collecting duct is transcellular (through the cell) under the influence of ADH.
- The mark scheme allows two arrows or one continuous arrow — use whichever is clearer on the printed figure.
Some people have a rare kidney disorder in which ADH is not able to bind to ADH receptors.
Suggest the effects of this disorder on osmoregulation.
Answer
- No / less water is reabsorbed from the filtrate into the blood;
- A large(r) volume of dilute urine is produced;
- (And the water potential of the blood remains low, so the person is effectively dehydrated even though they are losing water in the urine.)
No/less water is reabsorbed, so a large volume of dilute urine is produced and the water potential of the blood remains low.
Background Concept
The whole point of the ADH signalling pathway is to put aquaporins into the apical membrane of collecting duct cells, so that water can leave the filtrate and re-enter the blood. If ADH cannot bind to its receptor, the chain of events (receptor → G-protein → cAMP → kinase → vesicle → aquaporin insertion) is never started, and the apical membrane stays relatively impermeable to water.
Without water reabsorption in the collecting duct, the filtrate passes through the nephron largely unchanged in volume and concentration, producing a large amount of very dilute urine. At the same time, the body continues to lose water that should have been conserved, so blood water potential remains low (the blood becomes more concentrated), even though ADH levels in the blood may be high because the osmoreceptors keep firing. This condition is called nephrogenic diabetes insipidus (when due to receptor or aquaporin problems, as opposed to cranial diabetes insipidus where ADH itself is deficient).
Understanding the Question
The question describes a hypothetical kidney disorder in which ADH cannot bind to its receptors and asks you to suggest the effects on osmoregulation. "Suggest" means you are expected to apply your biological knowledge to a new scenario and reason out the consequences — not just recall a fact.
You need to give two distinct effects, each carrying a separate mark.
Approach
Work through the ADH pathway step by step and identify where the chain breaks down when the receptor is non-functional, then trace the downstream consequences. Think about: (1) the immediate effect on the cells, (2) the effect on the filtrate/urine, and (3) the effect on the blood.
Step-by-Step Reasoning
-
No / less water is reabsorbed. Because ADH cannot bind, the cAMP cascade is not activated, the vesicles do not fuse with the apical membrane, and aquaporins are not inserted. Water therefore stays in the filtrate inside the collecting duct instead of moving into the cell and on into the blood. The mark scheme accepts "no/less water reabsorbed" or "no/less water absorbed into capillary/blood".
-
Large volume of dilute urine is produced. With the collecting duct wall remaining impermeable to water, the filtrate is not concentrated as it passes through. The result is a much larger volume of urine (because water has not been reabsorbed) and a low solute concentration (because the filtrate has not been concentrated). The mark scheme accepts "large(r) volume of urine / dilute urine / low(er) concentration of urine".
-
Blood water potential remains low. Because water is being lost in the urine and not returned to the blood, the blood stays more concentrated than it should be. The osmoreceptors in the hypothalamus keep firing, and the hypothalamus keeps producing ADH and the posterior pituitary keeps releasing it — but it has no effect. (Other valid points the mark scheme allows as the second mark: feelings of thirst, dehydration, dizziness, fatigue, decreased blood volume, continued ADH release.)
Key Takeaways
- A non-functional ADH receptor mimics ADH deficiency: aquaporins are never inserted, so the collecting duct is permanently impermeable to water.
- The clinical picture is large volumes of very dilute urine combined with chronic dehydration (low blood water potential).
- The osmoregulatory feedback loop is broken at the receptor, not at ADH production, so circulating ADH levels may actually be raised.
Common Mistakes
- Saying the person will not produce ADH — wrong. ADH is still produced and released normally; the problem is the receptor, not the hormone.
- Saying the urine will be concentrated — this is the opposite of what happens. With no water reabsorption, urine is dilute.
- Vague answers like "the kidneys won't work properly" or "the person will get ill" — these do not score specific marks. You need to name the volume/concentration of the urine and/or the water potential of the blood.
- Saying the disorder is diabetes mellitus — wrong. Diabetes insipidus is the ADH-related condition; diabetes mellitus is a glucose-regulation disorder (insulin deficiency/resistance).
Things to Be Careful About
- Use the precise terms: large volume, dilute urine, low blood water potential (or blood more concentrated / dehydrated).
- Distinguish reabsorption (the desired effect) from excretion (what is actually happening in this disorder).
- The mark scheme rejects "amount" on its own (it accepts "volume" or "concentration" but not "amount of urine").
Inherited diseases are caused by genetic mutations.
Huntington’s disease is an inherited genetic disease.
Using Huntington’s disease as an example, outline the relationship between genes, proteins and phenotype.
Answer
Gene
- Huntington's disease is caused by a mutation in the HTT (huntingtin) gene.
- The mutation is dominant, so only one mutant allele is needed; a heterozygote has the disease.
- The mutation involves an increased number of CAG (trinucleotide) repeats.
Protein
- A non-functional (or altered) huntingtin protein is produced.
Phenotype
- Cognitive / behavioural / personality / mood changes.
- Difficulties with coordination and movement.
See working
Background Concept
The central dogma of molecular biology describes how information flows from DNA to RNA to protein, and how the proteins made determine the observable characteristics (phenotype) of an organism. A gene is a length of DNA that codes for a particular polypeptide; a mutation in that gene may alter the polypeptide made and so change the phenotype. Inherited diseases are caused by mutations that are passed from parent to offspring in the gametes, so every cell of the affected individual carries the mutation.
Huntington's disease is an autosomal dominant disorder caused by a mutation in the HTT gene on chromosome 4. The HTT gene normally contains a short, repeated three-base sequence (CAG) repeated a defined number of times. In people who develop Huntington's disease, the CAG repeat is expanded beyond the normal range. The expanded repeat is inherited in a dominant manner, so a heterozygote (one normal and one mutant allele) develops the disease.
Understanding the Question
The question is a structured 'outline' asking the candidate to link three levels — gene, protein and phenotype — using Huntington's disease as the worked example. Four marks are available, so the answer needs to make four creditable points: roughly two at the gene level, one at the protein level and one or more at the phenotype level. The mark scheme accepts up to two of three possible gene-level facts and at least one protein fact and one phenotype fact, with a maximum of four marks overall.
Approach
Organise the answer under three headings (Gene, Protein, Phenotype) and under each heading state the specific fact(s) about Huntington's disease. The two strongest gene-level points to include are the HTT gene name and the dominant nature of the allele (heterozygote affected). The CAG repeat expansion is a useful third gene fact. The protein fact is that the huntingtin protein produced is non-functional/altered. The phenotype facts should be specific (not just 'affects the brain').
Step-by-Step Reasoning
Gene level: The HTT gene on chromosome 4 carries an expanded CAG trinucleotide repeat. The mutant allele is dominant, so a heterozygote (one normal HTT allele and one expanded allele) develops the disease. This is unusual because most loss-of-function mutations are recessive; Huntington's is a toxic gain-of-function, which is why one copy is enough to produce the disease.
Protein level: The expanded CAG repeat is translated into an abnormally long polyglutamine tract at one end of the huntingtin protein. The misfolded huntingtin protein aggregates inside neurons, particularly in the striatum and cerebral cortex, and the protein is non-functional/toxic to those cells.
Phenotype level: Damage to these brain regions produces the characteristic symptoms: progressive loss of movement control (chorea, clumsiness), cognitive decline, and changes in personality, behaviour and mood. Onset is typically in mid-adulthood because the toxic protein accumulates slowly over decades.
Key Takeaways
- The gene → protein → phenotype chain is the core of any inherited-disease question.
- A single gene mutation can have far-reaching effects if the protein it encodes is widely used in the cell.
- Huntington's is a dominant, gain-of-function trinucleotide repeat expansion disorder — different from the loss-of-function recessive disorders (e.g. cystic fibrosis, sickle cell) usually studied at AS Level.
- The mutant allele is fully penetrant: every heterozygote eventually develops the disease.
Common Mistakes
- Naming the protein 'huntingtin' but forgetting the gene is HTT (or vice versa).
- Stating the disease is recessive because the heterozygote 'cannot' have the disease — it is dominant.
- Vague phenotype statements such as 'affects the brain' or 'causes death' — the mark scheme wants specific symptoms.
- Saying 'more genes are produced' instead of 'a mutant gene produces a non-functional protein'.
Things to Be Careful About
- Be precise: HTT/huntingtin, CAG repeats, dominant (not recessive), non-functional protein.
- 'Cognitive/behavioural/personality/mood changes' and 'coordination/movement difficulties' are the two phenotype marks awarded.
- The mark scheme caps the gene section at 2 marks, so there is no point listing more than two gene-level facts.
- Spelling: H-T-T for the gene; the protein 'huntingtin' is not italicised.
Retinitis pigmentosa is an inherited genetic disease that causes loss of vision.
The inheritance of a rare form of retinitis pigmentosa in a family is shown in Fig. 2.1.
Scientists concluded that the inheritance of this rare form of retinitis pigmentosa is linked to the Y chromosome.
Using evidence shown in Fig. 2.1, explain why the scientists reached this conclusion.
Answer
- Only males in the family are affected with retinitis pigmentosa; no female is affected.
- Only males have a Y chromosome (males are XY); females have two X chromosomes and no Y, so they cannot inherit or transmit a Y-linked allele.
- All sons of affected fathers are affected (and all sons of unaffected fathers are unaffected), showing that the disease is passed strictly from father to son on the Y chromosome.
See working
Background Concept
Inheritance patterns are deduced from pedigree charts by examining which individuals are affected, the sex ratio of the affected, and how the trait is transmitted between generations. The main patterns are autosomal dominant, autosomal recessive, X-linked dominant, X-linked recessive and Y-linked. Each has a distinctive signature.
Y-linked inheritance is the simplest pattern to recognise: the disease allele sits on the Y chromosome. Only males have a Y chromosome (males are XY, females are XX), so only males can be affected, and the allele passes from every affected father to every one of his sons, and to none of his daughters.
Understanding the Question
The pedigree (Fig. 2.1) shows a family in which a rare form of retinitis pigmentosa is segregating. Scientists concluded that the inheritance is Y-linked. The question asks the candidate to use the pedigree as evidence to justify this conclusion, so the answer must point to the specific features in the pedigree that are consistent only with Y-linkage.
Approach
State the three defining features of Y-linked inheritance and check that the pedigree shows them:
- Only males are affected; no female is affected.
- Only males have a Y chromosome, so only they can carry a Y-linked allele.
- All sons of affected fathers are affected (no son of an affected father escapes); conversely, sons of unaffected fathers are unaffected.
The mark scheme awards one mark per feature, with a maximum of three.
Step-by-Step Reasoning
Looking at the pedigree: every shaded symbol (affected individual) is a square, denoting a male. No circle (female) is shaded. This satisfies the first feature of Y-linkage.
The second feature is mechanistic: females do not have a Y chromosome — they have two X chromosomes — so they cannot be affected by a Y-linked disease. Likewise, an affected male cannot pass the disease to a daughter because daughters do not inherit the father's Y chromosome.
The third feature is the transmission pattern: every son of an affected father in the pedigree is himself affected. This is exactly what is expected if the disease allele is on the Y chromosome — the son inherits his father's Y, with the disease allele attached. Conversely, sons of unaffected fathers are unaffected, consistent with the absence of the Y-linked disease allele on a normal Y.
These three observations together rule out autosomal and X-linked patterns and support the scientists' conclusion that the retinitis pigmentosa in this family is Y-linked.
Key Takeaways
- Y-linked inheritance has a very simple, distinctive pattern: only males affected, and the trait passes exclusively from father to son.
- Pedigree analysis is about looking for patterns that fit (or rule out) a particular mode of inheritance.
- The mechanistic reason (only males have a Y chromosome) must be linked to the observed pedigree pattern, not just stated as a separate fact.
Common Mistakes
- Stating that the disease is 'more common in males' rather than 'only males are affected'.
- Confusing Y-linked with X-linked recessive — in X-linked recessive, females can be affected (rarely) and the disease is passed from carrier mother to son.
- Failing to mention the Y chromosome, and only describing the pedigree pattern without the mechanistic explanation.
- Saying the disease is 'inherited from the mother' — in Y-linkage the disease is never inherited from the mother.
Things to Be Careful About
- The mark scheme wants the mechanistic link (Y chromosome) as well as the observed pattern (only males affected).
- 'Males are XY' and 'females are XX' are precise descriptions; avoid the vaguer 'males have a Y' alone.
- The third mark is the hardest: it requires pointing to the father-to-son transmission pattern in the pedigree, not just restating that males are affected.
Incontinentia pigmenti is a disease that affects the skin, hair and central nervous system.
The disease is caused by a dominant allele on the X chromosome.
Construct a genetic diagram to determine the expected offspring for a healthy father and a heterozygous mother with incontinentia pigmenti.
State the expected phenotypic ratio of the offspring.
Use the symbols:
= allele for incontinentia pigmenti
= normal allele
offspring genotypes
offspring phenotypes
expected ratio = ______
Working
Parental genotypes:
Gametes: , and ,
Punnett square
Offspring (genotype → phenotype):
- → Affected female
- → Healthy female
- → Affected male
- → Healthy male
Answer
Expected phenotypic ratio = 1 : 1 : 1 : 1 (affected female : healthy female : affected male : healthy male)
1 : 1 : 1 : 1
Background Concept
Sex-linked inheritance concerns genes carried on the sex chromosomes. In humans, females are XX and males are XY. A gene on the X chromosome therefore appears in two copies in females (who can be homozygous or heterozygous) and in one copy in males (who are hemizygous — they have no second copy of the gene on the Y chromosome).
Incontinentia pigmenti is X-linked dominant. The disease allele is dominant over the normal allele , so a single copy is enough to produce the disease in either sex. Heterozygous females (carriers) are affected, as are all males who inherit the disease allele (because they have no second X to mask it).
Understanding the Question
The question gives a specific cross: a healthy father and a heterozygous mother, with the symbols pre-defined. The candidate is asked to 'construct a genetic diagram' (i.e. a Punnett square) and to state the phenotypic ratio. The four marks are awarded for: parental genotypes + gametes, the four correct offspring genotypes, the phenotypes linked to genotypes, and the 1:1:1:1 ratio.
Approach
A Punnett square is the standard tool for this kind of cross. The four steps are:
- Write the parental genotypes.
- List the possible gametes each parent can make (segregation of alleles into different gametes).
- Combine the gametes in a 2×2 grid.
- Read off each offspring's genotype, deduce its phenotype (using the dominance rule), and count the phenotypes to get the ratio.
Step-by-Step Reasoning
Step 1 — parental genotypes:
- Mother: heterozygous affected = . She must be heterozygous because the question says so, and because the disease is dominant — she would be only if she were homozygous, which the question rules out.
- Father: healthy male = . A healthy male carries the normal allele on his single X chromosome.
Step 2 — gametes:
The law of segregation says each parent passes one of their two alleles (or in the case of the father's Y, his Y chromosome) to each offspring, with equal probability.
- Mother: or (each ).
- Father: or (each ).
Step 3 — Punnett square:
Combine the gametes. With the mother's two eggs across the top of the grid and the father's two sperm down the side, the four offspring combinations are , , , .
Step 4 — phenotypes and ratio:
Apply the dominance rule (the disease allele is dominant, so any carrier is affected):
- (heterozygous female) → affected
- (homozygous normal female) → healthy
- (hemizygous male with disease allele) → affected
- (hemizygous normal male) → healthy
Each of the four categories occurs with probability , so the phenotypic ratio is 1 : 1 : 1 : 1.
Key Takeaways
- For an X-linked dominant cross between a heterozygous affected mother and a healthy father, the four expected offspring categories are equally likely.
- A Punnett square is the clearest way to lay out a genetic cross and is the layout the mark scheme credits.
- Always link genotype to phenotype by referring back to the dominance rule.
- Hemizygous males (X-linked genes) express whichever allele they inherit, because they have no second X to mask it.
Common Mistakes
- Writing the father as (affected) — he is healthy, so he carries .
- Forgetting that the mother is heterozygous, and treating her as homozygous .
- Stating the ratio as 1 : 1 (affected : healthy) or 3 : 1, ignoring that sex matters in the phenotype description.
- Not linking phenotypes to genotypes in the square.
- Using the wrong allele notation (e.g. separate and not attached to the X).
Things to Be Careful About
- Use the symbols exactly as the question gives them: and .
- The mark scheme gives one mark for the parental genotypes + gametes together, one for the four correct offspring genotypes, one for the phenotypes linked to the genotypes, and one for the 1 : 1 : 1 : 1 ratio.
- A Punnett square drawn in the answer should have the mother's gametes along the top and the father's gametes down the side, with the offspring genotypes in the four cells.
- The disease is dominant, so and are both affected, even though the female carries a normal allele as well.
Some diseases are caused by mutations in regulatory genes.
Suggest how a mutation in a regulatory gene that codes for a repressor protein could cause a disease.
Answer
Loss-of-function pathway
- The mutation means no functional repressor is produced / the repressor cannot bind to the operator, so the repressor–operator complex is never formed.
- The structural genes are therefore continuously transcribed / expressed / switched on.
- The structural-gene proteins / enzymes are over-produced, and these proteins / enzymes damage the cell / disrupt metabolism / cause the disease.
(Equivalently: an altered repressor that binds more tightly to the operator switches the structural genes off permanently; the resulting lack of the structural-gene proteins / enzymes then damages the cell / disrupts metabolism / causes the disease.)
See working
Background Concept
Gene expression is not left permanently on. Cells regulate which genes are transcribed and translated at any given moment, using regulatory genes that code for proteins (repressors or activators) which control the transcription of other genes (structural genes). The lac operon is the classic prokaryotic example: the lacI regulatory gene produces a repressor protein that binds to the operator and blocks transcription of the structural genes (lacZ, lacY, lacA) unless an inducer (lactose or allolactose) is present to release the repressor.
In a normal cell, the repressor therefore acts as a molecular switch: it keeps the structural genes 'off' by default, and the switch can be lifted by the inducer. If the regulatory gene is mutated, the repressor may be missing, non-functional, or altered in a way that changes how tightly it binds the operator. Either of these disturbances can lead to disease.
Understanding the Question
The question is a 'suggest' question: it asks the candidate to propose a plausible mechanism by which a mutation in a regulatory gene for a repressor could cause disease. There is no single right answer — the mark scheme gives two acceptable causal chains (loss-of-function and gain-of-function) and the candidate needs to lay out one of them clearly. Three marks are available for three well-linked statements.
Approach
Pick one of the two pathways and walk through it in three steps:
- The mutation alters the repressor (state how).
- The structural genes are no longer correctly regulated (state the new state: on, when they should be off, or vice versa).
- The resulting protein/enzyme imbalance damages the cell / disrupts metabolism / causes the disease.
The loss-of-function pathway is usually the easier one to explain.
Step-by-Step Reasoning
Pathway 1 — loss-of-function (repressor cannot switch genes off):
The mutation in the regulatory gene either prevents the repressor protein from being made at all, or produces a repressor that cannot bind the operator. Without a functional repressor sitting on the operator, RNA polymerase can transcribe the structural genes continuously, regardless of whether the cell actually needs the proteins. The structural-gene proteins (often enzymes) are over-produced, and at uncontrolled levels they catalyse reactions that damage the cell, disrupt normal metabolism or interfere with other pathways — producing the disease phenotype.
Pathway 2 — gain-of-function (repressor cannot be released):
Alternatively, the mutation may produce an altered repressor that binds more tightly to the operator, or that cannot be released by the normal inducer. The structural genes are then permanently switched off. The cell cannot make the proteins or enzymes the structural genes code for, and the absence of these essential molecules damages the cell, disrupts metabolism, or causes the disease.
Either pathway is acceptable; the key is to make the chain mutation → repressor → structural-gene expression → protein level → cellular damage explicit.
Key Takeaways
- Regulatory genes control the expression of structural genes via repressor or activator proteins.
- Both extremes of mis-regulation — structural genes permanently on, or permanently off — can cause disease.
- The operon model is transferable: a mutation in any regulatory gene can produce disease by disrupting the normal on/off switching of the genes it controls.
- The 'disease' step is usually cell damage or metabolic disruption, not a single named disease — the question wants the mechanism, not a diagnosis.
Common Mistakes
- Vague answers: 'the gene is mutated so the protein is wrong' — this says nothing about gene regulation.
- Describing the repressor as 'an enzyme' or 'a hormone' — it is a regulatory protein that binds DNA.
- Skipping the operator and structural genes and jumping straight to 'the cell is damaged'.
- Confusing the repressor with an activator — they have opposite effects on transcription.
- Describing the mutation as affecting a structural gene, not a regulatory gene.
Things to Be Careful About
- The question specifies a repressor protein, so the structural genes are off by default and switched on by an inducer. Do not describe an activator/inducible system by mistake.
- The mark scheme explicitly wants the words 'repressor', 'operator' and 'structural genes' — they are the technical terms that earn the marks.
- The mechanism must be linked to a disease outcome: cell damage, metabolic change or disease. Do not stop at the molecular description.
- Either pathway (over- or under-expression) earns full marks — choose the one you can write most clearly.
The genetics and evolution of the cat family, Felidae, have been studied by scientists.
The domestic cat, Felis catus, is a popular pet.
Fur length in F. catus is coded for by two alleles, and :
• the allele for short hair, , is dominant
• the allele for long hair, , is recessive.
The population of domestic cats in a city was studied:
• the population consisted of cats
• of these cats were long-haired.
Calculate the percentage of cats in the city that were heterozygous for hair length.
You should use the Hardy–Weinberg equations in your calculation.
Show your working.
answer = ______
No worked solution for this part yet — the official mark scheme is linked at the top of the page.
Give two reasons why the domestic cat population does not meet the conditions needed to apply the Hardy–Weinberg principle.
No worked solution for this part yet — the official mark scheme is linked at the top of the page.
Some domestic cats have no tails (tailless). The tailless phenotype in cats is genetically controlled.
Fig. 3.1 shows a tailless cat.
A small population of domestic cats, including some tailless cats, was introduced to an island called the Isle of Man in the 1700s.
After several generations, without artificial selection from humans, a high proportion of the cat population was tailless.
Suggest why the tailless phenotype became common in the small cat population on the Isle of Man.
No worked solution for this part yet — the official mark scheme is linked at the top of the page.
Cheetahs, Acinonyx jubatus, are predatory mammals. They have evolved black spots on their fur, which provide camouflage in their habitats.
Describe how the spotted fur phenotype of A. jubatus may have evolved through natural selection from a non-spotted ancestor.
No worked solution for this part yet — the official mark scheme is linked at the top of the page.
Organisms are classified in three domains. The domain Eukarya is divided into four kingdoms.
The four eukaryotic kingdoms are listed in Table 4.1.
Complete Table 4.1 by writing ‘yes’ or ‘no’ to produce a summary of some of the main features of each kingdom.
Table 4.1
| kingdom | species may be unicellular | species may have cell walls | species may show autotrophic nutrition |
|---|---|---|---|
| Animalia | no | ||
| Fungi | no | ||
| Plantae | yes | ||
| Protoctista |
Answer
| kingdom | species may be unicellular | species may have cell walls | species may show autotrophic nutrition |
|---|---|---|---|
| Animalia | no | no | no |
| Fungi | yes | yes | no |
| Plantae | no | yes | yes |
| Protoctista | yes | yes | yes |
See table.
Background Concept
The four eukaryotic kingdoms — Animalia, Fungi, Plantae and Protoctista — are distinguished by a small set of structural and nutritional features. Three of the most useful are:
- Unicellularity — whether members of the kingdom can exist as single cells. Animals and plants are essentially always multicellular, but fungi (e.g. Saccharomyces, yeast) and many protoctists (e.g. Amoeba, Paramecium, Chlorella) can be unicellular.
- Cell walls — a rigid polysaccharide-containing layer outside the cell membrane. Animal cells never have walls. Fungi have walls of chitin, plants of cellulose, and many protoctists (the algal protoctists) have cellulose walls, although some protoctist groups do not.
- Mode of nutrition — autotrophs (mainly plants and algal protoctists) make their own organic molecules by photosynthesis; fungi and animals are heterotrophs, obtaining organic carbon from other organisms (fungi by absorption of soluble products of extracellular digestion, animals by ingestion).
Understanding the Question
The stem supplies a partly completed table and the command word is essentially "complete". The three columns ask whether the organisms in each kingdom may be unicellular, may have cell walls, and may show autotrophic nutrition. The word "may" is important: a "yes" is required wherever at least some members of the kingdom possess the feature, not just the most familiar members.
Two entries are pre-filled in the mark scheme and act as guides: Animalia already has "no" for unicellular, and Fungi already has "no" for autotrophic. The remaining blanks are to be completed.
Approach
For each blank, decide whether any member of that kingdom shows the feature, and answer "yes" if so, "no" if not. Work column by column:
- Unicellular: animals (no) and land plants (no) are always multicellular, so "no"; fungi and protoctists include single-celled forms, so "yes".
- Cell walls: animal cells never have a wall ("no"); the other three kingdoms all have walled members ("yes").
- Autotrophic nutrition: animals and fungi are heterotrophs ("no"); plants photosynthesise ("yes"); many protoctists (algae, Euglena) photosynthesise ("yes").
Step-by-Step Reasoning
- Animalia — already has "no" for unicellular. Animals have no cell wall (only a cell surface membrane) and obtain food by ingestion, so cell walls = no and autotrophic nutrition = no.
- Fungi — already has "no" for autotrophic nutrition. Fungi such as yeasts are unicellular, so unicellular = yes. Fungal cell walls are made of chitin, so cell walls = yes.
- Plantae — already has "yes" for cell walls (cellulose). Land plants are always multicellular, so unicellular = no. Plants photosynthesise using chlorophyll, so autotrophic = yes.
- Protoctista — this is the "catch-all" kingdom for eukaryotes that are not animals, plants or fungi. It includes single-celled organisms (Amoeba), so unicellular = yes. Many are algae with cellulose cell walls, so cell walls = yes. Many protoctists photosynthesise (e.g. Chlorella, Euglena), so autotrophic = yes.
Key Takeaways
- The word "may" in the question is the key: a single counter-example in the kingdom is enough to make the answer "yes".
- Animal cells never have cell walls and animals never photosynthesise, so Animalia is uniformly "no".
- Fungi are heterotrophs but have chitin walls and include unicellular forms (yeasts).
- Plants are multicellular, have cellulose walls and photosynthesise.
- Protoctista is the most varied of the four kingdoms and is "yes" across the board.
Common Mistakes
- Writing "no" for unicellular in Fungi because the most familiar fungi (mushrooms, moulds) are multicellular — forgetting yeasts.
- Writing "yes" for autotrophic in Fungi because some fungi live in mutualistic associations with photosynthetic algae (lichens) — the fungus itself is still heterotrophic.
- Writing "no" for cell walls in Protoctista because animal-like protoctists (Amoeba) have no wall — but plant-like protoctists (algae) do.
Things to Be Careful About
- The mark scheme awards one mark per correct row (i.e. all three answers in a row must be right to score the mark for that row), so it is not enough to get two of three in a row correct.
- "No" in the table must be read as a deliberate, justified answer; do not leave any cell blank.
Meiosis occurs in the kingdom Plantae.
Fig. 4.1 shows drawings of photomicrographs of three stages of meiosis in the lily plant, Lilium grandiflorum. Individual chromosomes and their structure cannot be seen clearly.
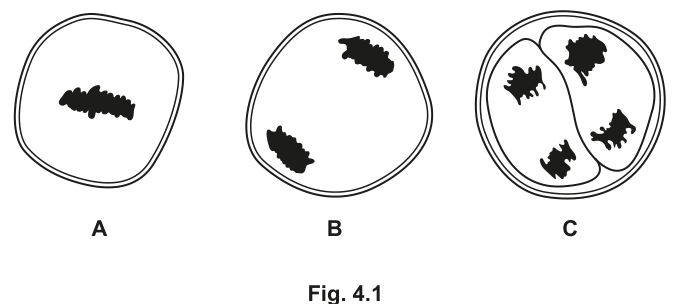
Identify the three stages of meiosis shown in Fig. 4.1.
A ______
B ______
C ______
Answer
A = metaphase I
B = telophase I (anaphase I also accepted)
C = anaphase II (telophase II also accepted)
A = metaphase I; B = telophase I; C = anaphase II.
Background Concept
Meiosis is a reduction division that produces four genetically non-identical haploid cells from one diploid cell. It consists of two divisions:
- Meiosis I — separates homologous chromosomes (the bivalents formed after crossing over). The stages are prophase I, metaphase I, anaphase I, telophase I.
- Meiosis II — separates sister chromatids of each chromosome, much like a mitotic division. The stages are prophase II, metaphase II, anaphase II, telophase II.
The key feature that distinguishes meiosis I from meiosis II at the same-named stage is what is being separated: in anaphase/telophase I, whole chromosomes (still each consisting of two sister chromatids) move apart; in anaphase/telophase II, the chromatids of each chromosome separate.
Understanding the Question
The question shows three drawings of lily pollen mother cells at different stages of meiosis. Because the drawings do not show individual chromosomes clearly, identification must be based on the arrangement and number of chromosome masses in the cell:
- A: a single cluster of chromosomes on the equator of the cell, midway between the poles.
- B: two clusters of chromosomes inside the cell — one towards each pole.
- C: four clusters of chromosomes, all inside the same parent cell (the cell has not yet divided into four daughter cells).
Approach
Identify the most diagnostic feature of each drawing and match it to the corresponding meiotic stage:
- Chromosomes lined up at the equator → a metaphase stage.
- In meiosis I (metaphase I) homologous pairs (bivalents) line up together on the equator. The drawing shows one line of chromosomes, consistent with metaphase I.
- If it were metaphase II, the chromosomes would be lined up singly (sister chromatids) — the drawing is too compact to be that, and the pairing configuration is more typical of metaphase I.
- Two clusters of chromosomes, one at each pole → meiosis I is finishing.
- The clusters in B are still close to the equator (they are "moving towards opposite poles"), so this is consistent with telophase I / late anaphase I — the mark scheme accepts either.
- Four clusters in one cell → the second meiotic division is in progress.
- After telophase I, the cell usually divides (cytokinesis) to give two cells, each of which then enters meiosis II. If four clusters are present within the same parent cell boundary, sister chromatids have separated and are moving to opposite poles of what is effectively a meiosis-II spindle. This is anaphase II / telophase II — the mark scheme accepts either.
Step-by-Step Reasoning
- A = metaphase I. A single line of chromosomes (bivalents) is held on the equator of the spindle by spindle fibres attached to the centromeres. The chromosomes are paired, which is the hallmark of metaphase I (homologous pairs line up together, not single-file as in mitosis or metaphase II).
- B = telophase I (or anaphase I). Two chromosome masses lie towards opposite poles of the same cell. Each mass contains whole chromosomes (still each composed of two sister chromatids), so this is the end of meiosis I. The mark scheme accepts either "anaphase I" (chromosomes still moving) or "telophase I" (chromosomes have reached the poles but cytokinesis has not occurred).
- C = anaphase II (or telophase II). Four chromosome masses are visible within a single cell. Sister chromatids have separated and are being pulled to opposite poles, so this is meiosis II at the anaphase/telophase stage. Cytokinesis has not yet produced four separate daughter cells.
Key Takeaways
- One line at the equator = metaphase; two masses = end of meiosis I; four masses in one cell = meiosis II anaphase/telophase.
- Meiosis I separates homologous chromosomes; meiosis II separates sister chromatids.
- The number of chromosome masses in the cell is the most reliable diagnostic when the individual chromosomes are not clearly visible.
Common Mistakes
- Calling A "metaphase" without specifying metaphase I (the question awards the mark only for the full stage name, including the division number).
- Calling C "anaphase" or "telophase" without specifying the second division.
- Confusing telophase I with anaphase I — the mark scheme allows either, but a candidate who reasons about whether the chromosomes have reached the poles or are still moving will not be marked down.
- Reading C as four separate cells rather than four chromosome masses within one cell, leading to "four daughter cells" / "end of meiosis" answers.
Things to Be Careful About
- The mark scheme awards the named stage only; "metaphase" alone, "anaphase" alone or "telophase" alone would not score because the division number is missing.
- For B, "anaphase I" is credited as an alternative; for C, "telophase II" is credited as an alternative. Either wording is acceptable.
The organisms in the other domains are prokaryotes.
Name the two domains containing prokaryotic organisms and describe differences between these two domains.
Answer
-
The two domains are Bacteria and Archaea.
-
Differences (any two):
- Cell wall: Bacteria have peptidoglycan in their cell walls; Archaea do not have peptidoglycan.
- Cell membrane lipids: Bacterial membrane lipids are ester-linked with unbranched hydrocarbon chains; archaeal membrane lipids are ether-linked with branched hydrocarbon chains.
- Spores: Bacteria can form spores; Archaea do not form spores.
- DNA-associated proteins: Bacterial DNA has no histones; archaeal DNA has histones associated with it.
- rRNA / ribosomes: the ribosomal RNA base sequences and ribosome structure differ between the two domains.
Bacteria and Archaea; any two of the differences listed above.
Background Concept
The three-domain system (proposed by Carl Woese in the 1970s from rRNA sequence comparisons) divides all living organisms into Bacteria, Archaea and Eukarya. Bacteria and Archaea are both prokaryotes — their cells have no membrane-bound nucleus and no membrane-bound organelles — but they are biochemically so different that they are placed in separate domains. The differences are most striking in the chemistry of the cell envelope and in the molecular machinery of information processing (DNA, RNA, ribosomes).
Understanding the Question
The stem states that the other two domains are prokaryotic, then asks for the names of the two domains and for differences between them. The marks are split 1 + 2 — one mark for naming both domains and two further marks for two distinct differences.
Approach
- First, write down both domain names to be sure of scoring the first mark.
- Then recall the standard list of distinguishing features between Bacteria and Archaea (cell wall, membrane lipids, DNA-associated proteins, rRNA, spore formation) and pick any two that you can state clearly. The mark scheme accepts any two from that list.
Step-by-Step Reasoning
-
The two domains containing prokaryotes are Bacteria and Archaea. (Note: the third domain, Eukarya, contains all eukaryotes and is the topic of the rest of the question.)
-
Distinguishing features — pick any two:
- Peptidoglycan in the cell wall. Bacterial cell walls contain peptidoglycan (a polymer of sugars and amino acids); archaeal cell walls do not.
- Membrane lipid chemistry. Bacterial plasma-membrane lipids have ester linkages and unbranched hydrocarbon chains; archaeal plasma-membrane lipids have ether linkages and branched isoprenoid chains.
- Histones. Bacterial DNA is not associated with histones; archaeal DNA is wrapped around histone proteins, similar to eukaryotes.
- Spores. Many bacteria form resistant endospores; archaea do not.
- rRNA and ribosome structure. The nucleotide sequences of the ribosomal RNA genes (especially 16S rRNA) and the detailed structure of the ribosomes are different in the two domains — this is in fact the original molecular evidence for splitting the prokaryotes into two domains.
-
State each difference in one clear sentence, naming the feature in Bacteria and the contrasting feature in Archaea.
Key Takeaways
- The three-domain system groups all life into Bacteria, Archaea and Eukarya.
- Although both Bacteria and Archaea are prokaryotes, they differ in many fundamental molecular features, particularly the chemistry of the cell wall, the plasma-membrane lipids and the DNA-associated proteins.
- Archaea share some features with eukaryotes (e.g. histones, ether-linked lipids) but are not eukaryotes — they still have no nucleus.
Common Mistakes
- Writing only one domain name (e.g. "Bacteria"), forgetting Archaea. The first mark is for naming both domains.
- Giving a difference that is actually true of all prokaryotes versus eukaryotes (e.g. "prokaryotes have no nucleus"). This does not distinguish between Bacteria and Archaea and so does not score.
- Mixing the direction of a difference (e.g. saying Archaea have peptidoglycan). The mark scheme is specific about which group has which feature.
Things to Be Careful About
- The question is capped at 3 marks in total: 1 for the two domain names and 2 for two differences. Listing more than two differences is fine, but it does not earn more marks.
- "Peptidoglycan in Bacteria vs not in Archaea" is the most commonly recalled distinction and is the safest single answer.
Viruses are not cellular organisms, but they are classified based on their characteristics.
Outline how viruses are classified.
Answer
Any two of:
- The type of nucleic acid they contain — DNA or RNA.
- Whether the nucleic acid is single-stranded or double-stranded.
- AVP — e.g. how mRNA is produced (RNA viruses may be sense/positive-sense or antisense/negative-sense); whether the virus is enveloped or non-enveloped; whether the genome is linear or circular; the diseases they cause; the shape of the capsid (e.g. helical, icosahedral).
Any two of: RNA or DNA; single-stranded or double-stranded; AVP.
Background Concept
Viruses are not made of cells — they consist of a nucleic acid genome (DNA or RNA) enclosed in a protein coat (capsid), sometimes surrounded by a lipid envelope. Because they have no cellular structure, they are not placed in any of the three domains of life. Instead they are classified on their own by the characteristics of their genome and structure.
The main features used in virus classification are:
- Type of nucleic acid — DNA or RNA.
- Strandedness — single-stranded (ss) or double-stranded (ds).
- Genome structure — linear or circular, in one piece or segmented.
- Capsid shape — e.g. helical, icosahedral, complex.
- Presence or absence of an envelope.
- Host range and diseases caused — e.g. influenza virus, tobacco mosaic virus, HIV.
- Mode of replication / how mRNA is produced (especially for RNA viruses).
Understanding the Question
This is an "outline" question worth 2 marks, asking the candidate to give any two features used in classifying viruses. The command word "outline" means give a brief, clear description of each point rather than a full discussion.
Approach
The mark scheme lists three possible points and accepts any two:
- Type of nucleic acid (DNA or RNA).
- Whether the genome is single-stranded or double-stranded.
- A valid additional point (AVP) — the mark scheme gives examples such as how mRNA is produced, enveloped vs non-enveloped, linear vs circular, diseases caused, capsid shape.
The safest two points are the type of nucleic acid and its strandedness, because these are the two most fundamental molecular criteria.
Step-by-Step Reasoning
- The most fundamental classification criterion is the type of nucleic acid that makes up the viral genome. Some viruses (e.g. herpesviruses, smallpox) have DNA; others (e.g. influenza, HIV, coronaviruses, tobacco mosaic virus) have RNA.
- The second most fundamental criterion is whether the nucleic acid is single-stranded (ss) or double-stranded (ds). For example, herpesvirus is dsDNA, parvovirus is ssDNA, influenza is ssRNA, and reovirus is dsRNA.
- Additional criteria that may be used (any one of these would count as the second mark if not already used) include: the shape of the capsid, the presence of an envelope, the structure of the genome (linear or circular, segmented or not), the diseases the virus causes and the host range, and for RNA viruses the way in which mRNA is produced (sense vs antisense, presence of reverse transcriptase, etc.).
Key Takeaways
- Viruses are not classified in the three domains because they are not cellular.
- The two most fundamental classification criteria are the type of nucleic acid (DNA or RNA) and its strandedness (single- or double-stranded).
- Other useful criteria include capsid shape, presence/absence of an envelope, genome structure, and the diseases the virus causes.
Common Mistakes
- Stating a feature that does not distinguish one virus from another (e.g. "viruses are small" or "viruses are not cells").
- Giving only one feature when two marks are available — the second mark is for a second, different point.
- Naming a specific virus without saying which feature is being used to classify it (e.g. "HIV" alone does not score; "RNA virus, e.g. HIV" does).
- Confusing RNA with mRNA — the genome of an RNA virus is the RNA molecule inside the capsid, not mRNA.
Things to Be Careful About
- The mark scheme allows any two reasonable, contrasting features. A clear one-line statement is enough for each mark — no lengthy discussion is required.
- AVP means "any valid point"; the mark scheme gives several examples, but the candidate is not restricted to those — anything biologically correct and used in real virus classification will be accepted.
Genetic engineering may often involve the transfer of a gene into an organism.
The polymerase chain reaction (PCR) can be used to produce many copies of a gene for transfer.
Describe and explain the steps involved in PCR.
Answer
- Denaturation at 90–98 °C — heat breaks the hydrogen bonds between the two (complementary) DNA strands, producing single strands.
- Annealing at 50–65 °C — primers anneal/bind to the single-stranded DNA by complementary base pairing, providing a binding site/starting point for Taq polymerase.
- Extension/elongation at 65–75 °C — Taq polymerase joins free nucleotides (dNTPs) to the single strands, synthesising a complementary new strand of DNA.
PCR involves denaturation (90–98 °C) to separate strands, annealing (50–65 °C) to bind primers, and extension/elongation (65–75 °C) by Taq polymerase to synthesise the new strand.
Background Concept
The polymerase chain reaction (PCR) is a method for amplifying (making many copies of) a specific DNA sequence in vitro. It is essential in genetic engineering because scientists often only have a tiny amount of a gene to work with — for example, a single copy cut from a genome — and they need millions of copies to manipulate, sequence, or transfer. PCR was developed by Kary Mullis in the 1980s and depends on the heat-stable DNA polymerase Taq polymerase, originally isolated from the thermophilic bacterium Thermus aquaticus (which lives in hot springs). The two key reagents beyond the template DNA are:
- Primers — short synthetic oligonucleotides (~18–25 bases) that are complementary to known sequences flanking the target region. They define the start/end of the region to be amplified and provide a free 3′-OH for the polymerase to extend from.
- dNTPs (deoxyribonucleoside triphosphates) — the building blocks of the new DNA strand.
The reaction is run in a thermocycler that rapidly changes the temperature of the reaction mixture through three set points. Each temperature change drives a specific molecular event.
Understanding the Question
The question asks for a description and explanation of the steps in PCR. The command words tell you that stating just the name of each step is not enough — for full marks you need both the action that occurs and the reason/result of that action. The question is worth 5 marks, so expect to cover three named stages, with the temperature of each, and the underlying molecular explanation.
Approach
Organise the answer around the three temperature stages: denaturation → annealing → extension. For each stage, state (i) the temperature, (ii) what physically happens, and (iii) why it matters. Keep the three steps in the order they are performed in a cycle, and remember the process is cyclical — the products of one cycle serve as templates for the next, leading to exponential amplification (2ⁿ copies after n cycles).
Step-by-Step Reasoning
-
Denaturation (90–98 °C). The high temperature supplies enough thermal energy to disrupt the hydrogen bonds holding the two complementary strands of the double helix together (it does not break the covalent sugar–phosphate backbone). The result is two single strands, each of which can act as a template in the next step. (Mark: denaturation at 90–98 °C; breaks hydrogen bonds to produce single strands.)
-
Annealing (50–65 °C). The temperature is lowered to allow short primers to hydrogen-bond to their complementary sequences on each single-stranded template. The exact temperature depends on the primer length and GC content, but is set high enough to allow specific binding (not random matches). Primers anneal in opposite orientations on the two strands so that extension will proceed towards each other, defining the region to be amplified. (Mark: annealing at 50–65 °C; primers anneal/bind by complementary base pairing; provides a binding site/starting point for Taq polymerase.)
-
Extension/elongation (65–75 °C). The temperature is raised to the optimum for Taq polymerase (around 72 °C), which is heat-stable and remains active despite the denaturation step in each cycle. Taq polymerase adds free dNTPs to the free 3′-OH of each primer, synthesising a new strand complementary to the template. After sufficient time, the entire target region between the primers has been copied. (Mark: extension at 65–75 °C; Taq polymerase joins (free) nucleotides to single strands / synthesises the complementary new strand.)
The cycle is then repeated — typically 25–35 times — and at each cycle the number of target DNA molecules roughly doubles.
Key Takeaways
- PCR has three temperature-driven stages: denaturation, annealing, extension.
- The high temperatures used in denaturation would denature most polymerases; Taq polymerase is heat-stable and so can be reused across cycles.
- Primers are essential — they are not part of the original DNA and they define the boundaries of the region amplified.
- The number of copies after n cycles is approximately 2ⁿ (exponential amplification).
Common Mistakes
- Writing the wrong temperature range for any stage (e.g. putting denaturation at 50–65 °C, the primer-annealing temperature).
- Saying that heat breaks the DNA rather than specifying that it breaks the hydrogen bonds between strands (and leaves the sugar–phosphate backbone intact).
- Saying that DNA polymerase (without naming Taq) is used. The mark scheme credits Taq polymerase because it is heat-stable; ordinary DNA polymerase would be destroyed during the denaturation step.
- Confusing the role of primers with that of the polymerase. Primers bind the template and provide a starting point; the polymerase extends from the primer.
- Forgetting that the process is cyclical — describing a single pass through the three stages and not mentioning that the products become templates for the next cycle.
Things to Be Careful About
- Use the precise terms denaturation, annealing, extension (or elongation) — do not paraphrase them as "heating, cooling, building".
- Always pair the temperature with the name of the stage, in the order 90–98 °C → 50–65 °C → 65–75 °C.
- Distinguish annealing of primers (binding) from extension (synthesis of new DNA).
- The mark scheme is tolerant of temperatures within the stated ranges — there is no need to memorise a single value, only the range.
Some species of Anopheles mosquitoes, such as Anopheles stephensi, transmit malaria. Scientists have created genetically engineered A. stephensi mosquitoes in an attempt to reduce the spread of malaria.
A gene called tTav was constructed by scientists and transferred into the eggs of A. stephensi.
• tTav consists of DNA sequences from a bacterium, Escherichia coli, and herpes simplex virus, which is a DNA virus.
• The gene codes for tTav protein, which stops the expression of genes that are essential to mosquito development.
• Genetically engineered A. stephensi do not survive beyond the larval stage and therefore do not develop into adults.
• A chemical called tetracycline can stop the action of the tTav protein.
Male genetically engineered A. stephensi were released into the wild to breed with females. Their offspring had the tTav gene.
Describe how the tTav gene could have been synthesised and transferred into the eggs of A. stephensi.
Answer
- The DNA sequences (from E. coli and herpes simplex virus) were extracted/isolated and cut using restriction enzymes (or made from mRNA using reverse transcriptase, or synthesised from free nucleotides).
- DNA ligase was used to join the two DNA sequences together to form the recombinant tTav gene.
- A promoter was added so the gene can be transcribed.
- The recombinant tTav gene was inserted into a vector (e.g. a virus or liposome).
- The egg of A. stephensi was infected with the virus (or the gene was introduced by (micro)injection into the egg / by a gene gun), so the tTav gene was inserted into the A. stephensi genome.
The two DNA sequences were cut/isolated, joined with DNA ligase (plus a promoter) into a vector, and the vector was used to infect the egg (or microinjection was used) so the tTav gene integrated into the A. stephensi genome.
Background Concept
Genetic engineering moves a gene (or a constructed piece of DNA) from one organism into another. To do this, scientists need:
- A source of the DNA sequence to be transferred — this can be cut directly from a donor genome, copied from mRNA using reverse transcriptase, or chemically synthesised from nucleotides.
- Restriction enzymes that cut DNA at specific sequences, leaving predictable ends (blunt or sticky) so that fragments can be recombined.
- DNA ligase to seal the sugar–phosphate backbone between joined fragments, producing a stable recombinant DNA molecule.
- A promoter so the host's RNA polymerase will transcribe the inserted gene. Without a promoter, a gene in a eukaryotic genome will not be expressed.
- A vector to carry the recombinant DNA into the recipient cell. Common vectors include plasmids, viruses, and liposomes; for animal cells, viruses and liposomes are widely used because they cross the cell membrane efficiently.
- A way to deliver the vector into the recipient cell — viral infection, microinjection, or a gene gun are the standard methods for animal embryos.
The recipient in this question is the egg of A. stephensi, a mosquito. Insect transgenesis is most commonly done by microinjection of DNA into very early embryos, although viral vectors are also used.
Understanding the Question
The stem explains that tTav is made of DNA from E. coli (a bacterium) and herpes simplex virus (a DNA virus). You are asked to describe how this gene was synthesised (built) and transferred into mosquito eggs. The mark scheme rewards the steps in a logical order: obtain the DNA, join it, add a promoter, package it in a vector, deliver it, and integrate it. There are 4 marks, so you need four creditable points from the six available in the mark scheme.
Approach
Think of the process as three blocks: (1) build the gene, (2) package it for delivery, (3) get it into the egg and integrate it. Aim to give one mark-worthy point per logical step, in the same order as the mark scheme.
Step-by-Step Reasoning
-
Obtain the source DNA. The two required sequences — one from E. coli, one from herpes simplex virus — must be acquired. The mark scheme credits either cutting them out with restriction enzymes, making cDNA copies from their mRNAs using reverse transcriptase, or synthesising them from nucleotides. Any one of these is sufficient to earn the first mark.
-
Join the two sequences. Once both DNA pieces are available, DNA ligase seals the sugar–phosphate backbone between them, producing a single recombinant piece of DNA that contains both source sequences. This earns the second mark.
-
Add a promoter. A tTav gene inside an animal cell will not be transcribed unless a promoter is present. The promoter is added to the construct so that the host's RNA polymerase can bind and initiate transcription. (This is the third mark in the scheme.)
-
Insert into a vector. The recombinant DNA is placed inside a delivery vehicle — a virus (e.g. a disabled herpes-virus-derived vector or another suitable viral vector), a liposome, or a plasmid. Viruses are particularly effective at entering animal cells. This is the fourth mark.
-
Deliver the vector into the egg. A. stephensi eggs are eukaryotic embryos, so the vector must cross the cell membrane. Acceptable methods named in the mark scheme are viral infection of the egg or (micro)injection of the construct directly into the egg. A gene gun/DNA gun is also credited. Once inside, the vector releases the recombinant DNA.
-
Integration into the genome. The viral vector (or the construct on its own, after microinjection) integrates the tTav gene into the A. stephensi genome, so it is stably inherited by the offspring (which is exactly what the stem states: "their offspring had the tTav gene"). This is the sixth mark in the scheme.
The mark scheme is offering any 4 of these 6 points; a complete, logical answer would normally touch on the construction (points 1–3), the delivery (point 4), the entry method (point 5), and the integration (point 6). Aim to write all six to be safe in a real exam.
Key Takeaways
- Building a recombinant gene involves restriction enzymes (or reverse transcriptase / nucleotide synthesis), DNA ligase and a promoter.
- A vector (virus, liposome, plasmid) is required to deliver DNA into a recipient cell.
- For animal embryos, DNA is typically delivered by viral infection or microinjection, and a gene gun is an accepted alternative.
- Stable inheritance requires the gene to be integrated into the host genome.
Common Mistakes
- Skipping the promoter — many students forget that, in a eukaryotic cell, a gene without a promoter will not be transcribed.
- Saying "the gene was put into a plasmid" without recognising that plasmids are normally used for bacteria, not animal cells. For mosquito eggs, a viral vector or liposome is more appropriate. (Microinjection bypasses a vector altogether.)
- Describing viral infection as the method of transfer but forgetting to state that the virus then inserts the gene into the genome — these are two separate marks.
- Confusing the order: joining the DNA must come before putting it into a vector.
- Using vague verbs such as "inserted" or "added" without naming the enzymes (restriction enzymes, ligase) and the promoter.
Things to Be Careful About
- Name the donor organisms (E. coli and herpes simplex virus) at least once — the mark scheme states that this is required throughout.
- Use precise terms: restriction enzyme, DNA ligase, promoter, vector, microinjection, gene gun.
- Microinjection is the technique used for Drosophila (the classic insect model) and is the standard answer for mosquito transgenesis.
- The E. coli sequence and the herpes simplex virus sequence are joined to form a single recombinant gene; do not describe them as two separate transferred genes.
Answer
The tTav protein prevents the transcription factor from functioning/binding to the promoter, so RNA polymerase cannot bind to the DNA and the gene is not transcribed.
The tTav protein prevents transcription factors from binding to the promoter (so RNA polymerase cannot bind and the gene is not transcribed).
Background Concept
For a gene to be expressed, RNA polymerase must bind to the gene's promoter and initiate transcription. In eukaryotes, RNA polymerase on its own cannot recognise the promoter — it must first be brought there by transcription factors (proteins that bind specific DNA sequences near the promoter). If a transcription factor is prevented from binding, the polymerase cannot be recruited, and the gene is not transcribed. This is one of the central control points of eukaryotic gene expression.
The tTav gene is described in the stem as coding for a protein that stops the expression of genes that are essential to mosquito development. Genes that are essential to development are typically active in the developing larva; their products are needed for the larva to mature into an adult. The tTav protein must therefore act by interfering with the normal transcription of those essential genes.
Understanding the Question
The question is a single-mark "suggest" item: it asks you to propose how tTav protein could prevent the expression of other genes. The command word "suggest" means you are not required to know the exact mechanism from memory — you can apply general knowledge of gene expression to the situation described. The two creditable answers in the mark scheme are:
- The tTav protein prevents transcription factors from functioning/binding to the promoter.
- The tTav protein stops RNA polymerase from binding to the DNA/promoter.
The mark scheme explicitly rejects mention of a repressor protein/operator — that is the prokaryotic (lac-operon) mechanism and is not credited here.
Approach
Think of the standard eukaryotic transcription initiation pathway (transcription factors bind → recruit RNA polymerase → transcription begins) and ask which step the tTav protein might disrupt. Either blocking the transcription factor or blocking RNA polymerase itself would prevent the gene from being expressed.
Step-by-Step Reasoning
- Transcription factors are proteins that bind to a gene's promoter (or to enhancer regions) and position RNA polymerase II at the transcription start site. Without them, RNA polymerase cannot bind effectively.
- If the tTav protein binds to a transcription factor and inactivates it, or binds to the promoter in place of the transcription factor, the transcription factor cannot perform its role.
- Consequently, RNA polymerase is not recruited to the promoter, transcription does not begin, and the downstream essential gene is not expressed.
- The larva is therefore missing proteins it needs to develop beyond the larval stage, which is why genetically engineered A. stephensi die as larvae.
Key Takeaways
- Eukaryotic gene expression is controlled at the level of transcription by transcription factors and RNA polymerase binding.
- Interfering with either of these binding events is sufficient to prevent transcription of a gene.
- A protein that prevents gene expression is acting as a regulatory protein; the mark scheme explicitly rejects a repressor/operator model because that is prokaryotic.
Common Mistakes
- Saying the tTav protein "binds to the operator and acts as a repressor". The operator/repressor system is from the lac operon in E. coli; the mark scheme rejects this wording because A. stephensi is a eukaryote and has no operator in the prokaryotic sense.
- Saying the tTav protein "binds to the gene and prevents translation". The question is about expression of the gene — the mark scheme credits events at transcription, not translation.
- Being too vague: "it stops the gene from working" or "it silences the gene" — these do not name a molecular mechanism and will not earn the mark.
Things to Be Careful About
- Use the precise term transcription factor, not "regulatory protein" or "activator".
- If you choose the second credit-worthy answer, name RNA polymerase explicitly.
- Stay at the level of transcription — do not drift into translation or post-translational effects, which the mark scheme does not credit.
Genetically engineered A. stephensi larvae were exposed to tetracycline in the laboratory.
Suggest why A. stephensi larvae were exposed to tetracycline in the laboratory.
Answer
Tetracycline stops the action of the tTav protein, so the larvae survive and develop into adults (rather than dying at the larval stage). This allows the genetically engineered males to be reared in the laboratory for release into the wild.
So that the genetically engineered larvae develop into adults / survive beyond the larval stage (because tetracycline stops the tTav protein), allowing them to be reared for release.
Background Concept
The tTav system is an example of a repressible lethal transgene: the tTav protein is lethal to the mosquito unless its action is blocked. The stem tells us that tetracycline stops the action of the tTav protein. This is a classic "on/off switch" design: the tTav protein functions only when tetracycline is absent, so the mosquitoes die in the wild (where there is no tetracycline) but can be reared in the laboratory (where tetracycline is added to their food/water). The tetracycline therefore acts as the molecular off-switch for the lethal gene.
The biological purpose of the modification, set out in the stem, is that male genetically engineered A. stephensi are released into the wild, where they mate with wild females. Their offspring inherit the tTav gene and die as larvae, so the next generation of adults — and therefore the next generation of mosquitoes that can transmit malaria — is reduced.
Understanding the Question
The question is a single-mark "suggest" item: it asks you to work out why tetracycline is being used in the laboratory on the genetically engineered larvae. The mark scheme answer is short: the tetracycline is used so that the larvae develop into adults / survive beyond the larval stage. The logic is that you cannot release males into the wild unless they have first been grown to adulthood in the laboratory — and they will only reach adulthood if the tTav protein is disabled. Tetracycline does exactly that.
Approach
Connect three pieces of information from the stem:
- The tTav protein kills the larvae (they "do not survive beyond the larval stage").
- Tetracycline stops the action of the tTav protein.
- Male A. stephensi are released into the wild to breed.
Therefore, the only reason to expose the larvae to tetracycline in the laboratory is to let them survive to adulthood so they can be used in the release programme.
Step-by-Step Reasoning
- Without tetracycline, the tTav protein would be active and the larvae would die — none would reach adulthood.
- With tetracycline added to their rearing medium, the tTav protein is inhibited, so the larvae complete development and emerge as adults.
- The adults can then be sexed, and the males selected for release into the wild to mate with wild females (their offspring inherit the tTav gene and die as larvae, reducing the wild population).
- Without the tetracycline step, there would be no adults to release, and the whole intervention would fail. The laboratory exposure to tetracycline is therefore the prerequisite for the release programme.
Key Takeaways
- A repressible lethal transgene requires an external "off-switch" (here, tetracycline) to allow the organism to be reared.
- The point of the laboratory tetracycline step is to produce adult males for release; in the wild, where there is no tetracycline, the tTav gene kills the offspring as larvae.
- This is the principle behind several genetic biocontrol strategies: the modified animals can only be produced in controlled conditions, but the lethal effect is expressed in the wild.
Common Mistakes
- Saying the tetracycline "kills the bacteria" or "stops infection". Tetracycline is an antibiotic, but the stem makes clear that here it is being used to stop the action of the tTav protein, not as an antimicrobial.
- Saying the purpose is "to test whether tetracycline is safe". The question is not a safety test; it is a necessary part of the rearing protocol.
- Saying the tetracycline is added "so the tTav gene is not expressed". The mark scheme wording is more direct: so the larvae develop into adults.
Things to Be Careful About
- Read the stem carefully: it says "a chemical called tetracycline can stop the action of the tTav protein". This is the precise wording to use in your reasoning.
- The mark scheme's credited answer is about the outcome (development to adulthood), not the molecular mechanism (inhibition of tTav protein). Either is acceptable reasoning, but the credit-bearing statement is the outcome.
- Do not confuse this with selection for tetracycline resistance — that is a different use of tetracycline in microbiology.
Ensatina eschscholtzii is a species of salamander that lives in woodland ecosystems in California, USA.
Fig. 6.1 shows an ensatina salamander.
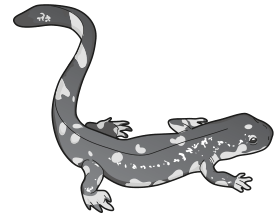
Answer
An ecosystem is a self-contained (functional) unit consisting of a community of all the populations of different species (biotic factors) interacting with each other and with the non-living (abiotic) environment, linked by energy flow and the cycling of nutrients (mineral cycling).
An ecosystem is a self-contained functional unit of a community of organisms interacting with each other and with their abiotic environment, linked by energy flow and nutrient cycling.
Background Concept
An ecosystem is one of the most fundamental units in ecology. It is more than just a list of organisms in a place — it is a system in the truest sense, with inputs, outputs, and internal transfers of energy and matter. The CIE definition deliberately combines four elements: a defined spatial unit, the community of living organisms, the non-living environment, and the way the two are tied together by flows of energy and matter.
The biotic component is the community — every population of every species that lives in the area, from the dominant trees down to bacteria in the soil. The abiotic component includes the non-living physical and chemical features: light, temperature, water, pH, mineral nutrients, and substrate. Neither component makes sense without the other: organisms depend on abiotic resources and modify them, and abiotic conditions determine which organisms can survive.
Finally, ecosystems are open systems connected by the flow of energy (entering as light, leaving largely as heat, with energy passing along food chains) and the cycling of nutrients (carbon, nitrogen, phosphorus etc. move between organisms and the abiotic environment in biogeochemical cycles).
Understanding the Question
The command word is define, which at A level expects a precise, complete statement that includes all the technical components the syllabus credits. The question sits in Ensatina eschscholtzii's woodland ecosystem in California, but that context is not needed for the definition — the question simply asks you to state what an ecosystem is.
The mark scheme offers five possible creditable points and the candidate must give three of them to earn full marks. The strongest answers are those that read as a single coherent definition rather than three disconnected sentences.
Approach
Combine as many of the five mark-scheme components as possible into a flowing definition. A good strategy is to begin with what an ecosystem is (a unit), then state what it contains (community + abiotic environment + interactions), and finish with how it is integrated (energy flow + nutrient cycling).
Step-by-Step Reasoning
The mark scheme credits any three of the following:
- Self-contained / functional / specific unit — a definable spatial area.
- Community / all populations / all species — every living organism present.
- Interactions — between organisms, and between organisms and the abiotic environment.
- Abiotic and biotic factors / environment — both are required.
- Linked by energy flow and mineral/nutrient cycling (or food webs/ chains).
A complete answer embeds at least three of these, e.g. "A self-contained functional unit of a community of all populations interacting with one another and with the abiotic environment, linked by energy flow and the cycling of nutrients." This single sentence earns all three marks.
Key Takeaways
- An ecosystem is both biotic and abiotic, with interactions between them.
- It is held together by energy flow (one-way) and nutrient cycling (cyclical).
- The term self-contained or functional unit is the precise way to describe its spatial/organisational nature at A level.
Common Mistakes
- Giving only "a community of organisms and their environment" — this omits the explicit link through energy flow and nutrient cycling.
- Mentioning only the biotic component and forgetting the abiotic (or vice versa).
- Using vague terms such as "things in an area" or "animals and plants living together" — these are not the technical terms the syllabus rewards.
- Confusing ecosystem with population (one species) or community (all species, but excluding abiotic factors).
Things to Be Careful About
- The word community by itself means all populations in an area; an ecosystem = community + abiotic environment + their interactions and flows.
- The mark scheme specifically credits the link by energy flow and nutrient cycling (or equivalents such as food webs, food chains, mineral cycling); do not omit this integration element.
- Avoid colloquial substitutes; precise terminology is what earns marks here.
The term species can be defined using different concepts, including the biological species concept and the morphological species concept.
The morphological species concept is based on appearance or observable characteristics.
Describe what is meant by the biological species concept.
Answer
The biological species concept defines a species as a group of organisms that can interbreed with one another to produce fertile offspring.
A species is a group of organisms that can interbreed to produce fertile offspring.
Background Concept
There is no single, universally agreed way of defining a species, because what looks like a sensible boundary in one group of organisms (e.g. birds, where appearance and song reliably indicate reproductive isolation) breaks down in another (e.g. bacteria, which reproduce asexually and routinely exchange genes). Biologists therefore use several different species concepts depending on the organism and the question they are asking.
The three most commonly used are:
- Biological species concept (Mayr): a species is a group of actually or potentially interbreeding natural populations which are reproductively isolated from other such groups.
- Morphological species concept: a species is a group of organisms that look alike (share diagnostic structural features).
- Ecological species concept: a species is a group of organisms occupying a distinct ecological niche.
The biological concept is the most widely taught at A level, and the only one that depends on reproductive success rather than on appearance.
Understanding the Question
The question has just told you the morphological concept is based on appearance and observable characteristics. Part (b) asks you to do the equivalent for the biological concept — i.e. explain what feature it uses to decide whether two organisms are the same species. The mark is awarded for stating that it is the ability to interbreed and produce fertile offspring. One sentence is enough.
Approach
State the definition in full but as concisely as possible. The two essential components are: (i) interbreeding between individuals, and (ii) fertile offspring. Omitting fertile is a common and important error because hybrid animals (e.g. mules) can be produced but are sterile, and under the biological species concept the parents are still separate species.
Step-by-Step Reasoning
A complete answer reads: "A group of organisms that can interbreed to produce fertile offspring." The phrase fertile offspring is the mark-scheme keyword; the rest is framing. One mark, one sentence — anything more is wasted time on a 1-mark question.
Key Takeaways
- The biological species concept is built on reproductive isolation.
- The word fertile is non-negotiable: it distinguishes biological species from cases where two organisms merely produce offspring of any kind.
- This concept is hard to apply to asexual organisms, fossils, or geographically separated populations — which is why the Ensatina case in part (c) is so interesting.
Common Mistakes
- Saying "can interbreed to produce offspring" without specifying fertile — the mark scheme explicitly credits the word fertile.
- Confusing the biological with the morphological concept by describing appearance or features.
- Writing a long paragraph that buries the single marking point — examiners are looking for the key phrase, not surrounding context.
Things to Be Careful About
- The word fertile is essential. Mules (horse × donkey) are offspring of two different species, but they are sterile, which is exactly why the parents are classified as different species under the biological concept.
Populations of E. eschscholtzii are separated by the Central Valley, shown in Fig. 6.2, which contains conditions unsuitable for salamanders.
Some scientists think that the separated populations of E. eschscholtzii have evolved to form different species of salamander.
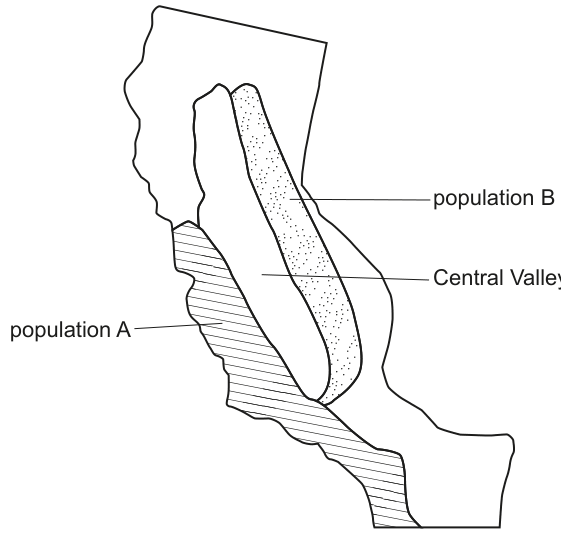
Individuals from different salamander populations may not be able to reproduce with each other, even if they are able to interact.
Explain how salamanders from different populations have evolved to be unable to reproduce with each other.
Answer
- This is an example of allopatric speciation.
- The Central Valley is a geographical barrier that separates population A on the coast from population B inland, preventing individuals of the two populations from meeting and mating.
- Because the populations are geographically isolated, there is no gene flow between them.
- In each population, different mutations arise and different alleles are favoured by natural selection because the coastal and inland environments present different selection pressures (different abiotic/biotic conditions).
- Over many generations, the genetic composition of the two populations diverges until, even if they were able to meet again, they could no longer interbreed to produce fertile offspring — i.e. they have become separate species.
Allopatric speciation: the Central Valley geographically isolates the populations, preventing gene flow, so different mutations and selection pressures in each population cause their gene pools to diverge until they can no longer interbreed to produce fertile offspring.
Background Concept
Speciation is the evolutionary process by which one species splits into two. There are several modes, but the most familiar at A level is allopatric speciation (from Greek allos = other, patris = homeland): a population is split by a physical barrier, the two halves evolve independently, and eventually they are so different that they can no longer interbreed even if the barrier is removed.
For a new species to arise, three things must happen:
- The two populations must be reproductively isolated so that no genes are exchanged between them.
- Within each population, genetic variation must arise (by mutation, and reshuffled by meiosis and random mating).
- Natural selection (and genetic drift) must cause allele frequencies in the two populations to diverge over time, so that when (or if) they meet again they are no longer compatible.
A geographical barrier such as a mountain range, a river, an ocean, or, as here, an inhospitable dry valley, is the classic allopatric trigger.
Understanding the Question
Part (c) gives a specific case: Ensatina eschscholtzii populations A and B are separated by the Central Valley of California, which is shaded in Fig. 6.2 as unsuitable habitat. The question asks you to explain how, given that the populations are separated, they have evolved so that even if they met, they could not reproduce. The command word explain means each point must give a reason, not just an observation.
The marks reward:
- Naming the process (allopatric speciation).
- Identifying the Central Valley as a geographical barrier.
- Stating the consequence: no gene flow.
- Stating the cause of divergence: different mutations/alleles under different selection pressures.
- Stating the result: reproductive isolation (cannot produce fertile offspring).
Approach
Lay out the causal chain in order: barrier → isolation → no gene flow → divergent selection / mutation → reproductive isolation. A bullet-point structure is appropriate because there are several distinct, parallel points to make. Make sure you name the process (allopatric speciation) — generic statements about "populations changing" will not earn the mark for the named mechanism.
Step-by-Step Reasoning
-
The Central Valley is a geographical barrier. The two populations of E. eschscholtzii live in different habitats that the dry, hot Central Valley separates. The salamanders cannot cross it, so individuals from population A and population B never meet to mate. This barrier is the cause of the speciation event.
-
Allopatric speciation. Because the separation is geographical, this is by definition allopatric speciation — the textbook term the mark scheme credits.
-
No gene flow. With no interbreeding between the populations, there is no exchange of alleles. The two gene pools are independent; whatever happens in one stays in one. This is the critical first step that allows the populations to begin diverging.
-
Different mutations and selection pressures. Each population experiences its own mutations independently. Coastal population A and inland population B also live in different woodland environments with different climates, predators, prey, and competitors — so the selection pressures acting on each are different. Beneficial alleles in one environment may be neutral or harmful in the other, so allele frequencies drift apart over generations.
-
Reproductive isolation. As the gene pools diverge — through mutation, selection, and genetic drift — the populations accumulate enough genetic differences that, even if the barrier were removed and the populations came back into contact, they would no longer be able to interbreed successfully to produce fertile offspring. By the biological species concept, they are now separate species.
Key Takeaways
- Allopatric = geographical separation is the cause; sympatric = separation without a geographical barrier (e.g. by polyploidy or behavioural/ecological isolation in the same place).
- Gene flow is the great homogeniser of populations: stop gene flow and populations begin to diverge.
- The biological species concept (part b) is what makes speciation meaningful — two groups are different species when they cannot produce fertile offspring.
- The Ensatina complex around California's Central Valley is one of the textbook case studies in allopatric speciation, alongside Darwin's finches on the Galápagos.
Common Mistakes
- Stating that the populations "evolved differently" without explaining why (no mention of different selection pressures, no mention of no gene flow).
- Forgetting to name the process as allopatric speciation — generic statements such as "they became different species" do not earn the mechanism mark.
- Saying the populations "adapted to their environment" but failing to link adaptation through selection to reproductive isolation.
- Confusing allopatric with sympatric speciation.
- Treating the Central Valley as just a "different habitat" rather than as a geographical barrier that prevents individuals from meeting and interbreeding.
Things to Be Careful About
- The mark scheme credits either "allopatric speciation" or the explicit description of geographical isolation — but the named term is the most efficient way to earn the mark.
- The question already tells you the populations "may not be able to reproduce with each other, even if they are able to interact" — your job is to explain how this arose, not to repeat the premise.
- "No gene flow" is a precise term; do not substitute vague phrases like "they don't share genes".
The grass Oryza sativa is grown as a food crop to produce rice. Rice plants are adapted to grow with their roots submerged in water.
An experiment was carried out to investigate the development of aerenchyma tissue in the roots of rice plants.
• 10-day old seedlings were grown with their roots submerged in water.
• Some were grown in water that was kept oxygenated and others were grown in water that did not contain oxygen (deoxygenated).
• At 12 hour intervals, some seedlings from each group were removed and transverse sections of their roots were prepared and examined.
• The sections were cut at the same distances from the root tip to check for development.
• The percentage of root tissue that had developed into aerenchyma tissue was calculated.
The results are shown in Fig. 7.1.
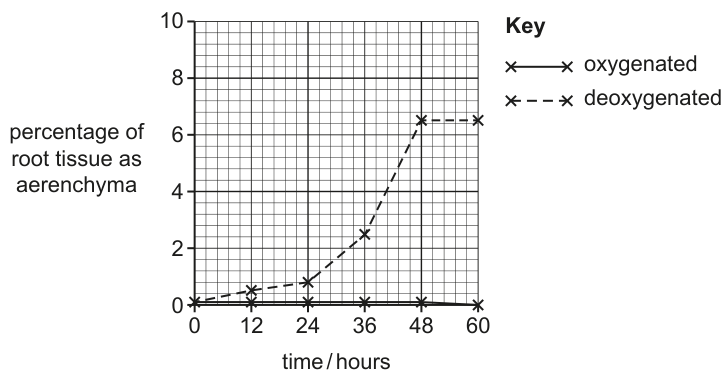
Answer
- The percentage of root tissue as aerenchyma for seedlings grown in oxygenated water remained low (≈ 0%) throughout the 60 hours.
For seedlings grown in deoxygenated water:
- The percentage increased only slightly between 0 and 24 hours.
- After 24 hours the percentage increased more rapidly / steeply.
- The percentage then levelled off / plateaued at 48 hours until the end of the experiment at 60 hours.
- Data quote: at 24 hours the percentage was approximately 0.8%, and at 48 hours it had risen to approximately 6.5%.
See working.
Background Concept
Aerenchyma is a plant tissue containing large intercellular air spaces. In waterlogged soils the diffusion of oxygen from the atmosphere into the root zone is severely restricted, so roots of flood-tolerant plants must either obtain oxygen from the aerial parts of the plant or cope internally with low-oxygen conditions. Rice (Oryza sativa) is unusual among crop plants in tolerating weeks of complete submergence; one mechanism it uses is the inducible formation of aerenchyma in the root cortex.
Understanding the Question
This part asks the candidate to describe what Fig. 7.1 shows. The graph plots the percentage of root tissue that has developed into aerenchyma against time (0–60 h) for two groups of rice seedlings — one grown in oxygenated water and one grown in deoxygenated water. The command word is describe, so the candidate must report the trends shown in the figure, including comparative statements and at least one supporting data quote with units.
Approach
Describe each curve in turn, then compare them, and support the description of the more interesting curve (deoxygenated) with a numerical data quote. The mark scheme splits the deoxygenated curve into three phases: a slow initial rise, a steeper middle rise, and a final plateau, so the answer should follow these phases.
Step-by-Step Reasoning
-
Oxygenated curve (1 mark). The line lies along the x-axis for the entire 60 hours — the percentage of aerenchyma never rises appreciably above 0%. This tells us that aerenchyma is only formed in response to oxygen deficiency; with oxygen available, the plant has no need to develop it.
-
Deoxygenated curve – initial phase (1 mark). Between 0 and 24 hours the dashed line rises only gently, reaching about 0.8%. So aerenchyma formation is slow at first — the response is not instantaneous; the plant must first sense the lack of oxygen and then begin to remodel its cortical cells.
-
Deoxygenated curve – middle phase (1 mark). After 24 hours the line becomes markedly steeper, climbing to roughly 2.5% at 36 hours and to roughly 6.5% at 48 hours. This is the period of most rapid aerenchyma development, indicating that, once induced, the cortical cells are being lysed or separated to form air spaces at a much higher rate.
-
Deoxygenated curve – final phase (1 mark). Between 48 and 60 hours the line is horizontal at about 6.5%, i.e. a plateau. By this stage the maximum extent of aerenchyma has been reached; further submergence does not increase the proportion of aerenchyma further.
-
Data quote. To support the description, a paired data quote with units is required, e.g. "at 24 hours the percentage of root tissue as aerenchyma was approximately 0.8%, and at 48 hours it had risen to approximately 6.5%". A correctly cited quote with the time in hours and the percentage in % earns the data mark.
The overall conclusion: aerenchyma develops only in the absence of oxygen, with a slow start, a rapid middle phase and a plateau by 48 hours.
Key Takeaways
- Aerenchyma formation in rice roots is induced by oxygen deficiency, not constitutive.
- Describe graphs by following the curve through its phases (start, change of slope, plateau).
- Always include at least one paired data quote with units when "describe" is asked of a graph.
Common Mistakes
- Stating the deoxygenated percentage "increases" without distinguishing the slow early phase from the steeper later phase — this loses a mark for ignoring the change in gradient.
- Confusing the oxygenated and deoxygenated lines, or implying that the oxygenated line also increases.
- Forgetting units on the data quote (must be hours on the x-axis and % on the y-axis).
- Omitting a data quote entirely — this is a specific marking point that is easy to lose.
Things to Be Careful About
- "Describe" does not ask for explanation; the why of aerenchyma formation belongs in part (a)(ii) and part (b).
- The first mark is for the oxygenated line — make sure to comment on it explicitly even though it is the "uninteresting" curve, because the comparison is the point of the figure.
- Read values from the graph carefully: the deoxygenated line is at ~0.8% at 24 h, not 1% and not 0%.
Describe the structure of aerenchyma and explain how this is an adaptation that allows roots of rice plants to be submerged in water.
Answer
- Aerenchyma is a tissue containing many large air spaces.
- These air spaces allow oxygen to diffuse from the aerial parts of the plant down to the root cells in the submerged soil / water.
- This supply of oxygen allows the root cells to carry out aerobic respiration.
See working.
Background Concept
Aerenchyma is parenchymatous plant tissue in which the cells are arranged around large, continuous intercellular air spaces. Two kinds exist:
- Schizogenous aerenchyma — formed by the separation of cells along their middle lamellae as they grow.
- Lysigenous aerenchyma — formed by the controlled death and dissolution of cortical cells, leaving the cell walls as a scaffold around huge voids. The aerenchyma of rice roots is lysigenous and is induced by low-oxygen conditions (consistent with Fig. 7.1).
These air spaces are continuous with similar spaces in the stem and leaf, so the whole plant effectively contains an internal "plumbing" system of low-resistance channels through which gases can move.
Understanding the Question
The question has two halves of equal importance: (1) describe the structure of aerenchyma, and (2) explain how that structure helps a rice plant to keep its roots submerged. Three marks are available, allocated to: a structural point, the diffusion pathway, and the function of that oxygen in respiration.
Approach
The answer should follow the structure → pathway → function chain. State the structure (lots of air spaces), explain what those air spaces do (provide a continuous, low-resistance diffusion route for oxygen from shoots to roots), and state why that oxygen is needed (so the root cells can respire aerobically).
Step-by-Step Reasoning
-
Structure (mark 1). Aerenchyma consists of parenchyma cells separated by many large intercellular air spaces. The mark scheme accepts "many / more / large, air spaces". This structural feature can be seen in a transverse section of a rice root as wide gaps in the cortex, and it is what gives submerged parts of the plant a low bulk density and high buoyancy.
-
Pathway for oxygen (mark 2). Because the air spaces in the root are continuous with similar air spaces in the stem and leaves, oxygen produced by photosynthesis (or diffusing in through stomata) in the aerial parts can travel down the plant to the roots by diffusion. The large volume of the air spaces gives a much lower resistance to gas movement than the aqueous tissue outside them, so diffusion is fast enough to supply the oxygen demand of the root cells. Mark scheme wording: "(so) oxygen, diffuses / moves, (from the aerial parts) to root (cells) / lower parts of the plant".
-
Function of the oxygen (mark 3). The oxygen delivered to the root cells allows them to carry out aerobic respiration, generating ATP efficiently for active uptake of mineral ions, cell division and growth. Without this internal oxygen supply, root cells would have to rely entirely on anaerobic respiration, which is far less efficient in terms of ATP per glucose and produces toxic ethanol. Mark scheme: "(for) aerobic respiration".
The chain is: many air spaces (structure) → oxygen diffuses from shoots to roots (pathway) → aerobic respiration in root cells (function).
Key Takeaways
- Aerenchyma is the textbook example of "structure relates to function" in plant tissues.
- The same air spaces that ventilate the roots also give buoyancy to the submerged parts.
- Aerenchyma is induced by oxygen deficiency, not always present — see Fig. 7.1.
Common Mistakes
- Describing aerenchyma only as "spongy tissue" without mentioning the air spaces — too vague to earn the structural mark.
- Saying it "stores oxygen" — air spaces are a diffusion pathway, not a long-term store; "stores" implies an unrealistic amount.
- Linking the air spaces to buoyancy only, with no mention of gas exchange or respiration — loses the diffusion and respiration marks.
- Confusing aerenchyma with xylem (which is dead, hollow and water-conducting).
Things to Be Careful About
- The mark scheme wants the three steps (structure, diffusion, aerobic respiration). A single sentence that says "air spaces allow oxygen to reach the roots for respiration" actually contains all three ideas and can be credited; but it is safer to write them out.
- Use the precise term "aerobic respiration" rather than "respiration" alone — anaerobic respiration also exists and is not what the adaptation is for.
- Do not say that the air spaces "carry oxygen down to the roots" as if they were pipes; they are a low-resistance diffusion pathway, so "diffuses" is the correct verb.
Describe and explain two other adaptations of rice plants to growing in flooded fields.
Answer
Any two of the following adaptations, each with explanation (4 marks):
Adaptation 1 — fast internode / stem elongation
- Rice shoots undergo rapid elongation of the stem / internodes when submerged.
- This keeps the leaves and flowers above the water surface, allowing photosynthesis, gas exchange and reproduction to continue.
Adaptation 2 — tolerance of root cells to ethanol
- Root cells of rice tolerate higher concentrations of ethanol / have more ethanol dehydrogenase.
- This allows the root cells to carry out anaerobic respiration (ethanol fermentation) for longer without being damaged, when oxygen is unavailable.
Adaptation 3 — leaves with ridges / that trap air
- Rice leaves have ridges (or are held in a way) that trap a layer of air against their surface when submerged.
- The trapped air film allows oxygen to diffuse into the leaf for photosynthesis and gas exchange, and for oxygen to reach the rest of the plant.
Any two adaptations, with explanation (see working).
Background Concept
Rice evolved as a semi-aquatic grass in flood-prone environments, so it has accumulated a suite of adaptations to life with its roots (and sometimes its shoots) under water. Submerged roots face three problems:
- Very little oxygen can diffuse through water to the root surface.
- Without oxygen, root cells can only respire anaerobically, producing ethanol, which is toxic.
- Water exerts a strong physical force that can damage soft tissues and prevents normal gas exchange at the leaf surface.
Different parts of the plant solve different parts of the problem. Aerenchyma (covered in (a)(ii)) is the gas-supply adaptation; this part asks for two other adaptations.
Understanding the Question
The question gives the candidate freedom of choice but specifies two constraints: each adaptation must be (i) described (a feature) and (ii) explained (why it helps in flooded fields). Four marks are available, so each adaptation earns two marks — one for the feature and one for the explanation of its benefit.
Approach
The strongest adaptations to choose are those that are specific, identifiable features of rice (not generic to all plants) and that have an unambiguous survival benefit in flooded conditions. Three such adaptations are listed in the mark scheme:
- Rapid stem / internode elongation (so leaves/flowers are above water).
- Tolerance to ethanol / more ethanol dehydrogenase (so roots survive anaerobic respiration).
- Ridged leaves that trap air (so gas exchange at the leaf surface can continue underwater).
Any two of these, with the correct structural–functional link, will earn full marks.
Step-by-Step Reasoning
Adaptation 1 — fast stem / internode elongation (2 marks)
- Feature: Rice plants, especially when partially submerged, show very rapid elongation of the stem and internodes (driven by the plant hormone gibberellin and by ethylene signalling under water).
- Benefit: The rapid growth keeps the shoot apex, leaves and flowers above the water surface. Once the leaves are in the air they can photosynthesise and exchange gases normally, and the flowers can be cross-pollinated, ensuring reproduction. Without this adaptation the whole plant would be submerged, photosynthesis would be drastically reduced and the plant would not produce a viable grain harvest.
Adaptation 2 — ethanol tolerance in root cells (2 marks)
- Feature: Rice root cells are unusually tolerant of high internal concentrations of ethanol; some sources state that they also have elevated levels of the enzyme alcohol (ethanol) dehydrogenase, which metabolises ethanol.
- Benefit: When the roots are in oxygen-deficient mud, the cells can sustain anaerobic respiration (ethanol fermentation: pyruvate → acetaldehyde → ethanol) for much longer than the root cells of most other plants, which would be poisoned by accumulating ethanol. The ATP yield of anaerobic respiration is much lower than that of aerobic respiration, but it is enough to keep essential cell processes running until the water recedes.
Adaptation 3 — leaves that trap air (2 marks)
- Feature: Rice leaves have fine ridges or a papillate surface and tend to fold so that, when the leaf is partly submerged, a thin film of air is held against the leaf surface and within the grooves.
- Benefit: The trapped air provides a diffusion pathway for oxygen (and CO₂) to and from the leaf, so photosynthesis and gas exchange can continue even while the leaf is partly underwater. The air film also makes the leaf less easily wetted, slowing the dissolution of gases into the surrounding water. This is an extra adaptation that complements the aerenchyma, which carries the same gases internally.
The mark scheme also accepts any other valid, well-explained adaptation (e.g. specialised adventitious roots, leaf sheaths that enclose air pockets, tolerance of reduced soil pH in flooded soils).
Key Takeaways
- Rice has multiple, complementary adaptations to submergence; aerenchyma is only one of them.
- A good "adaptation" answer pairs a specific feature with the survival benefit it confers; "grow fast" alone is not enough — say what grows fast and why that helps.
- Anaerobic respiration in plants produces ethanol, which is toxic; tolerance of ethanol is therefore a real biochemical adaptation, not just a general "hardiness".
Common Mistakes
- Listing adaptations that are not specific to rice (e.g. "has roots") — too vague to score.
- Describing a feature without explaining its benefit, or vice versa — each adaptation needs both halves to earn the two marks.
- Confusing aerenchyma (already credited in (a)(ii)) with a new adaptation; the question asks for other adaptations.
- Saying the plant "does anaerobic respiration instead of aerobic" without noting that this is only a short-term, low-ATP fallback and that the plant has ethanol-tolerance to survive it.
Things to Be Careful About
- Match the mark scheme: the explanation must connect the feature to the flooded-field benefit. "Stems grow fast" alone is one mark; "stems grow fast so the leaves and flowers are above water" is two marks.
- The "ethanol tolerance" point requires either the explicit mention of ethanol (or ethanol fermentation) or the explicit mention of alcohol dehydrogenase; the mark scheme will not accept "the roots can respire anaerobically" on its own, because that is true of nearly all plant roots for a short time.
- For the leaf-ridge point, use the verb "trap" rather than "hold" or "absorb" — the air is a film held against the surface, not stored inside the leaf.
Fig. 8.1 is a transmission electron micrograph of striated muscle.
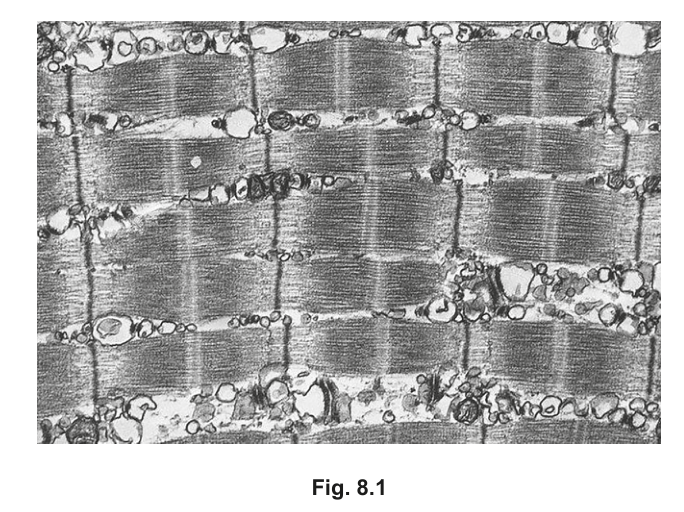
On Fig. 8.1:
• use the letter P with a label line to show a region containing only actin
• use the letter Q with a label line to show a region containing only myosin
• use the letter R with a label line to show a region containing both actin and myosin.
Answer
- P labels the I band — the lightest region of the sarcomere, centred on the Z line. This region contains only actin (thin) filaments.
- Q labels the H zone — the medium-density region in the middle of the A band, centred on the M line. This region contains only myosin (thick) filaments.
- R labels the darker parts of the A band on either side of the H zone — the overlap region where both actin and myosin filaments are present.
P on the I band (Z line, actin only); Q on the H zone (M line, myosin only); R on the darker A-band overlap region (actin + myosin).
Background Concept
A striated (skeletal) muscle fibre is packed with parallel myofibrils, each made of repeating contractile units called sarcomeres. A sarcomere is bounded by two Z lines and contains two key filament types:
- Thin filaments = actin (with associated regulatory proteins tropomyosin and troponin).
- Thick filaments = myosin (with the protruding myosin heads that generate force).
The arrangement of these filaments produces the characteristic striping seen in a transmission electron micrograph (TEM):
- I band — region containing only actin anchored to the Z line. Because only thin filaments are present, it appears as the lightest band.
- A band — the full length of the myosin filaments. The H zone in the middle of the A band contains only myosin (medium density, paler than the surrounding A band because there is no overlap with actin). The parts of the A band on either side of the H zone contain both actin and myosin and therefore appear as the darkest region.
- M line — a protein disc in the centre of the H zone that holds the myosin filaments in register.
- Z line — protein disc to which actin filaments are anchored.
Understanding the Question
The question shows a TEM of striated muscle and asks the candidate to mark three positions with label lines: P (only actin), Q (only myosin) and R (both actin and myosin). The candidate must use the relative darkness of the bands to decide where each filament type is found.
Approach
Read the micrograph as a brightness map. The palest band is the I band (actin only). The paler patch in the middle of each A band is the H zone (myosin only). The darkest parts of the A band flank the H zone and represent the actin–myosin overlap.
Step-by-Step Reasoning
- Locate a Z line — the thin dark line that runs across the myofibril and defines the sarcomere boundaries. The pale stripe on either side of it is the I band. P goes on this I band (or directly on the Z line).
- Move inwards into the A band. The paler stripe in the centre of the A band, often marked by a thin dark line (the M line), is the H zone. Q goes on this H zone (or directly on the M line).
- The remaining, darkest regions of the A band — between the H zone and the edge of the A band — are where thick and thin filaments interdigitate. R goes on this overlap region.
Key Takeaways
- I band (light) = actin only.
- H zone in the centre of the A band (paler, medium) = myosin only.
- Rest of the A band (dark) = actin + myosin overlap.
- A-band length is set by myosin and does not change during contraction; the I band and H zone shorten as filaments slide past one another.
Common Mistakes
- Putting Q on the whole A band rather than the paler H zone in the middle of it.
- Confusing the I band with the H zone — the H zone is inside the A band, while the I band is the paler stripe either side of the Z line.
- Placing P on the A band instead of the I band because the A band looks 'more solid'.
Things to Be Careful About
The label lines must end on the relevant region (or on the Z line / M line as allowed by the mark scheme) and must not just point generally at the sarcomere. The Z line lies within the I band, so P on the Z line is accepted.
Striated muscle contraction is explained by the sliding filament model.
Outline the role of the proteins troponin and tropomyosin in the sliding filament model.
Answer
- At rest, tropomyosin covers the binding sites on actin, preventing myosin heads from attaching.
- Ca²⁺ binds to troponin (released from the sarcoplasmic reticulum following the action potential).
- Troponin changes shape.
- This causes tropomyosin to move away from the binding sites on actin.
- The binding sites on actin are exposed, allowing the myosin head to bind and form a cross-bridge.
Tropomyosin blocks actin's binding sites at rest; Ca²⁺ binds to troponin, changing its shape and pulling tropomyosin aside to expose the sites, so the myosin head can bind actin and form a cross-bridge.
Background Concept
The sliding filament model states that sarcomeres shorten because the thin (actin) filaments slide past the thick (myosin) filaments; the filaments themselves do not contract. The myosin head acts as a tiny motor: it binds actin, pivots (the power stroke), releases, re-cocks and binds again. This cross-bridge cycling continues as long as binding sites on actin are available and ATP is present.
Two regulatory proteins on the actin filament control whether the myosin head can bind:
- Tropomyosin is a long fibrous protein that lies along the groove of the actin helix. At rest it physically blocks the myosin-binding site on each G-actin monomer.
- Troponin is a globular protein complex bound to tropomyosin and to actin. It has a specific binding site for calcium ions (Ca²⁺).
Understanding the Question
This is a 4-mark 'outline' question asking the candidate to describe how troponin and tropomyosin regulate the start of contraction. The answer must explain the trigger (Ca²⁺), the sensor (troponin) and the effector (tropomyosin), and end with the consequence — myosin binding actin.
Approach
Walk through the sequence in order: resting state → trigger → conformational change → displacement of blocker → exposed binding site → cross-bridge formation. Keep the language tied to specific protein names; this is the part of the mark scheme that is most often lost by vague wording.
Step-by-Step Reasoning
- Resting state: Tropomyosin sits on the actin filament in a position that covers the myosin-binding sites. The muscle is relaxed because, even though the myosin head is 'cocked' and ready, it has nothing to bind to.
- Trigger: When a motor neurone fires, acetylcholine is released at the neuromuscular junction, the action potential travels down the T-tubules, and Ca²⁺ is released from the sarcoplasmic reticulum into the sarcoplasm.
- Ca²⁺ binds to troponin. The troponin molecule has a specific Ca²⁺-binding site, and the binding of Ca²⁺ causes troponin to change its three-dimensional shape (a conformational change).
- Troponin is physically linked to tropomyosin, so when troponin changes shape it pulls tropomyosin out of the groove and away from the myosin-binding sites on actin.
- The binding sites on actin are now exposed. The myosin head, already energised by the hydrolysis of ATP to ADP + Pi, can bind to the exposed site and form a cross-bridge between the thick and thin filaments. The power stroke then slides the actin inwards.
- Contraction ends when Ca²⁺ is pumped back into the sarcoplasmic reticulum by active transport, troponin/tropomyosin return to their blocking position, and the binding sites are re-covered.
Key Takeaways
- Tropomyosin = the physical 'gate' that covers actin's binding sites at rest.
- Troponin = the Ca²⁺ sensor that, on binding Ca²⁺, pulls tropomyosin aside.
- Ca²⁺ is the molecular switch; without it, contraction cannot begin regardless of how many action potentials arrive.
- The sliding filament model is about filament movement, not filament shortening; cross-bridge cycling is what produces that movement.
Common Mistakes
- Saying 'calcium binds to tropomyosin' or 'calcium binds to actin' — the specific target is troponin.
- Saying 'troponin moves' instead of 'troponin changes shape' (or 'tropomyosin moves').
- Omitting the final step — exposure of the binding site is meaningless unless the myosin head is then said to bind to actin and form a cross-bridge.
- Describing the whole cross-bridge cycle (power stroke, detachment, re-cocking) — the question is only about the role of troponin and tropomyosin, so extra material past the first cross-bridge wastes time and can introduce errors.
- Using 'active sites' instead of 'binding sites' for the myosin-binding site on actin — the mark scheme explicitly rejects 'active sites' (an enzyme term).
Things to Be Careful About
- The four marks are taken from a list of six possible points, so any four well-stated points from the mark-scheme sequence will earn full marks. Aim to cover the trigger (Ca²⁺ → troponin), the conformational change, the movement of tropomyosin, and the consequence (binding site exposed, myosin binds).
Striated muscles can sometimes become less efficient at contracting if they have been active for a long time. This is called muscle fatigue.
Suggest why muscles may become fatigued.
Answer
Any two of:
- Lack / shortage of ATP (e.g. ATP used faster than it is regenerated by respiration).
- Lack / shortage of oxygen, so aerobic respiration cannot continue at the required rate.
- Lack / shortage of glucose / glycogen as the respiratory substrate.
- Build-up of lactate / lactic acid (from anaerobic respiration) lowering sarcoplasmic pH and impairing enzyme / protein function.
- Lack / shortage of Ca²⁺ released from the sarcoplasmic reticulum.
- e.g. depletion of creatine phosphate as a short-term ATP reserve.
Lack of ATP and/or oxygen and/or glucose (glycogen) and/or build-up of lactate from anaerobic respiration.
Background Concept
A contracting muscle is a major consumer of ATP. ATP is needed for three things in the cross-bridge cycle: (1) the myosin head to detach from actin after the power stroke, (2) the myosin head to be re-cocked into its high-energy state, and (3) the Ca²⁺ pumps of the sarcoplasmic reticulum (SERCA) to pull Ca²⁺ back into the sarcoplasmic reticulum so the muscle can relax. If any of these ATP-requiring steps slows, the muscle cannot complete normal contraction–relaxation cycles efficiently — this is what is observed as fatigue.
The ATP demand is met from three sources in order: (1) creatine phosphate (a few seconds' worth of very rapid ATP regeneration), (2) anaerobic respiration of glucose / glycogen → lactate (minutes, no O₂ required but limited and producing lactate), and (3) aerobic respiration of glucose / fatty acids in the mitochondria (sustained, but requires a continuous supply of O₂).
Understanding the Question
The question gives the name 'muscle fatigue' and asks the candidate to suggest why it happens. 'Suggest' means any biologically sensible reason is acceptable, but vague answers ('the muscle gets tired', 'it runs out of energy') are too imprecise for the mark scheme — the candidate must name specific substances whose supply falls or whose concentration rises.
Approach
Think of fatigue as the muscle no longer being able to perform the cross-bridge cycle at the same rate. Anything that limits the cycle — shortage of ATP, shortage of O₂ or glucose, failure of Ca²⁺ release, or accumulation of an inhibitory product — is a valid cause. Pick two distinct, well-named causes.
Step-by-Step Reasoning
- Lack of ATP — myosin heads cannot detach from actin and cannot be re-cocked; Ca²⁺ cannot be pumped back into the sarcoplasmic reticulum so the muscle cannot relax properly. Shortage of ATP is the most direct cause of muscle fatigue.
- Lack of oxygen — forces the muscle to rely on anaerobic respiration, which produces ATP much more slowly than aerobic respiration; without O₂, oxidative phosphorylation in the mitochondria cannot function.
- Lack of glucose / glycogen — without respiratory substrate, neither aerobic nor anaerobic respiration can regenerate ATP at the rate the muscle needs.
- Build-up of lactate / lactic acid — anaerobic respiration of glucose produces lactate, which lowers the sarcoplasm pH; this inhibits key enzymes (e.g. phosphofructokinase in glycolysis) and interferes with Ca²⁺ binding to troponin, weakening contraction.
- Lack of Ca²⁺ — if the sarcoplasmic reticulum cannot release or re-sequester Ca²⁺ efficiently, the troponin/tropomyosin switch is not operated and cross-bridge formation is reduced.
- Depletion of creatine phosphate — the immediate reserve for re-phosphorylating ADP to ATP; once this is used up, ATP supply falls sharply.
Key Takeaways
- Muscle fatigue is a supply and demand problem: ATP, O₂, glucose, Ca²⁺ and creatine phosphate on the supply side; lactate on the inhibitory side.
- The most common exam answers are 'lack of ATP' and 'build-up of lactate', which directly link to anaerobic respiration.
- A short, named, specific reason is worth a mark; a vague phrase like 'energy runs out' is not.
Common Mistakes
- 'The muscle runs out of energy' — too vague; name the substance (ATP / glucose / glycogen / creatine phosphate / O₂).
- 'Lactic acid makes the muscle sore' — soreness is a separate phenomenon; the mark-scheme reason is that lactate / H⁺ inhibits enzymes and lowers sarcoplasmic pH, so contraction becomes less efficient.
- Confusing the cause with the symptom — fatigue is the symptom; the candidate must say what is running short or accumulating.
- Putting the same idea twice in different words (e.g. 'no glucose' and 'no glycogen' as the two points — glycogen is the storage form of glucose, so the mark scheme only credits this once).
Things to Be Careful About
- Only two marks are available, so give two distinct, well-articulated points rather than a long list of weak ones.
- Spelling 'lactate' correctly is important; 'lactic acid' is also accepted.
- The mark scheme accepts 'no/less Ca²⁺' because Ca²⁺ release from the sarcoplasmic reticulum becomes less efficient during prolonged activity — this is a legitimate answer that links back to part (b).
Fig. 9.1 is a diagram outlining non-cyclic photophosphorylation.
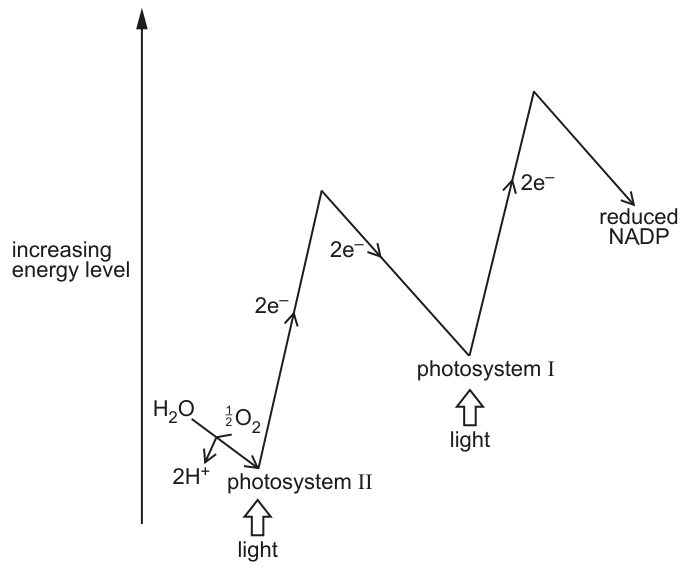
With reference to Fig. 9.1, describe the process of non-cyclic photophosphorylation.
Answer
- Light is absorbed by chlorophyll (and accessory pigments) in both photosystem II (PSII) and photosystem I (PSI); this is photoactivation of chlorophyll.
- Electrons in the reaction centres of PSII and PSI are excited to a higher energy level (photoexcited).
- Excited electrons from PSII pass along an electron transport chain (ETC) of electron carriers to PSI.
- As the electrons pass along the ETC, they release energy, which is used to pump from the stroma into the thylakoid lumen, setting up a proton gradient across the thylakoid membrane.
- ions diffuse back from the thylakoid lumen to the stroma through ATP synthase (channel protein), driving the synthesis of ATP from ADP and (chemiosmosis).
- PSII contains an oxygen-evolving complex (water-splitting enzyme), which catalyses the photolysis of water:
- The electrons lost from PSII are replaced by electrons released from the photolysis of water; the remain in the lumen and is released as a by-product.
- Light also excites electrons in PSI; these excited electrons (with ) combine with to form reduced NADP:
- The electrons lost from PSI are replaced by electrons arriving from PSII via the ETC, so the electrons follow a one-way (non-cyclic) path from to .
Light photoactivates chlorophyll in both photosystems; electrons pass from PSII along the ETC to PSI, releasing energy to pump H+ and drive ATP synthesis by chemiosmosis; photolysis of water in PSII replaces the lost electrons (releasing O2 and H+); excited electrons from PSI reduce NADP+ to reduced NADP.
Background Concept
Photosynthesis in green plants is divided into the light-dependent reactions (in the thylakoid membranes) and the light-independent reactions / Calvin cycle (in the stroma). The light-dependent reactions take place on the thylakoid membranes, where the photosystems and electron transport chain are embedded.
A photosystem is a cluster of chlorophyll and accessory pigment molecules plus a reaction centre. PSII absorbs optimally at 680 nm, PSI at 700 nm. Light energy absorbed by the pigments is passed by resonance to a chlorophyll a molecule in the reaction centre, where it "photoactivates" an electron, raising it to a higher energy level.
Non-cyclic photophosphorylation is the pathway in which:
- Electrons travel from , through PSII, along an ETC, to PSI, and finally to (a one-way, "non-cyclic" flow).
- ATP is generated by chemiosmosis — a proton gradient across the thylakoid membrane powers ATP synthase.
- is reduced to .
It is "non-cyclic" because the electrons do not return to their starting point (contrast with cyclic photophosphorylation, in which electrons cycle back to PSI and only ATP is made, not NADPH).
Understanding the Question
Fig. 9.1 is the classic Z-scheme. The y-axis shows increasing energy (redox potential); light inputs are shown as open arrows beneath each photosystem. Water enters at PSII, and leave at PSII, and reduced NADP is produced from PSI. The question asks the candidate to describe the process of non-cyclic photophosphorylation with reference to the figure, so a logical sequence of events linking each labelled feature is required (7 marks → seven creditable points).
The command word is "describe", so a sequenced narrative is needed rather than a labelled list, but technical accuracy (correct terms such as photoactivation, ETC, chemiosmosis, photolysis, reduced NADP) is essential because the mark scheme penalises vague or imprecise wording.
Approach
To earn full marks, follow the path of an electron from water to NADP, naming each structure and process it encounters:
- Start with light hitting the pigments (photoactivation).
- Describe the electron's journey: PSII → ETC → PSI.
- Explain what powers ATP synthesis (chemiosmosis: H+ gradient, ATP synthase).
- Describe photolysis of water at PSII, and explain why it is needed.
- End with reduction of at PSI.
Step-by-Step Reasoning
1. Light absorption / photoactivation
Light is absorbed by chlorophyll (and accessory pigments) in both PSII and PSI. Energy is funnelled to the reaction-centre chlorophyll, exciting an electron to a higher energy level. The mark scheme accepts either "light absorbed by chlorophyll / pigments in PSI and PSII" or "photoactivation of chlorophyll in PSI and PSII".
2. Excited electrons leave both photosystems
The mark scheme specifically requires that electrons are emitted (excited) in both photosystems. A common error is to mention only PSII.
3. Electrons travel along the ETC
The high-energy electrons from PSII pass along a chain of electron carriers (plastoquinone, cytochrome b6f complex, plastocyanin) embedded in the thylakoid membrane. They lose energy at each step; this energy does not "push" the electrons so much as it powers H+ pumping.
4. H+ gradient and chemiosmosis (the "detail" mark)
As electrons move along the ETC, energy is used to actively pump from the stroma into the thylakoid lumen, generating a proton gradient (higher [H+] and lower pH in the lumen). The proton gradient is a store of potential energy. ions flow back from the lumen to the stroma through the channel protein ATP synthase, which uses the energy of this flow to phosphorylate ADP to ATP. This is chemiosmosis.
5. Photolysis of water at PSII
PSII loses electrons continuously as they are passed to the ETC. To replace them, water is split at the oxygen-evolving complex (a manganese-containing water-splitting enzyme):
The stay in the lumen (further contributing to the proton gradient), the electrons replace those lost by PSII, and is released as a by-product of photosynthesis.
6. Reduction of NADP+
Light re-excites electrons in PSI. These electrons (now at the highest energy level of the Z-scheme) are passed to the enzyme reductase, which combines them with (from the stroma) to reduce :
The mark scheme is strict: it rejects " reduces NADP" — the electrons reduce NADP; the is needed only to form NADPH.
7. Why "non-cyclic"
The electrons lost by PSI are replaced by those arriving from PSII; those lost by PSII are replaced by those from water. So the electron flow is one-way from to NADPH — hence "non-cyclic". In cyclic photophosphorylation (not shown here), electrons from PSI return to the same photosystem, no NADPH is made, and only ATP is produced.
Key Takeaways
- Non-cyclic photophosphorylation produces both ATP (by chemiosmosis) and reduced NADP (the substrate for the Calvin cycle), and releases as a by-product of water photolysis.
- The two photosystems work in series: PSII (P680) drives electron extraction from water; PSI (P700) drives electron donation to NADP+.
- The H+ gradient across the thylakoid membrane is the unifying energy-conversion step: it links the energy released by the ETC to ATP synthesis via ATP synthase.
- Be able to state the photolysis equation and the NADP reduction equation; these are high-yield factual marks.
Common Mistakes
- Stating "oxygen" alone for photolysis — the mark scheme requires oxygen, H+ AND electrons (or the full equation). Simply saying "water is split to give oxygen" loses the H+ / e- points.
- Saying reduces NADP — explicitly rejected by the mark scheme. The electrons do the reducing; is incorporated into NADPH.
- Omitting one photosystem — both PSI and PSII must be mentioned (photoactivation, electron excitation, etc., in both).
- Confusing non-cyclic with cyclic photophosphorylation — in cyclic photophosphorylation no NADPH is formed, no water is split, and no O2 is released. Mixing the two is a common error.
- Calling the thylakoid "space" or "cavity" — the precise term is lumen (or thylakoid space).
- Describing the whole of photosynthesis — the question is about the light-dependent reactions, not the Calvin cycle. The mark scheme will not credit Calvin-cycle content here.
Things to Be Careful About
- The question says "with reference to Fig. 9.1" — quoting features visible on the diagram (PSII, PSI, the arrows for , splitting, reduced NADP) earns implicit credit and shows the examiner you are reading the figure, not just reciting memory.
- Use full technical terms: photoactivation, electron transport chain (ETC), chemiosmosis, photolysis, oxygen-evolving complex, reduced NADP / NADPH. Vague terms ("energy is made", "electrons move along") are not credited.
- Spelling of thylakoid and lumen is worth checking — Cambridge mark schemes are tolerant of minor spelling errors but "thylacoid" or "thylakoid space" both lose credit relative to the precise term.
- The y-axis of Fig. 9.1 is increasing energy level (or redox potential). Make sure the description of electrons "falling" from PSII to PSI along the ETC refers to them releasing energy, which is what pumps the H+.
Fig. 9.2 shows the relationship between the rate of photosynthesis and light intensity.
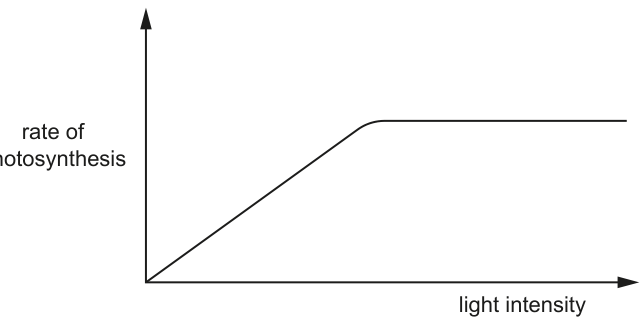
Describe and explain the relationship shown in Fig. 9.2.
Answer
- As light intensity increases from zero, the rate of photosynthesis increases proportionally (linearly).
- This is because more light provides more energy for the light-dependent reaction (more photoactivation of chlorophyll, more non-cyclic photophosphorylation), so more ATP and reduced NADP are produced, allowing the Calvin cycle to fix at a faster rate.
- At higher light intensities, the rate plateaus (levels off) and further increases in light intensity have no effect on the rate.
- This is because light is no longer the limiting factor — either concentration or temperature has become the limiting factor, restricting the rate of the (light-independent) Calvin cycle.
Rate of photosynthesis increases linearly with light intensity at low intensities (light-dependent reactions increase) and then plateaus when another factor (CO2 concentration or temperature) becomes limiting.
Background Concept
The rate of photosynthesis depends on three main external factors: light intensity, carbon dioxide concentration, and temperature. At any given moment, whichever of these is shortest in supply sets the maximum possible rate; it is called the limiting factor (Blackman's law of limiting factors).
The light-dependent reactions in the thylakoid membrane require light as their energy source, so when light is the limiting factor, increasing light directly increases the rate at which ATP and reduced NADP are made, which in turn allows the Calvin cycle to fix more . When light is abundant but is scarce, the Calvin cycle is limited by its substrate and additional light produces no further increase in rate.
Understanding the Question
Fig. 9.2 shows rate of photosynthesis (y-axis) plotted against light intensity (x-axis). The graph has two distinct regions:
- A linear rising phase at low light intensities (rate ∝ light intensity).
- A plateau at higher light intensities (rate independent of light intensity).
The command word is "describe and explain" — the candidate must:
- Describe the shape of the curve (3 marks demand both a description of the rise and of the plateau).
- Explain why it has that shape in terms of light-dependent reactions and limiting factors.
Approach
Identify the two regions of the curve, then for each region give one descriptive point and one explanatory point that links to the underlying biology.
- Linear region: description (rate rises with light) + explanation (more light → more light-dependent reaction → more ATP and reduced NADP).
- Plateau region: description (rate levels off) + explanation (light is no longer limiting; or temperature is the new limiting factor).
Step-by-Step Reasoning
Point 1 — The linear region
The graph shows a straight line through the origin at low light intensities. The rate of photosynthesis is directly proportional to light intensity. Explanation: light provides the energy to photoactivate chlorophyll in PSI and PSII. As more photons strike the chlorophyll, more electrons are excited per unit time, so non-cyclic photophosphorylation runs faster, producing more ATP and more reduced NADP per unit time. These products drive the Calvin cycle faster, so is fixed at a higher rate.
Point 2 — The plateau
At higher light intensities, the curve flattens — the rate of photosynthesis becomes independent of light intensity. Explanation: in this region, light is no longer the limiting factor. Either carbon dioxide concentration is too low to allow the Calvin cycle to use the extra ATP and reduced NADP being produced, or the temperature is too low for the enzymes (especially rubisco) to operate any faster. Therefore additional light cannot further increase the rate.
Point 3 (optional but tidy)
The plateau shows that even with unlimited light, the rate of photosynthesis has an upper limit set by another factor. The exact limiting factor on the plateau depends on experimental conditions: in many classroom experiments, is the limiting factor at the plateau; in cold conditions, temperature is.
Key Takeaways
- This is the classic light-intensity graph and the most common context for the limiting-factor concept.
- Linear rise ⇒ light is the limiting factor.
- Plateau ⇒ another factor is limiting (CO2 or temperature).
- Increasing the limiting factor (e.g. adding ) would raise the plateau, but the initial slope (light-limited region) would be unchanged.
Common Mistakes
- Stating that "the rate stops because the chlorophyll is full / saturated" — chlorophyll molecules do not "fill up". Photons are absorbed and electrons are constantly lost to the ETC, so chlorophyll is always available to absorb more light. The plateau is due to another factor, not chlorophyll saturation.
- Saying "temperature / is the limiting factor" without explaining that light is no longer limiting — the mark scheme awards 1 mark for the identification of the new limiting factor; you do not need to name which one, only that something other than light is now limiting.
- Confusing the x- and y-axes — the candidate must keep "rate" on the y-axis and "light intensity" on the x-axis. Reversing these suggests a misunderstanding of the relationship.
- Vague explanation — "more light gives more photosynthesis" alone is worth at most 1 mark; the mechanism (more light-dependent reaction / more ATP and reduced NADP) is what earns the second mark.
Things to Be Careful About
- The mark scheme accepts any one of: light-dependent reaction, cyclic photophosphorylation, non-cyclic photophosphorylation, or photoactivation as the explanation for why the rate increases. Choose the term you are most confident with, but the more precise the better.
- The plateau mark is given for stating that " concentration or temperature becomes the limiting factor" — either one alone is fine.
- The question awards 3 marks; do not waste a mark by repeating the same idea in different words. Three distinct, sharp points is the goal.
The respiratory quotient (RQ) is used to indicate what type of substrate is being metabolised in respiration.
Answer
RQ = (volume/moles/molecules of CO₂ produced) / (volume/moles/molecules of O₂ taken in)
Background Concept
The respiratory quotient (RQ) is a ratio that tells us which type of respiratory substrate (carbohydrate, lipid or, less commonly, protein) an organism is mainly using at a given moment. The equation for the aerobic respiration of a generic substrate can always be summarised as:
The CO₂ released comes from decarboxylation reactions in the link reaction and Krebs cycle; the O₂ consumed is the terminal electron acceptor in oxidative phosphorylation. Because the number of carbon atoms and the degree of reduction of the substrate both influence how much CO₂ is produced per O₂ used, RQ is substrate-specific.
Understanding the Question
This is a one-mark "define" item. The examiner is looking for the algebraic relationship between CO₂ output and O₂ uptake — the words "carbon dioxide produced" and "oxygen taken in" must both be present (mark scheme: "molecules / moles / volume, carbon dioxide produced" over "molecules / moles / volume, oxygen taken in").
Approach
Write the definition as a ratio. Either give it in words or as a fraction — both are acceptable as long as the two terms are clearly named.
Step-by-Step Reasoning
- CO₂ produced and O₂ taken in must both appear.
- The ratio can be expressed in terms of molecules, moles or volumes — any one of these is accepted.
- A clean form is: "RQ = (molecules/moles/volume of CO₂ produced) ÷ (molecules/moles/volume of O₂ taken in)."
Key Takeaways
- RQ is a dimensionless ratio (units cancel).
- It is independent of the amount of substrate respired — only the type of substrate matters.
Common Mistakes
- Giving the ratio upside-down (O₂/CO₂ instead of CO₂/O₂).
- Saying only "carbon dioxide over oxygen" without indicating these are the volumes/moles released and consumed by respiration (which is what the mark scheme requires).
Things to Be Careful About
The mark scheme specifically uses the words "produced" and "taken in" — keep these phrases rather than vague alternatives.
When the unsaturated fatty acid linoleic acid is respired aerobically the equation is:
Calculate how many molecules of oxygen are used when one molecule of linoleic acid is respired aerobically.
answer = ______
Working
Balance oxygen atoms on each side.
- Left side: 2 (from linoleic acid) + 2x (from O₂)
- Right side: 18(×2 from CO₂) + 16(×1 from H₂O) = 36 + 16 = 52
Answer
25
25
Background Concept
For any aerobic respiration equation, the number of O atoms on each side must be equal. Carbon and hydrogen are already balanced by the products given (18 carbons → 18 CO₂; 32 hydrogens → 16 H₂O). Only oxygen remains to be balanced, and all of the extra O atoms come from the O₂ molecules — so counting oxygens gives the number of O₂ molecules.
Understanding the Question
You are given:
and asked to fill in the blank.
Approach
Count the oxygen atoms on the right-hand side, subtract the two oxygens already present in the linoleic acid, and divide the remainder by 2 (because each O₂ molecule contributes two O atoms).
Step-by-Step Reasoning
- CO₂ contributes 18 × 2 = 36 O atoms.
- H₂O contributes 16 × 1 = 16 O atoms.
- Total O atoms on the right = 36 + 16 = 52.
- Two O atoms already come from the substrate, leaving 52 − 2 = 50 O atoms to come from O₂.
- 50 ÷ 2 = 25 O₂ molecules.
Key Takeaways
- The number of O₂ molecules in a respiration equation equals (total O on RHS − O already in substrate) / 2.
- For lipids, this number is large (≈25 for an 18-carbon fatty acid) because lipids are highly reduced and contain little oxygen of their own.
Common Mistakes
- Forgetting that the substrate already contributes 2 oxygen atoms — this would give 26 instead of 25.
- Dividing the CO₂ contribution by 2 rather than multiplying, leading to 9 instead of 18 O atoms from CO₂.
Things to Be Careful About
Carry through any error: the mark scheme allows ecf in part (iii), so whatever you write here is used in the next calculation. Get this number right and part (iii) follows directly.
Working
Answer
0.72
0.72
Background Concept
With a balanced respiration equation, the coefficients of CO₂ and O₂ immediately give the ratio of molecules produced to molecules consumed. RQ is dimensionless, so the answer is just a number.
Understanding the Question
Using the balanced equation from part (ii), the coefficient of CO₂ is 18 and that of O₂ is 25, so RQ = 18/25.
Approach
Substitute into the RQ definition from part (i) and evaluate.
Step-by-Step Reasoning
- RQ = CO₂ / O₂ = 18 / 25.
- 18 ÷ 25 = 0.72.
- This is the characteristic RQ for an unsaturated fatty acid such as linoleic acid (lipids typically give RQ ≈ 0.7; saturated fats give slightly lower values around 0.69, while pure tripalmitin is ≈ 0.70).
Key Takeaways
- Carbohydrate (e.g. glucose) → RQ = 1.0.
- Lipid → RQ ≈ 0.7.
- Protein → RQ ≈ 0.9.
The exact value depends on the empirical formula of the substrate, which is why unsaturated vs saturated lipids differ slightly.
Common Mistakes
- Dividing O₂ by CO₂ — the formula is CO₂ ÷ O₂, not the other way round.
- Citing two decimal places only when asked; here 0.72 is correct.
Things to Be Careful About
The mark scheme accepts ecf — if your answer to (a)(ii) was wrong, use your number here. Always quote to 2 decimal places to match the precision of the data in part (b).
Hummingbirds feed on nectar from flowers. Nectar is rich in sugars.
Fig. 10.1 shows a hummingbird.
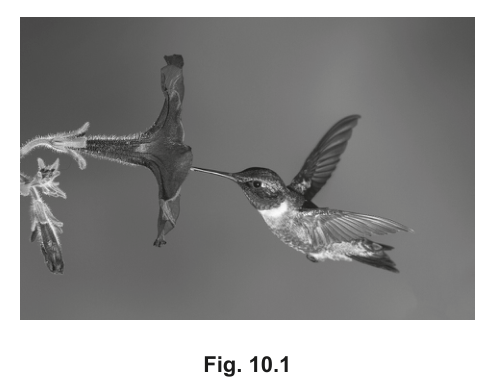
A study of aerobic respiration in captive hummingbirds was carried out. The hummingbirds were allowed to feed freely and then made to fast for 4 hours. During the fasting period their RQ values were calculated every 40 minutes.
Fig. 10.2 shows the results from this study.
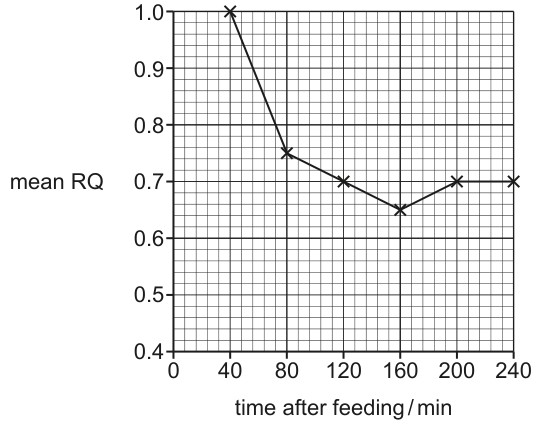
Describe and suggest explanations for the results shown in Fig. 10.2.
Answer
- At 40 min after feeding the mean RQ is 1.0, indicating that the respiratory substrate is carbohydrate / sugar (e.g. glucose) — the nectar consumed is being respired.
- Between 40 min and 160 min the RQ decreases as the carbohydrate / sugar is used up / runs out.
- The RQ decreases because the bird switches to respiring a mixture of carbohydrate and lipid.
- From 120 min onwards the RQ is around 0.65–0.70, indicating that fatty acids / lipids are being respired as the main respiratory substrate.
- Data quote: RQ = 1.0 at 40 min and RQ = 0.65 at 160 min.
RQ falls from 1.0 (carbohydrate) at 40 min to ≈0.65–0.70 (lipid) at 160–240 min because the bird switches from respiring sugars to respiring stored fats.
Background Concept
The respiratory quotient is substrate-specific:
| Substrate | Typical RQ |
|---|---|
| Carbohydrate (e.g. glucose) | 1.0 |
| Lipid (e.g. tripalmitin) | ≈ 0.7 |
| Protein | ≈ 0.9 |
So RQ tells a physiologist which fuel an animal is burning at a given moment. After a meal rich in sugar, RQ should approach 1.0; as the meal is digested and absorbed and the animal begins to draw on its fat stores, RQ should fall towards 0.7. In a small, highly active bird like a hummingbird, this transition can happen within hours because the energy demand is high and the carbohydrate reserves are small.
Understanding the Question
A captive hummingbird has been allowed to feed freely (so its gut is full of sugar-rich nectar) and is then fasted for 4 hours. Every 40 min its RQ is measured.
Fig. 10.2 plots mean RQ (y-axis, 0.4 to 1.0) against time after feeding in minutes (x-axis, 0 to 240). The reading on the y-axis at each time point:
- 40 min: 1.0
- 80 min: 0.75
- 120 min: 0.70
- 160 min: 0.65 (minimum)
- 200 min: 0.70
- 240 min: 0.70
The question asks the candidate to describe (state what the graph shows) and suggest explanations (say why RQ behaves this way biologically).
Approach
- Read each point on the graph and group them into three regimes: initial high RQ (≈1.0), intermediate falling RQ (≈0.75), and low plateau (≈0.65–0.70).
- For each regime, name the substrate being respired and explain why the substrate changes (carbohydrate store depletes; animal switches to lipid stores).
- Support with at least one data quote that ties two time-points together (mark scheme requires this).
Step-by-Step Reasoning
Point 1 — initial value. The first data point is at 40 min with RQ = 1.0. RQ = 1.0 is the diagnostic value for carbohydrate respiration (the bird has just digested nectar, which is essentially a sugar solution). Credit: RQ at 40 min = 1.0 because carbohydrates / sugars are being respired.
Point 2 — falling RQ. Between 40 and 80 min the RQ drops sharply from 1.0 to 0.75, and continues to fall gradually to 0.65 by 160 min. This fall indicates that the available carbohydrate is being used up. Credit: RQ decreases (over time) as carbohydrate / sugars run out / are used up.
Point 3 — mixed substrate. As the carbohydrate runs out, the bird begins to respire stored fat alongside whatever carbohydrate remains, so the RQ reflects a mixture of substrates. Credit: RQ decreases as a mixture of carbohydrate and lipid is respired. (Proteins are explicitly not credited by CIE here — they would give RQ ≈ 0.9 but are not mobilised until later in fasting.)
Point 4 — fat-dominated metabolism. From 120 min onwards the values plateau at 0.65–0.70, which is the RQ for fatty acids / lipids. Credit: RQ of 0.65 / 0.7 because fatty acids / fats / lipids are respired (as the main respiratory substrate), OR from 120 min onwards fatty acids / fats / lipids are respired (as the main respiratory substrate).
Point 5 — data quote (mandatory for full marks). The mark scheme requires a quoted pair. A clean version is: "RQ = 1.0 at 40 min and RQ = 0.65 at 160 min." This explicitly links the start of fasting (pure carbohydrate) to the depth of the fast (predominantly lipid).
Key Takeaways
- RQ is a real-time readout of which substrate is being oxidised.
- After a sugary meal, RQ ≈ 1.0; with prolonged fasting RQ falls towards 0.7 as lipid stores are mobilised.
- Always quote at least one pair of values from the graph when describing it — marks are explicitly tied to a data quote here.
Common Mistakes
- Saying "RQ decreases because the bird uses less oxygen" — wrong; RQ is a ratio of CO₂ produced to O₂ consumed, and the direction of change tells you about the substrate, not about how hard the bird is breathing.
- Suggesting protein metabolism to explain the fall — proteins give RQ ≈ 0.9, not 0.7; CIE explicitly ignores "protein" here.
- Forgetting the data quote — without it you can only score 3 of the 4 marks.
- Saying "RQ = 0 because the bird stops respiring" — false; the bird continues to respire, only the substrate changes.
Things to Be Careful About
- "RQ decreases" must be tied to a cause — the question asks to describe and explain, so each trend needs a "because …" attached.
- Mark scheme specifies "from 120 min onwards" as the alternative wording for the lipid phase, so you can structure your answer by time period instead of by RQ value — both are accepted.
- Watch the precision: the graph's minimum is read as 0.65, not 0.7, so quote it as 0.65 if you are citing the lowest value.