Biology 9700/42 — May/June 2025
Cambridge A-Level · A Level Structured Questions · worked solutions for every part, with the mark scheme
Topics Classification, Biodiversity and Conservation · Energy and Respiration · Selection and Evolution · Inheritance · Genetic Technology · Homeostasis · +2 more
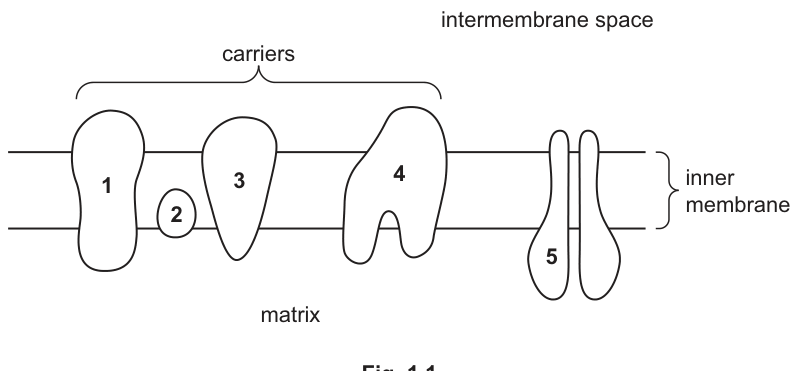
Fig. 1.1 is a diagram of part of the inner membrane of a mitochondrion.
The coenzymes NAD and FAD deliver hydrogen atoms to the electron transport chain (ETC).
With reference to Fig. 1.1, state which of the four carriers receives hydrogen atoms from reduced FAD.
______
Answer
2
2
Background Concept
The inner mitochondrial membrane houses the electron transport chain (ETC), a series of protein carriers that pass electrons from one carrier to the next, releasing energy at each step. Two reduced coenzymes feed electrons into the chain: reduced NAD (NADH), produced in glycolysis, the link reaction and the Krebs cycle, and reduced FAD (FADH₂), produced only by one Krebs-cycle enzyme, succinate dehydrogenase. Each coenzyme donates its hydrogen atoms to a specific carrier at a different point in the chain, so the position at which electrons "enter" affects how much energy (and ultimately ATP) is released downstream.
Understanding the Question
The stem reminds the candidate that NAD and FAD deliver hydrogen atoms to the ETC. The question asks which of the four numbered carriers in Fig. 1.1 receives hydrogen from reduced FAD. The candidate only has to identify the correct number — no explanation is required.
Approach
Recall that reduced FAD is generated during the oxidation of succinate to fumarate in the Krebs cycle, and that succinate dehydrogenase is the only Krebs-cycle enzyme embedded directly in the inner mitochondrial membrane. Its H atoms therefore enter the ETC at a carrier that is located further "downstream" (closer to oxygen) than the NADH entry point. In Fig. 1.1, carrier 2 is the smaller carrier between carriers 1 and 3, and is the point at which FADH₂ feeds hydrogen into the chain.
Step-by-Step Reasoning
- Reduced NAD is oxidised at the first (largest, most "upstream") carrier, releasing protons and passing electrons to the next carrier. This corresponds to carrier 1 in the diagram.
- Reduced FAD is oxidised later in the chain, so it must be a carrier that lies further along. Carrier 2 is positioned between carriers 1 and 3, so this is the FADH₂ entry point.
- Carriers 3 and 4 lie further along the chain and pass electrons towards oxygen, the final acceptor. The exact identity of these carriers (e.g. cytochrome complex, cytochrome c, cytochrome oxidase) is not required by the mark scheme; only the number 2 is needed.
Key Takeaways
- Reduced NAD enters the ETC at the first carrier; reduced FAD enters later, at a different specific carrier.
- Because FADH₂ enters "downstream", it contributes fewer protons to the gradient and yields less ATP per molecule than NADH.
Common Mistakes
- Writing 1 because that is "the first carrier". Carriers are numbered for identification in the figure, not for their position in the ETC; FADH₂ enters at a different carrier to NADH.
- Writing 3 or 4 — these are downstream of the FADH₂ entry point.
Things to Be Careful About
- The question is worth one mark, so only the number 2 is needed — no surrounding sentence, no unit, no explanation.
- The mark scheme explicitly states "2 ;" so any other number scores zero.
Hydrogen atoms that are delivered to the ETC by reduced NAD and reduced FAD split into protons and electrons. Energy is released as electrons pass along the ETC.
Describe the events that occur as a result of this release of energy.
Answer
- Protons (H⁺ ions) are pumped / actively transported from the matrix into the intermembrane space.
- This creates a proton gradient across the inner mitochondrial membrane.
Protons are pumped into the intermembrane space, forming a proton gradient across the inner membrane.
Background Concept
When reduced NAD and reduced FAD deliver hydrogen atoms to the ETC, each hydrogen atom splits into a proton (H⁺) and an electron. The electron is passed along the chain of carriers, and the small amount of energy released at each transfer is used by the carriers to do work. That work is the active transport of protons from the matrix, across the inner membrane, into the intermembrane space. Because the membrane is otherwise impermeable to H⁺, the protons accumulate on the intermembrane side, generating both a concentration gradient and a charge gradient — together, an electrochemical proton gradient. This gradient stores the energy released by electron transport and is later used by ATP synthase to make ATP.
Understanding the Question
The question states that hydrogen atoms split into protons and electrons, and that energy is released as electrons pass along the ETC. The candidate must describe the events that occur as a result of this energy release. There are two marks, so two linked ideas are needed.
Approach
Follow the energy: the energy released by electrons moving "downhill" along the carriers is used to move something across a membrane. Identify what is moved (protons), the direction (matrix → intermembrane space), and the consequence (a proton gradient).
Step-by-Step Reasoning
- The carriers use the energy from electron transfers to actively transport (pump) H⁺ ions from the matrix into the intermembrane space.
- Because the inner mitochondrial membrane is impermeable to H⁺ except via ATP synthase, the protons accumulate in the intermembrane space, producing a higher [H⁺] there than in the matrix.
- This unequal distribution is the proton gradient. The gradient has both a concentration component and an electrical component (more positive outside), and the energy stored in it is called the proton-motive force.
Key Takeaways
- The ETC does not make ATP directly; it uses energy from electron transfers to pump protons and create a gradient.
- Chemiosmosis (in part (iii)) is the process that then uses that gradient.
Common Mistakes
- Saying "electrons are pumped into the intermembrane space" — electrons stay on the carriers, protons are the species that crosses the membrane.
- Saying the gradient is across "the membrane" without specifying which side has more protons (intermembrane space > matrix).
- Confusing this with ATP synthesis itself — no ATP is made at this stage.
Things to Be Careful About
- "Proton" and "hydrogen ion (H⁺)" are interchangeable; the mark scheme accepts either.
- "Active transport" / "pumped" are both acceptable verbs; "diffuses" alone is not, because the carriers are using metabolic energy to move H⁺ against the gradient.
Answer
- Structure 5 is ATP synthase.
- Protons (H⁺ ions) move from the intermembrane space back into the matrix through ATP synthase.
- Movement is by facilitated diffusion, down the electrochemical gradient.
- The energy released drives the synthesis of ATP from ADP and inorganic phosphate (Pi).
- The process is called chemiosmosis.
ATP synthase allows protons to flow from the intermembrane space into the matrix by facilitated diffusion, releasing energy that combines ADP + Pi to form ATP — this is chemiosmosis.
Background Concept
ATP synthase is a large, rotary protein complex embedded in the inner mitochondrial membrane. It has two functional parts visible in Fig. 1.1: a stalk (F₀) embedded in the membrane and a head (F₁) that projects into the matrix. The F₀ part contains a channel through which protons can pass; the F₁ part contains the catalytic sites where ADP and inorganic phosphate (Pi) are joined to make ATP. ATP synthase couples the flow of protons down their electrochemical gradient to the phosphorylation of ADP. Because the inner membrane is otherwise impermeable to H⁺, protons can only return to the matrix through ATP synthase — so the gradient set up in part (ii) can only "discharge" by making ATP.
Understanding the Question
The question asks the candidate to describe how structure 5 (the ATP synthase in Fig. 1.1) is involved in oxidative phosphorylation. Three marks are available, and the mark scheme provides five credit-worthy points, any three of which earn full marks.
Approach
Build a logical sequence: name the structure → state what moves through it → state how it moves → state what energy is used for → name the overall process.
Step-by-Step Reasoning
- Identification: Structure 5 in Fig. 1.1 is ATP synthase — this is the molecule responsible for synthesising ATP in oxidative phosphorylation.
- Proton movement: Protons in the intermembrane space (built up by the ETC in part (ii)) move through ATP synthase back into the matrix, down their electrochemical gradient.
- Mode of movement: This is facilitated diffusion — protons pass through a channel in the F₀ part of the enzyme. No ATP is used for this movement; in fact, the energy of the gradient is released as they pass.
- ATP synthesis: The energy released as protons flow through ATP synthase is used to combine ADP and Pi to form ATP ("oxidative phosphorylation"). The F₁ head rotates as protons flow, mechanically driving the reaction.
- The overall process is called chemiosmosis — the diffusion of ions (here H⁺) down an electrochemical gradient through ATP synthase to make ATP.
Key Takeaways
- Oxidative phosphorylation is the combination of electron transport (part ii) and chemiosmosis (this part).
- ATP synthase is the only route by which protons can re-enter the matrix, so the entire yield of aerobic respiration depends on this single enzyme complex.
Common Mistakes
- Saying "ATP is made by the ETC" — ATP is not made by the electron carriers; it is made by ATP synthase using the gradient the carriers have created.
- Saying protons move "by active transport" into the matrix — they move by facilitated diffusion, down the gradient, with the energy released used to drive ATP synthesis.
- Forgetting to mention ADP + Pi as the substrates for ATP synthesis.
Things to Be Careful About
- "Chemiosmosis" must be mentioned to score that point — it is the technical name for the whole process and is the precise term CIE expects.
- "Facilitated diffusion" is the precise mode of proton movement through ATP synthase; the channel is provided by the protein itself.
Cyanide ions () are highly toxic.
Cyanide ions bind to carrier 4 in Fig. 1.1 and inactivate the carrier.
Suggest and explain how the binding of cyanide ions to carrier 4 can have an effect on respiration.
Answer
- The electron transport chain stops / becomes reduced (electrons cannot be passed on).
- Oxygen can no longer act as the final electron acceptor.
- No / fewer protons are pumped into the intermembrane space, so the proton gradient is lost / less steep.
- Reduced NAD / reduced FAD cannot be re-oxidised, so they accumulate; no / less NAD⁺ and FAD is regenerated.
- No / less ATP is produced by oxidative phosphorylation (no protons pass through ATP synthase).
- The Krebs cycle and link reaction stop because they have no NAD⁺ / FAD to accept their hydrogen.
- Glycolysis continues anaerobically, producing lactate (in animals) or ethanol + CO₂ (in plants/yeast); ATP is made only by substrate-level phosphorylation.
Cyanide binding to carrier 4 (cytochrome oxidase) blocks the ETC, halts proton pumping, collapses the gradient, stops oxidative phosphorylation and the Krebs cycle, and forces the cell into anaerobic respiration with much-reduced ATP yield.
Background Concept
Carrier 4 in Fig. 1.1 is the last carrier of the electron transport chain — it passes electrons to oxygen, the final electron acceptor, reducing O₂ to water. The carriers of the ETC work in series: each one is reduced by the carrier before it and oxidised by the carrier after it. If any carrier in the chain is blocked, every carrier "upstream" of it cannot be re-oxidised, and the chain grinds to a halt. The reduced coenzymes NADH and FADH₂ also cannot be re-oxidised, so they accumulate. The Krebs cycle and link reaction depend on a supply of oxidised NAD⁺ and FAD, so they too stall. The cell then has no way to re-oxidise NADH and is forced to rely on glycolysis, which must regenerate NAD⁺ anaerobically (to lactate in mammals, to ethanol + CO₂ in yeast and plant cells under hypoxia). ATP yield collapses from ~30 per glucose to 2 per glucose.
Understanding the Question
The stem tells the candidate that cyanide ions (CN⁻) bind to and inactivate carrier 4 — the terminal carrier that normally hands electrons to oxygen. The question is open-ended "suggest and explain", so the candidate must reason out the cascade of consequences, not just state one effect. There are four marks, so at least four distinct, linked ideas are required.
Approach
Work step by step through the system: what does carrier 4 do? what happens when it stops? how does that affect the proton gradient? what does that do to ATP synthesis? what does that do to the supply of oxidised NAD/FAD? what does that do to the Krebs cycle? what does the cell do instead? Each link in the chain is a potential marking point.
Step-by-Step Reasoning
- Step 1 — ETC stops. Carrier 4 normally reduces O₂ to H₂O. Cyanide blocks this, so electrons have nowhere to go. The whole chain becomes reduced (all carriers carry extra electrons).
- Step 2 — No proton pumping. With no electron flow, there is no energy to pump protons. Protons already in the intermembrane space leak back to the matrix, so the proton gradient collapses.
- Step 3 — ATP synthesis halts. Without a proton gradient, no protons pass through ATP synthase, and oxidative phosphorylation stops. ATP can no longer be made at this stage.
- Step 4 — Coenzymes accumulate. Reduced NAD and reduced FAD cannot be re-oxidised because their electrons have no path to oxygen. They build up in the matrix; the supply of NAD⁺ and FAD runs out.
- Step 5 — Krebs cycle and link reaction stop. These two stages release hydrogen atoms to NAD⁺ and FAD. With no oxidised coenzymes available, the dehydrogenations cannot proceed, so both stages halt.
- Step 6 — Glycolysis continues anaerobically. Glycolysis still produces a small amount of ATP by substrate-level phosphorylation, and regenerates NAD⁺ by reducing pyruvate to lactate (in animals) or to ethanol + CO₂ (in yeast and some plant tissues). This is anaerobic respiration.
- Step 7 — Energy crisis. ATP yield falls from ~30 to 2 per glucose. Energy-requiring processes (active transport, biosyntheses, muscle contraction) fail, and cyanide poisoning is rapidly fatal.
Key Takeaways
- The ETC is a serial chain: blocking one carrier halts the whole chain.
- Cyanide is dangerous precisely because it shuts off aerobic ATP production; cells can only fall back on the much-less-efficient anaerobic pathway.
- This is the same principle behind many other respiratory poisons (e.g. carbon monoxide, azide, antimycin A) — they all target a specific carrier in the ETC.
Common Mistakes
- Saying only that "ATP production stops" without explaining the mechanism (loss of proton gradient, etc.).
- Saying "oxygen cannot be used" without linking this to the ETC and the proton gradient.
- Saying "the cell dies because there is no oxygen" — cells die because there is no ATP, not because there is no O₂ per se.
- Failing to mention the build-up of reduced NAD/FAD and the stoppage of the Krebs cycle, which CIE marks credit for.
Things to Be Careful About
- "Suggest and explain" demands both: the candidate should propose a consequence AND link it to the cyanide binding. A bald statement of "ATP production falls" without the link back to the ETC scores nothing.
- CIE does not require the candidate to name "cytochrome oxidase" — the question uses the figure's numbering, so the answer should refer to carrier 4, not to the biochemical name.
- "No / less" wording in the mark scheme means either a complete absence or a reduction is acceptable, depending on the candidate's reasoning.
When organisms reproduce, they pass on their alleles to the next generation. There are many factors that can affect how allele frequencies change over time in a population.
Explain how genetic drift and the founder effect may affect allele frequencies in populations.
Answer
Any six from:
Genetic drift:
- Allele frequencies change due to random / chance events, not by natural selection
- Some alleles are lost from the population
- This increases the frequency of one (or a small number of) alleles, leading to increased homozygosity / decreased heterozygosity
- The gene pool becomes smaller / genetic variation is reduced
- Caused by random fusion of gametes, random mating, chance death of individuals, or random mutations
- The effect is greater in small populations
Founder effect:
- A small number of individuals become isolated, start a new population, or migrate to a new area
- Not all alleles from the original population are present; the alleles carried are not representative of the original population
- (AVP) e.g. the bottleneck effect is similar; genetic drift acts gradually over time, whereas the founder effect is a one-off event
Six marking points covering both genetic drift and the founder effect (see working).
Background Concept
Within a population, evolution is defined as a change in allele frequency over time. The most familiar mechanism driving such change is natural selection, in which individuals with alleles that confer a survival or reproductive advantage leave more offspring, so those alleles increase in frequency. However, allele frequencies can also shift for reasons that have nothing to do with fitness, and these are lumped together under the heading genetic drift.
Genetic drift is the random, non-selective change in allele frequency that arises simply because populations are finite. In any generation, which individuals happen to mate, which gametes happen to fuse, and which individuals happen to survive long enough to reproduce are all partly matters of chance. When a population is small, these chance events have a large impact on the allele frequencies that get passed on; when the population is large, random fluctuations tend to cancel out, so allele frequencies stay close to the previous generation's values.
Two situations make drift especially powerful: the bottleneck effect (a sharp, temporary reduction in population size caused, for example, by a natural disaster) and the founder effect (a new population is started by a small, non-representative sample of individuals from the parent population). The founder effect can be thought of as a bottleneck that happens at the moment a new population is established rather than after it already exists.
Understanding the Question
This is a 6-mark "explain" question. The command word explain means that simply naming genetic drift and the founder effect is not enough — the candidate must describe how each one changes allele frequencies, and ideally the conditions under which each is most significant. The mark scheme credits six points "any" from a pool of ten, so the candidate is expected to cover both phenomena and pick out the most important ideas rather than writing everything they know.
The stem of the paper reminds the candidate that allele frequencies can change in many ways. The question narrows this to two: genetic drift and the founder effect. There is no diagram, no data, and no calculation — it is a structured free-response question of the kind found on AS/A2 Paper 4.
Approach
A clean approach is to structure the answer in two sections: one for genetic drift in general, and one specifically for the founder effect. Aim to cover:
- The cause of the change (chance events, not selection).
- The consequence for allele frequencies (some alleles lost, others become more common, homozygosity increases, the gene pool shrinks).
- The condition that makes the effect large (small population size for drift; isolation / colonisation for the founder effect).
- The distinguishing feature of the founder effect (it is a one-off event starting a new population, and the founding individuals carry a non-representative sample of alleles).
This gives at least one point in each category and so provides insurance against a mark-scheme point that the candidate cannot quite recall.
Step-by-Step Reasoning
1. Genetic drift is random, not selective. The first marking point is that drift results from chance events, not natural selection. A useful contrast: in selection, an allele changes in frequency because it helps (or harms) survival or reproduction; in drift, the same allele might rise or fall purely because of who happened to breed.
2. Mechanism. Drift operates through several random events: which gametes fuse at fertilisation, which individuals mate, which individuals die before reproducing, and which new mutations arise. Because these are random, the alleles that end up in the next generation are not necessarily the "best" ones.
3. Loss and fixation of alleles. Over time, drift tends to drive some alleles to a frequency of 0 (lost forever) and others to a frequency of 1 (fixed). The mark scheme credits the loss of alleles and the corresponding increase in homozygosity / decrease in heterozygosity as separate points.
4. Reduced genetic variation. As alleles are lost and others become fixed, the gene pool shrinks. A small gene pool is less able to respond to future environmental change, which is one reason drift can leave a population more vulnerable to extinction.
5. Population size matters. The smaller the population, the larger the effect of drift. In a very large population, the same chance events still occur, but their effects on the overall frequency are swamped by the many other individuals — only in small populations do single chance events noticeably shift the allele frequencies.
6. Founder effect — the starting population is small and non-representative. The founder effect is best understood as a special case of drift that occurs at the moment a new population is established. A few individuals leave the parent population, or are isolated from it, and found a new population somewhere else.
7. The founders carry only a sample of the original alleles. Because only a few individuals are involved, some alleles that were present (even common) in the original population may be absent from the founders. The allele frequencies in the new population therefore do not reflect those in the original — they are, by chance, skewed.
8. A one-off event with lasting consequences. Because the new population grows from these few founders, the unusual allele frequencies established at the start can persist for many generations. The mark scheme allows this as an AVP (additional valid point) to distinguish the founder effect (one-off) from drift (gradual).
A classic example is the high frequency of a particular allele for retinitis pigmentosa among the descendants of a small group of British colonists on Tristan da Cunha: the allele was rare in Britain but became common on the island simply because one of the original settlers happened to carry it.
Key Takeaways
- Genetic drift is the random, non-selective change in allele frequency due to chance events such as random mating, random gamete fusion and random death.
- Drift causes loss of alleles, increased homozygosity, and a smaller gene pool.
- Drift is more pronounced in small populations than in large ones.
- The founder effect is a special case of drift in which a new population is started by a small, non-representative group of individuals; the allele frequencies in the new population are therefore a sample, not a copy, of those in the original.
Common Mistakes
- Describing natural selection instead of drift. Candidates often slip into fitness language ("the best-adapted alleles survive"). This does not earn credit because drift is by definition non-selective. Keep the language strictly about chance.
- Conflating genetic drift with the founder effect. The founder effect is a type of drift, but it has its own distinctive feature: a small sample of individuals starting a new population. Marks are available for stating this specific feature.
- Saying "loss of gene" instead of "loss of allele". The mark scheme explicitly ignores ("I") the phrase "loss of gene". The correct term is allele (a variant of a gene).
- Forgetting the population-size link. The relationship between drift magnitude and population size is one of the most heavily tested ideas. Always state that drift has a larger effect in smaller populations.
- Omitting the founder effect entirely. Because the question names both phenomena, an answer that only covers drift will leave marks on the table.
Things to Be Careful About
- Use the precise term allele throughout, not "gene" or "trait".
- Make clear that the founder effect is a one-off event (a small number of founders establish the new population) whereas general genetic drift is a continuous, gradual process.
- When describing the founder effect, mention that the founding individuals are isolated or have migrated — do not just say "a small number of individuals".
- The mark scheme accepts either a written description or a clear annotated example, but vague statements such as "allele frequencies change" without specifying how or why will not score.
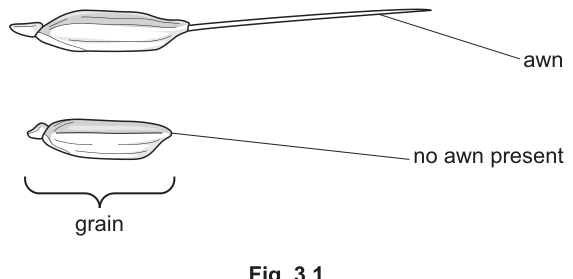
Rice, Oryza sativa, is an important grain crop. A rice grain is a seed and can have a structure known as an awn, which projects from the tip of the grain.
Fig. 3.1 shows a rice grain with an awn present and a rice grain with no awn present.
The development of awns is controlled by two genes: gene and gene . The genes are present on different autosomes. The presence of either dominant allele or dominant allele results in rice plants producing grains with awns.
A cross was carried out between a rice plant that is homozygous dominant for the two genes (double homozygous dominant) and a rice plant that is homozygous recessive for the two genes (double homozygous recessive). All F1 offspring plants produced grains with awns.
Construct a genetic diagram, including a Punnett square, to show the cross that produces the F2 generation, including phenotypes.
State the ratio of the offspring phenotypes produced.
Working
F2-producing cross (F1 × F1): ×
Gametes (from each parent): , , ,
Answer
F2 phenotypic ratio = awn : no awn
15 awn : 1 no awn
Background Concept
In a standard Mendelian dihybrid cross between two heterozygotes ( × ), the F2 phenotypic ratio is , reflecting the independent assortment of two unlinked genes. However, when two genes act on the same trait and one masks or modifies the expression of the other, the ratio deviates from this expectation — this is epistasis.
Several epistatic ratios are recognised:
- 9 : 3 : 4 — recessive epistasis (homozygous recessive at one locus masks the other gene).
- 12 : 3 : 1 — dominant epistasis (a dominant allele at one locus masks the other gene).
- 15 : 1 — duplicate dominant epistasis (a dominant allele at EITHER of two loci is sufficient to produce the dominant phenotype).
- 9 : 7 — duplicate recessive epistasis (recessive phenotype appears only when both loci are homozygous recessive).
For this question, the inheritance is duplicate dominant epistasis: a dominant allele at gene A OR a dominant allele at gene B alone is enough to switch on awn development. Only when an offspring is homozygous recessive at BOTH loci () is the awn phenotype absent.
Understanding the Question
The stem tells us:
- Two unlinked autosomal genes ( and ) control awn development.
- A homozygous dominant parent () crossed with a homozygous recessive parent () gives F1 offspring that all carry grains with awns.
- The F1 must therefore all be (heterozygous at both loci; they have at least one and one , so awns are produced).
- We are asked to construct a genetic diagram with a Punnett square for the cross that produces the F2 generation, and to state the F2 phenotypic ratio.
The cross that produces the F2 is the F1 × F1 cross: × .
Approach
- Write down the parents of the F2 cross: × .
- Determine the four gamete types each parent can produce (independent assortment of two unlinked genes): , , , .
- Build a 4×4 Punnett square containing all 16 possible F2 genotype combinations.
- For each cell, write the genotype and the corresponding phenotype (awn whenever at least one dominant allele is present; no awn only when the genotype is ).
- Count the phenotypes and express the ratio.
Step-by-Step Reasoning
- F2 parents: × (both F1 plants).
- Gametes: each parent produces four gamete types in equal proportions — , , , (ratio ).
- Punnett square (16 cells): each cell receives one allele from each gene from each parent, giving all combinations of the four gametes from each side.
- Phenotype rule: an awn is produced whenever the offspring has at least one allele OR at least one allele. Only the cell with genotype lacks both dominant alleles and therefore has no awn.
- Counting: of the cells contain at least one dominant allele (awn phenotype); cell is (no-awn phenotype).
- Phenotypic ratio: awn : no awn.
Key Takeaways
- The ratio is the signature of duplicate dominant epistasis.
- Two unlinked genes can produce the same phenotype when they share a common downstream pathway (here, awn development).
- The 16-cell Punnett square must be completed in full to see all combinations.
Common Mistakes
- Treating this as a Mendelian dihybrid cross and quoting the ratio.
- Forgetting to write the phenotype alongside each genotype in every cell.
- Stating only that genotypes produce awns without explicitly noting that the 16th () lacks awns.
- Confusing the original P cross ( × ) with the F2-producing cross.
- Mis-identifying the F1 genotype (they are , not or ).
Things to Be Careful About
- The P generation and F1 generation are not the focus — the question asks for the cross that produces the F2.
- All 16 cells of the Punnett square must be completed and each cell must carry both the genotype and the phenotype.
- The ratio should be expressed as a phenotypic ratio ( awn : no awn), not a genotypic one.
Deduce the type of inheritance shown by the ratio of the offspring phenotypes stated in 3(a)(i).
Answer
Epistasis — the F2 ratio is the diagnostic signature of duplicate dominant epistasis, in which a dominant allele at either of two unlinked loci is sufficient to produce the same (awn) phenotype.
(Accept also "autosomal dominant" — the mark scheme credits either term.)
Epistasis
Background Concept
Different F2 phenotypic ratios signal different modes of inheritance:
- — monohybrid cross (one gene).
- — standard Mendelian dihybrid cross (two unlinked genes, independent assortment, no gene interaction).
- , , , — various forms of epistasis (gene interaction).
- Sex-biased ratios (e.g. in a test cross) — sex linkage.
Epistasis is the phenomenon in which the expression of one gene masks or modifies the expression of another gene at a different locus. The ratio is specifically diagnostic of duplicate dominant epistasis, where a dominant allele at either of two loci produces the same phenotype.
Understanding the Question
We must deduce the type of inheritance from the F2 phenotypic ratio of (awn : no awn) obtained in part (a)(i).
Approach
Match the observed ratio () to its corresponding inheritance pattern. The deviation from the Mendelian expectation signals that two genes are interacting to control a single trait.
Step-by-Step Reasoning
- The ratio is , not , so it cannot be a standard independent-assortment dihybrid cross.
- A ratio arises when dominant alleles at either of two loci are each sufficient to produce the same dominant phenotype; this is duplicate dominant epistasis.
- Both genes are on autosomes (stated in the stem), so the inheritance is autosomal, but the unusual ratio specifically indicates gene interaction (epistasis).
Key Takeaways
- A F2 ratio indicates duplicate dominant epistasis.
- Unusual F2 ratios that deviate from signal epistatic interaction between two genes.
Common Mistakes
- Saying only "autosomal dominant" — this would imply a simple ratio in a monohybrid cross and does not by itself explain the ratio.
- Saying "dihybrid" — this describes the type of cross (two genes), not the inheritance pattern.
- Saying "codominance" — codominance produces different ratios and shows both alleles in the phenotype.
Things to Be Careful About
- "Autosomal dominant" is also accepted by the mark scheme, but "epistasis" is more specific and informative about the ratio.
- The mark scheme ignores the term "dihybrid" if given as the answer.
It is common for wild rice plants to have grains with awns present.
Suggest a selective advantage to wild rice of having awns present on their grains.
Answer
Any one from:
- Seed dispersal — awns spread the seeds away from the parent plant (by wind, by attachment to animal fur, or by hygroscopic movement along the ground).
- Protection — the bristly awns deter herbivores / seed predators from eating the grain.
- Anchoring — awns help wedge the grain into the soil / ground so it is not washed or blown away.
- Resource acquisition — awns may help the seed or seedling obtain more nutrients or water (e.g. by trapping dew).
Awns aid seed dispersal / protection / anchoring / nutrient acquisition
Background Concept
A selective advantage is any heritable trait that increases an organism's chances of survival or reproduction in its environment, thereby raising its fitness. In plants, common selective advantages of seed structures include:
- aiding seed dispersal (wind, animal attachment, self-burial),
- avoiding predation by herbivores or seed predators,
- improving anchorage of the seed in a suitable germination site,
- enhancing resource acquisition by the germinating seed or seedling.
Awns are long, slender, bristle-like appendages that project from the tip of grass seeds. In wild grasses they are a very common feature, and several functions have been documented.
Understanding the Question
Wild rice commonly has awns on its grains. The question asks for one selective advantage that awns might confer in the wild (compared with having no awn).
Approach
Think about what awns can physically do — they project from the seed, are rigid and bristle-like, and can interact with the environment (wind, soil, animals). Consider how each of these might help the plant survive or reproduce better than a plant lacking awns.
Step-by-Step Reasoning
- Seed dispersal: long projecting awns catch the wind, attach to passing animal fur, or move by hygroscopic twisting along the ground. This moves seeds away from the parent plant, reducing competition with the parent and with siblings and helping to colonise new habitats.
- Protection: the bristly structure physically deters small herbivores and seed predators from eating the grain.
- Anchoring: when seeds fall to the ground, awns can twist with humidity changes and drill or wedge the seed into the soil, improving contact with moist substrate and protecting the seed from being washed or blown away.
- Resource acquisition: awns have a large surface area that may condense dew or absorb water from light rain, providing moisture for germination.
Key Takeaways
- Awns are not vestigial; they have functional value in the wild.
- Selective advantage = anything that improves survival or reproduction.
- Each suggested function links a structural feature of the awn to an ecological outcome.
Common Mistakes
- Vague answers such as "helps the plant survive" — the mark scheme requires a specific mechanism.
- Confusing the wild advantage with the disadvantage in cultivation (storage and processing difficulty).
- Saying the awns "help pollination" — awns are on the seed after fertilisation, so they are not involved in pollination itself.
Things to Be Careful About
- Only one advantage is required (1 mark), but it must be specific.
- The advantage must relate to wild conditions (dispersal, predation, anchoring), not to farming.
One of the changes that occurred during the domestication of wild rice to cultivated rice was the loss of the awns from rice grains.
Farmers found that long awns made storing and processing rice grains more difficult.
It was also observed that rice plants that have grains with no awns have an increased grain yield.
Answer
- Farmers used artificial selection / selective breeding, with humans acting as the selection pressure.
- They selected rice plants / seeds / grains that had no awns (i.e. with the desired phenotype) to be the parents of the next generation.
- They bred the selected plants together (rice is naturally self-pollinating, so each selected plant self-pollinates to give uniform offspring).
- The seeds germinated and the offspring plants grew; the process of selecting the best (no-awn) plants and breeding from them was repeated over many generations, gradually increasing the frequency of the no-awn alleles in the cultivated rice population.
See working
Background Concept
Selective breeding (artificial selection) is the process by which humans choose individuals with desirable traits and use them as parents for the next generation. Over many generations this increases the frequency of the desired alleles in the population. The principles are:
- Variation must exist in the population for the desired trait.
- Selection of individuals displaying the desired trait (humans act as the selective pressure, replacing the role of the environment in natural selection).
- Breeding between selected individuals.
- Repetition over many generations to amplify the desired trait and reduce the unwanted one.
This is the method by which most modern crop plants and domesticated animals have been produced. In rice, which is naturally self-pollinating, breeding a selected plant automatically produces offspring that are essentially genetically identical at the chosen loci, which speeds up the fixation of the desired trait.
Understanding the Question
Wild rice has awns; cultivated rice has lost them. Farmers observed that long awns made storage and processing difficult, and that awnless plants produced more grain. The question asks how farmers used the principles of selective breeding to produce rice plants whose grains have no awns.
Approach
Apply the four principles of selective breeding to the rice awn trait:
- Identify the variation.
- Choose the desired phenotype (no awns).
- Breed the chosen plants together.
- Repeat over many generations.
Step-by-Step Reasoning
- Farmers noticed variation in awn length among rice plants (some had awns, others had none or very short ones).
- Each generation, they selected the plants whose grains had the least awn (or no awn) as the parents of the next generation.
- They bred these selected plants together. Because rice is a self-pollinating species, each selected plant's seeds carry essentially the same alleles (barring rare mutations), which speeds up the fixation of the no-awn trait.
- The seeds germinated and the offspring plants grew. Among the offspring, the best (no-awn) plants were again selected and the cycle repeated.
- Over many generations, the allele combinations producing awns became rare, and the cultivated rice population became fixed for the no-awn phenotype.
Key Takeaways
- Selective breeding requires variation, selection, breeding and repetition over generations.
- Humans act as the selection pressure (in place of the environment in natural selection).
- The self-pollinating nature of rice makes the process particularly efficient because each selected plant is genetically close to its offspring.
Common Mistakes
- Saying "natural selection" — it is artificial selection driven by human choice.
- Skipping the multi-generation aspect; selective breeding works by cumulative change over many generations.
- Saying only that farmers "chose plants without awns" without mentioning breeding or repetition.
- Confusing selective breeding with genetic modification (they are different techniques).
Things to Be Careful About
- "AVP" in the mark scheme allows credit for additional valid points such as reference to a specific breeding technique (e.g. emasculation and hand-pollination, even though rice is self-pollinating, or testing progeny lines).
- The mark scheme asks for any four of the listed points — provide at least four for full marks.
The normal allele for the gene An-1 codes for a transcription factor that has a role in awn development and in the number of grains of rice produced.
When the transcription factor is present there is:
- an increase in the expression of genes involved in awn development (positive regulation)
- a decrease in the expression of genes involved in the number of grains produced (negative regulation).
Suggest and explain how changes at the An-1 locus can cause rice plants to have grains with no awns and an increased grain yield.
Answer
- A mutation / change in base sequence at the - locus produces a transcription factor with a different primary structure (and therefore a different tertiary / 3D shape), or one that is not produced / is non-functional.
- The altered transcription factor can no longer bind to the promoter / DNA of its target genes.
- As a result, genes involved in awn development are no longer positively regulated, so their expression decreases and no awns are formed.
- At the same time, genes involved in grain number are no longer negatively regulated, so they are expressed more and grain yield increases.
See working
Background Concept
A transcription factor is a protein that binds to specific DNA sequences (typically in the promoter region of a gene) and regulates transcription of target genes. Transcription factors can act as activators (increasing transcription — positive regulation) or as repressors (decreasing transcription — negative regulation).
The - gene codes for a transcription factor with two distinct downstream roles:
- it positively regulates genes needed for awn development,
- it negatively regulates genes that limit grain number.
The primary structure (sequence of amino acids) of a protein determines how it folds into its tertiary / 3D shape, and that shape in turn determines whether the protein can bind to DNA. Mutations that change the base sequence of a gene can therefore change a protein's primary structure, alter its folding, and destroy or modify its function.
Understanding the Question
The question asks us to suggest and explain how changes at the - locus can simultaneously produce two outcomes:
- rice grains with no awns,
- an increased grain yield.
We must connect the molecular event (a change at -) to both phenotypic outcomes.
Approach
Build a logical chain from mutation → protein structure → DNA binding → downstream gene expression → phenotype:
- Mutation at - changes the protein produced.
- The changed protein cannot bind DNA.
- Loss of binding affects both downstream gene sets that - normally regulates.
Step-by-Step Reasoning
- A mutation changes the base sequence of the - gene, or - is not expressed at all.
- The transcription factor therefore has a different primary structure / tertiary structure / 3D shape, or is not produced, or is non-functional.
- Because its shape is altered (or it is missing), the transcription factor can no longer bind to the promoter / DNA of its target genes.
- For genes that - normally activates (awn-development genes), loss of binding means they are no longer switched on, so their expression decreases and the awn phenotype is lost (no awns).
- For genes that - normally represses (grain-number genes), loss of binding means they are no longer switched off, so they are now expressed more (de-repression). Their expression increases and the plant produces more grains per plant.
A single mutational event therefore gives both outcomes, because the same transcription factor regulates both gene sets.
Key Takeaways
- A single regulatory gene can have pleiotropic effects (one gene influencing multiple, apparently unrelated traits).
- Mutations in transcription factors abolish DNA binding, simultaneously removing both their activating and repressing effects.
- Loss of a repressor is not the same as positive activation; removing repression simply allows the gene to be expressed by other factors.
Common Mistakes
- Stating that the transcription factor "is broken" without specifying the structural change (primary → tertiary structure).
- Explaining only one of the two phenotypes (either "no awns" OR "more grains", but not both).
- Saying that - "switches on" grain-number genes — it actually switches them off, so loss of - de-represses them.
- Confusing positive and negative regulation.
Things to Be Careful About
- The mark scheme allows several ways to describe the structural change: "different primary structure", "different tertiary structure / 3D shape", "not produced", or "non-functional / faulty".
- The candidate must explain how the change leads to both phenotypes to score all three marks.
- An alternative valid phrasing is to start with "- is not expressed" — this achieves the same downstream effect of no functional transcription factor.
Sexual reproduction in plants and animals involves:
- the formation of gametes as a result of meiosis
- the process of fertilisation.
In most species of plants and animals, the cell that is formed as a result of fertilisation is diploid and contains homologous chromosomes.
Explain why the cell that is formed as a result of fertilisation is a diploid cell and contains homologous chromosomes.
Answer
Any three from:
- The (diploid) cell is formed from the fusion of two haploid gametes (one from each parent).
- The (diploid) cell has two sets of chromosomes / one set of chromosomes from each gamete.
- The (homologous) chromosomes are maternal and paternal (in origin).
- Homologous chromosomes have the same genes / loci (and similar size, length, centromere position and banding pattern).
The zygote is diploid because it is formed from the fusion of two haploid gametes (one from each parent), giving it two sets of chromosomes — one maternal and one paternal set. Homologous chromosomes are a maternal and a paternal chromosome that pair up and carry the same genes at the same loci.
Background Concept
In sexually reproducing organisms, body (somatic) cells are diploid (): each cell contains two sets of chromosomes, one set inherited from the mother and one from the father. The two chromosomes in a pair — one maternal, one paternal — are called homologous chromosomes (or a homologous pair). They carry the same genes at the same loci, although the alleles they carry may differ. They are also similar in size, length, centromere position and banding pattern.
Gametes, in contrast, are haploid (): they contain only one set of chromosomes. Haploid gametes are produced by meiosis. At fertilisation two haploid gametes (one from each parent) fuse to form a zygote, restoring the diploid number.
Understanding the Question
Part (a) asks for an explanation (3 marks) of two related facts about the cell produced by fertilisation:
- Why it is diploid.
- Why it contains homologous chromosomes.
You need to give clear, mark-scheme-ready points covering both halves of the question.
Approach
Recognise that the two ideas are linked: diploidy is the number of chromosome sets, while homologous describes the relationship between the two chromosomes in each pair. The explanation therefore needs to cover:
- where the two sets come from (gamete fusion),
- what makes the two chromosomes in a pair 'homologous' (origin and shared features).
The mark scheme accepts any 3 of 4 creditable points — select the ones you can phrase most clearly.
Step-by-Step Reasoning
Point 1 — Source of the two chromosome sets. Fertilisation joins two haploid gametes, so the resulting zygote receives chromosomes from both parents. This is what restores the diploid state characteristic of the species.
Point 2 — Two sets of chromosomes. A diploid cell therefore contains two complete sets of chromosomes — one set from the male gamete and one set from the female gamete.
Point 3 — Maternal/paternal origin of each pair. Within each pair, one chromosome is maternal in origin (came from the egg) and the other is paternal (came from the sperm). This pairing of a maternal and a paternal chromosome is what defines them as homologous.
Point 4 — Shared features of homologues. Homologous chromosomes are described as having the same genes at the same loci and being similar in size/length, centromere position and banding pattern. (This point is sometimes tested separately and is a high-yield definition to learn.)
Any three of these four points is enough to earn full marks; in a strong answer you would give all four.
Key Takeaways
- Diploid = two sets of chromosomes (); haploid = one set ().
- The zygote is diploid because two haploid gametes fuse at fertilisation.
- A homologous pair = one maternal + one paternal chromosome, carrying the same genes at the same loci.
- Definitions of 'homologous' that mention only 'similar shape' are not enough — the mark scheme requires shared genes/loci or stated similarity of length, centromere position and banding pattern.
Common Mistakes
- Stating only that the cell is 'formed by fertilisation' without mentioning two haploid gametes — this misses the point about chromosome number.
- Describing homologous chromosomes as merely 'similar' without giving any of the required features (same genes/loci, same length, same centromere position, same banding pattern).
- Conflating 'haploid' with 'half the size of the organism' — haploid refers to chromosome number, not cell or organism size.
Things to Be Careful About
The mark scheme lists 'any three' of four creditable points. If you can give all four cleanly, do so — it costs nothing and protects against ambiguity. Use the precise term 'homologous' rather than 'matching', 'paired' or 'similar'.
State the name of the stage in meiosis when reduction division occurs and explain a reason for your choice.
stage in meiosis ______
reason ______
Answer
Stage: anaphase 1 (or telophase 1)
Reason: this is the stage at which the homologous chromosomes / bivalents separate (and move to opposite poles), so the chromosome number is halved.
Anaphase 1 (or telophase 1) — because it is at this stage that the homologous chromosomes (bivalents) separate, halving the chromosome number.
Background Concept
Meiosis consists of two divisions: meiosis I (the reduction division) and meiosis II (which resembles mitosis). The chromosome number is halved only in meiosis I, when homologous chromosomes (paired up as bivalents during prophase I) are pulled apart and dispatched to opposite poles of the cell. Meiosis II separates sister chromatids and therefore does not further reduce chromosome number — each cell entering meiosis II is already haploid (in chromosome number), although each chromosome still consists of two chromatids.
Understanding the Question
The question asks for the name of the meiotic stage at which reduction division occurs, and a reason for that choice. The answer must combine an identifiable stage with a chromosome-behaviour explanation that justifies the choice.
Approach
Identify the division in meiosis that halves chromosome number, then pinpoint the stage within that division where the actual separation is visible. Then explain why that stage is the reduction-division moment in terms of what is being separated (homologous chromosomes, not sister chromatids).
Step-by-Step Reasoning
- Meiosis I is the reduction division because the chromosome number halves (diploid → haploid) during this division.
- Within meiosis I, the actual separation of the homologues occurs at anaphase 1, when the homologous chromosomes of each bivalent are pulled to opposite poles by the spindle. By telophase 1, the homologues have reached the poles and the cell begins to divide, so telophase 1 is also credited.
- The biological reason this stage reduces chromosome number is that the two members of each homologous pair (one maternal, one paternal) are being separated into different daughter cells, so each daughter cell receives only one of the two homologues of each pair.
- Contrast with meiosis II: here, sister chromatids separate — but each cell already has one chromosome from each homologous pair, so the chromosome number is not reduced further.
Key Takeaways
- Meiosis I = reduction division (chromosome number halves).
- Anaphase 1 / telophase 1 is where the separation of homologous chromosomes is visible.
- The reason it is 'reduction' is that homologues (not sister chromatids) are being separated.
- Meiosis II is NOT a reduction division — even though it superficially looks like mitosis and does separate chromatids, the chromosome number is already at the start.
Common Mistakes
- Writing 'anaphase' without the '1' — this could refer to anaphase 1 or anaphase 2, which are very different events. Always qualify with 1 or 2.
- Stating 'because the cell divides into two' — this is true of every anaphase/telophase, so it does not earn the mark. The reason must specifically mention homologous chromosomes or bivalents.
- Confusing anaphase 1 (homologues separate) with anaphase 2 (sister chromatids separate).
Things to Be Careful About
The mark scheme accepts either anaphase 1 or telophase 1. Either is fine, but the reason must specifically refer to separation of homologous chromosomes / bivalents, not a generic statement about cell division.
Microscope slides can be prepared for viewing with a light microscope to show the different stages of meiosis in plant cells.
In the male reproductive organ of plants, meiosis takes place in cells known as pollen mother cells.
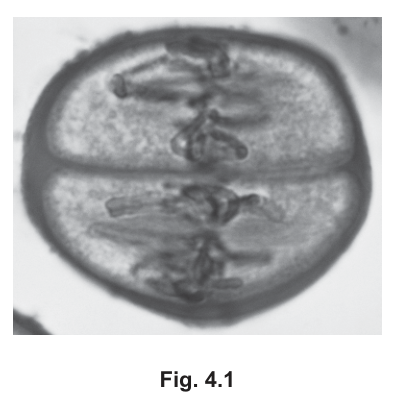
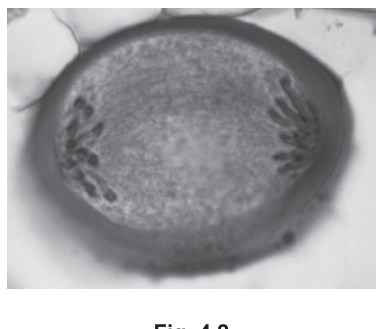
Fig. 4.1 and Fig. 4.2 show photomicrographs of two different stages of meiosis in pollen mother cells from a lily plant, Lilium.
Identify the stages of meiosis shown in Fig. 4.1 and Fig. 4.2.
Fig. 4.1 ______
Fig. 4.2 ______
Answer
Fig. 4.1: metaphase 2 (anaphase 2 also accepted)
Fig. 4.2: telophase 1 (anaphase 1 also accepted)
Fig. 4.1 — metaphase 2 (or anaphase 2). Fig. 4.2 — telophase 1 (or anaphase 1).
Background Concept
Recognising meiotic stages in a photomicrograph relies on three visible features: (1) the shape of the cell (one round cell, or already divided by a cleavage furrow/cell plate into two cells), (2) the arrangement of the chromosomes (scattered, paired as bivalents, lined up at an equator, or gathered at the poles), and (3) what the chromosomes consist of (whether each is still a pair of sister chromatids, or has split into single chromatids).
Key checkpoints:
- Metaphase 1 — bivalents (paired homologues) line up at the equator of a single, undivided cell.
- Anaphase 1 — homologous chromosomes separate and move to opposite poles of a single, undivided cell.
- Telophase 1 — two groups of chromosomes at opposite poles; a cleavage furrow / cell plate forms, dividing the cell into two.
- Metaphase 2 — in each of the two haploid daughter cells, chromosomes (each still consisting of two sister chromatids) line up at the equator.
- Anaphase 2 — sister chromatids separate and move to opposite poles within each haploid cell.
Understanding the Question
You are given two photomicrographs of pollen mother cells from a lily (Lilium) at different meiotic stages. Identify each stage from what you can see. There is no parent stem that changes the meaning of the question, but the in-line description of each figure gives useful clues:
- Fig. 4.1 — chromosomes are aligned in the centre of the cell, and the cell is already divided into two halves by a central line.
- Fig. 4.2 — two distinct groups of chromosomes are visible at the opposite ends (poles) of the cell.
Approach
For each figure, decide:
- Is the cell still one cell, or already split into two? (Tells you whether the stage is before or after cytokinesis I.)
- Are the chromosomes lined up, separating, or at the poles?
- Do the chromosomes look like single chromatids or pairs of sister chromatids? (Distinguishes meiosis I from meiosis II.)
Step-by-Step Reasoning
Fig. 4.1
- The cell is clearly already split into two halves by a central line. This means the stage is after telophase 1 / cytokinesis I — i.e. it is in meiosis II, not meiosis I.
- In each half, the chromosomes are aligned in the middle of the cell (lying along an equator-like line). This is the defining feature of metaphase.
- Putting the two clues together: this is metaphase 2. (If the chromosomes had just begun to separate towards the poles it could equally be called anaphase 2; the mark scheme accepts either.)
Fig. 4.2
- The cell is still a single, undivided cell (no cleavage furrow or cell plate visible between two halves of the cell body). So this is meiosis I, not meiosis II.
- Two groups of chromosomes are clearly visible at opposite poles, but the cell has not yet divided. This is characteristic of anaphase 1 (homologues just arriving at the poles) or telophase 1 (homologues at the poles, cytokinesis about to begin). The mark scheme accepts either; the visual appearance (chromosomes tightly clustered at the two ends of an otherwise empty cell) most closely matches telophase 1.
Key Takeaways
- The single most useful cue for distinguishing meiosis I from meiosis II in a micrograph is whether the cell is one cell or two.
- Within meiosis II, look at chromosome position: lined up = metaphase 2; pulled apart = anaphase 2.
- Within meiosis I, bivalents at equator = metaphase 1; homologues at poles = anaphase 1 / telophase 1.
Common Mistakes
- Calling Fig. 4.1 metaphase 1 — forgetting that the cell is already in two halves, which only happens after meiosis I.
- Calling Fig. 4.2 anaphase 2 or telophase 2 — the cell is still a single cell, so the division cannot yet be at the meiosis II stage.
- Writing 'prophase' for either figure — neither shows the diffuse, thread-like chromatin characteristic of prophase.
Things to Be Careful About
- The mark scheme accepts anaphase 2 as an alternative for Fig. 4.1 and anaphase 1 as an alternative for Fig. 4.2, because the boundary between adjacent stages can be hard to judge from a single still image. Pick the stage you can justify most cleanly from the image.
- Always qualify with 1 or 2 when naming an anaphase or telophase — 'anaphase' alone is ambiguous.
The cells formed at the end of meiosis in a Lilium pollen mother cell each have 12 chromosomes.
State the number of sister chromatids found in a Lilium pollen mother cell at the start of meiosis.
______
Working
- Each cell at the end of meiosis has 12 chromosomes (haploid, ).
- Therefore a Lilium pollen mother cell (diploid) has chromosomes.
- At the start of meiosis, each chromosome has replicated and consists of 2 sister chromatids.
- Total sister chromatids .
Answer
48
48
Background Concept
Before meiosis begins, every chromosome in the cell is replicated during interphase (S-phase). After replication, each chromosome consists of two identical sister chromatids held together at the centromere. So at the start of meiosis (prophase 1), the chromosome number is unchanged (), but the number of DNA molecules — and the number of chromatids — has doubled.
The relationship is:
Understanding the Question
You are told that the four cells produced at the end of meiosis from one Lilium pollen mother cell each have 12 chromosomes. From this you must deduce:
- the diploid chromosome number of the pollen mother cell, and
- the number of sister chromatids present in that cell at the start of meiosis.
Approach
- Use the chromosome number of the meiotic products to work backwards to the diploid number of the starting cell.
- Multiply by 2 because each chromosome consists of 2 chromatids after DNA replication.
Step-by-Step Reasoning
- End of meiosis → 4 cells, each with chromosomes (haploid).
- Therefore the pollen mother cell is diploid with chromosomes.
- At the start of meiosis (after S-phase), each of the 24 chromosomes has been replicated and consists of 2 sister chromatids.
- Total sister chromatids .
Key Takeaways
- The four meiotic products are haploid; the parent cell is diploid ( = twice the haploid number).
- After DNA replication and before meiosis I, each chromosome has 2 sister chromatids, so the number of chromatids is the chromosome number.
- This is a common 'working backwards from gamete number' question — the same logic applies to any species whose gamete chromosome number is given.
Common Mistakes
- Answering 24 (the diploid chromosome number) — this is the number of chromosomes, not the number of sister chromatids.
- Answering 12 — confusing the haploid gamete number with the chromatid count of the parent cell.
- Forgetting the multiplication by 2 for sister chromatids.
Things to Be Careful About
- The question asks specifically for sister chromatids, not chromosomes or DNA molecules. Make sure your final number is the chromatid count.
- Do not divide by 2 anywhere; you are going from the meiotic products back to the starting cell, and the starting cell has more chromatids than the products (because each product has only one chromatid per chromosome after meiosis II, while the starting cell has two).
A number of diseases in humans can be treated using recombinant human proteins. These are produced by recombinant DNA technology.
To produce a human protein for treatment of a disease, recombinant DNA technology needs a gene coding for the particular human protein.
Outline the different ways that can be used to obtain a gene that codes for a human protein.
Answer
Any four from:
- Find the nucleotide / base / gene / DNA sequence from a database / using bioinformatics / from a gene library.
- Make the gene chemically using nucleotides.
- Extract mRNA from cells (that make the protein); use reverse transcriptase (with the mRNA) to make cDNA, then use DNA polymerase (with the cDNA) to make double-stranded DNA.
- Cut out / extract / isolate the gene from DNA using a restriction enzyme.
See working.
Background Concept
A gene is a length of DNA that codes for a polypeptide (or functional RNA). To express a human protein in a non-human host such as Escherichia coli or yeast, a copy of the human gene must first be obtained in a form that can be inserted into the host's DNA. There are several distinct starting points, but they all converge on the same product: a length of double-stranded DNA containing the coding sequence (without introns, if the host is a prokaryote).
Understanding the Question
Part (a) is an "outline" question worth 4 marks. The mark scheme accepts any four of the listed approaches, so the candidate should aim to give a recognisable version of as many distinct methods as possible. The stem makes clear that recombinant DNA technology needs a gene coding for the human protein, so the answers must each describe a different way of obtaining that gene.
Approach
Think of the question as: "In what different ways can a molecular biologist get hold of a copy of the human gene?" There are essentially three families of method:
- Look it up in a database of already-known sequences.
- Build the gene chemically (synthesise it nucleotide by nucleotide).
- Isolate the gene from biological material — either as DNA directly (using restriction enzymes) or by extracting its mRNA and converting it back to DNA.
The mark scheme rewards any four distinct points drawn from these families, so the candidate should aim to cover as many of them as time allows.
Step-by-Step Reasoning
- Method 1 — Bioinformatics / gene library: If the gene has already been sequenced, the nucleotide (base) sequence can be looked up on a database such as GenBank, or found in a cDNA or genomic gene library. This is the most common starting point in modern molecular biology because the human genome has been sequenced.
- Method 2 — Chemical synthesis: A short gene can be made entirely in vitro by chemically joining nucleotides in the desired order, using a DNA synthesiser. This is how short, defined sequences (e.g. small genes or probes) are made.
- Method 3 — mRNA → cDNA: Cells expressing the gene (e.g. pancreatic β-cells for insulin) contain large amounts of the relevant mRNA. The mRNA is extracted, and the enzyme reverse transcriptase uses it as a template to synthesise a single strand of complementary DNA (cDNA). DNA polymerase then converts this to double-stranded DNA. The advantage of this route is that the resulting cDNA contains no introns, so it can be expressed directly in a prokaryotic host.
- Method 4 — Restriction digestion of genomic DNA: A restriction enzyme is used to cut all the DNA in a sample of human cells at its specific recognition sequence, releasing a mixture of fragments. The fragment containing the gene of interest can then be identified (e.g. by hybridisation with a labelled probe) and isolated.
Key Takeaways
- A gene for genetic engineering can be obtained from a database, by chemical synthesis, by reverse transcription of mRNA, or by cutting it out of genomic DNA with a restriction enzyme.
- The cDNA route is the only one that automatically removes introns — important if the host is a prokaryote that cannot splice.
- All routes produce a double-stranded DNA fragment that can be ligated into a vector.
Common Mistakes
- Confusing reverse transcriptase with DNA polymerase: reverse transcriptase makes DNA from an mRNA template; DNA polymerase makes DNA from a DNA template (or extends a primer).
- Saying only "extract the gene" without naming a method — this is too vague to score.
- Omitting the role of bioinformatics, which is a standard feature of modern gene isolation.
Things to Be Careful About
- The mark scheme is "any four from" — there is no need to give all eight points, but covering as many as possible maximises the chance of a full mark.
- "DNA library" and "gene library" are accepted terms; the candidate should not be put off by either wording.
- "Using restriction enzymes" is the creditable detail; simply "cutting the DNA" is too vague.
Diabetes mellitus is a disease in which the blood glucose concentration cannot be controlled. Many people with diabetes mellitus use recombinant human insulin to help control their blood glucose concentration.
Before recombinant human insulin became available, animals were the main source of insulin.
Explain the advantages of using recombinant human insulin to treat diabetes.
Answer
Any three from (ORA for animal insulin):
- Large-scale supply, supply can match demand.
- No / less likely to cause an immune / allergic response, so fewer side-effects.
- Faster to act / smaller dose needed.
- No / less likelihood of (insulin) tolerance developing.
- No / less risk of infection / disease (e.g. from contaminated animal tissue).
- No / less ethical / religious objections; suitable for vegetarians / vegans.
See working.
Background Concept
Before recombinant DNA technology, insulin for treating diabetes mellitus was extracted from the pancreases of pigs and cattle slaughtered for food. The amino-acid sequence of pig and cow insulin is similar to, but not identical to, that of human insulin (e.g. pig insulin differs by one amino acid). This causes clinical problems: the foreign protein can provoke an immune response, supplies were limited by the slaughter industry, and many patients (e.g. vegetarians, vegans, or members of certain religions) found the source unacceptable. Recombinant human insulin is made by inserting the human insulin gene into a microorganism (originally Escherichia coli, now often yeast) and fermenting it on an industrial scale; the protein product has the exact amino-acid sequence of human insulin.
Understanding the Question
Part (b) is a 3-mark "explain" question asking for advantages of recombinant human insulin over animal insulin. The mark scheme explicitly accepts "or reverse argument" (ORA) for animal insulin, so the candidate can frame each point either as a benefit of recombinant insulin or as a drawback of animal insulin. Any three of the listed points will score full marks.
Approach
Think about every practical and clinical difference between treating a patient with a foreign animal protein and treating them with a human-identical protein produced in fermenters. Categories to consider:
- Supply — how much is available, at what cost.
- Immunology — what does the patient's immune system do to it.
- Efficacy — how well it works and how quickly.
- Safety — what other biological material is introduced.
- Ethics — which patients find the source acceptable.
Step-by-Step Reasoning
- Supply and demand: Industrial fermentation of recombinant microorganisms can be scaled up to produce essentially unlimited insulin. Animal-derived insulin depended on the slaughter industry and was vulnerable to shortages and price fluctuations.
- Immune response: Because recombinant human insulin has the identical amino-acid sequence to human insulin, the patient's immune system is much less likely to recognise it as foreign. Pig and cow insulin, with their small sequence differences, sometimes triggered allergic responses or other side-effects.
- Speed of action and dose: Human-identical insulin binds human insulin receptors more efficiently, so it can be faster-acting and may be effective at a smaller dose.
- Tolerance: Long-term exposure to a slightly foreign protein (animal insulin) can lead to the patient developing tolerance — declining responsiveness to the same dose. Recombinant human insulin avoids this.
- Infection risk: Animal tissue carries a small risk of transmitting pathogens (e.g. prions, viruses). Recombinant insulin produced in a defined fermenter is much purer and safer.
- Ethics and religion: Insulin from pigs is unacceptable to Muslims and Jews, and to vegetarians and vegans. Recombinant insulin made by microorganisms has none of these objections.
Key Takeaways
- Recombinant human insulin is identical in sequence to endogenous human insulin, so it is better recognised, less immunogenic, and acts more reliably.
- Microbial fermentation provides a virtually unlimited, consistent supply independent of the meat industry.
- It avoids the ethical and religious objections associated with pig- and cow-derived insulin.
Common Mistakes
- Saying only "it is cheaper" or "it is purer" without elaborating on the clinical or supply consequences.
- Treating "no allergic response" as a single point but then failing to give two further distinct advantages — the mark scheme is "any three from", so breadth is needed.
- Forgetting that "faster to act" and "smaller dose" are both clinical efficacy points and are credited separately.
Things to Be Careful About
- The command word is "explain", not "state". Each point should make the advantage (and ideally why it arises) explicit, not just assert it.
- ORA (or reverse argument) means that phrasing each point as a drawback of animal insulin is also acceptable.
- The candidate does not need to cover all six points — three clear, distinct points earn full marks.
Explain why the DNA involved in the production of recombinant human insulin is termed recombinant DNA.
Answer
It is DNA from two different sources joined together (e.g. the human insulin gene joined to bacterial / plasmid DNA).
It is DNA from two different sources (joined together).
Background Concept
The word recombinant literally means "combined again". In molecular biology, recombinant DNA is any DNA molecule that has been formed by joining together DNA from two different sources. The classic example is a piece of human DNA (e.g. the insulin gene) inserted into a bacterial plasmid; the resulting plasmid is a recombinant DNA molecule because it contains DNA from two different species.
Understanding the Question
Part (c) is a 1-mark "explain" question. The candidate is being asked to justify the name "recombinant" DNA. One clear sentence that names both the two sources and the joining is sufficient.
Approach
Break the word "recombinant" down: it comes from the verb "to recombine" — to combine again or in a new way. DNA from two different origins has been combined into a single molecule, hence "recombinant". In the context of producing human insulin, the two sources are: (i) the human gene (human DNA), and (ii) the plasmid / bacterial DNA used as the vector.
Step-by-Step Reasoning
- The DNA used in the production of recombinant human insulin is not solely human and not solely bacterial — it is a hybrid.
- Specifically, the human insulin gene has been joined to a bacterial plasmid (or to other bacterial DNA used as a vector).
- Because it is a combination of DNA from two different sources, it is termed "recombinant".
Key Takeaways
- "Recombinant DNA" = DNA from two different sources joined together.
- The two sources in this question are: (a) the human insulin gene and (b) the bacterial plasmid / vector.
- This definition applies to all recombinant DNA molecules, not just insulin.
Common Mistakes
- Saying only "it is a combination of DNA" — this misses the "from two different sources" qualification that the mark scheme requires.
- Naming only one source (e.g. "DNA from bacteria") and not making it clear that the other source is human.
- Confusing "recombinant DNA" with "DNA replication" — replication produces identical copies, not combinations of different sources.
Things to Be Careful About
- This is a one-mark question demanding one precise point, not an essay.
- The mark scheme accepts either of the two phrasings: "DNA from two different sources joined together" OR "DNA from the human gene joined to DNA from bacteria / plasmid".
Recombinant human insulin analogues are insulin proteins that have slightly altered amino acid sequences compared with recombinant human insulin. These analogues can be more effective than human insulin.
Synthetic genes coding for insulin analogues have been developed. The bacterium Escherichia coli can be used as a host for a synthetic gene for the large-scale manufacture of an analogue.
When scientists have determined the changes that are needed to produce an insulin analogue, they can obtain a synthetic gene coding for the analogue by making changes to a length of DNA using genetic engineering.
Suggest how scientists genetically engineer a synthetic gene coding for the insulin analogue and explain how the changes they make allow the correct analogue to be produced.
Answer
Any four from:
- Find the nucleotide / base / gene / DNA sequence (of the human insulin gene) from a database / using bioinformatics / from a gene library.
- Use gene editing (e.g. CRISPR / Cas9).
- Insertion / deletion / replacement of nucleotide(s) at specific sites (of the gene).
- (Results in) changes to the DNA triplet / codon.
- (So that the altered codon codes for) a different amino acid, producing the desired insulin analogue.
- AVP e.g. detail of CRISPR / Cas9 mechanism.
See working.
Background Concept
An insulin analogue is a modified version of human insulin with one or a few amino acids changed. These small changes are engineered to alter the protein's properties — for example, making it faster-acting (lispro, aspart) or longer-acting (glargine, detemir) — so that patients can better control their blood glucose around meals or overnight. Because the change is precisely defined at the protein level, the corresponding change must be made precisely at the DNA level. The genetic code is read in non-overlapping triplets of nucleotides (codons), each specifying one amino acid; a single nucleotide change can therefore change one codon, and therefore one amino acid, in the final protein.
Gene editing refers to a set of techniques that allow scientists to make specific, targeted changes to a DNA sequence at a chosen location. The most widely used is CRISPR/Cas9, in which a short guide RNA directs the Cas9 nuclease to a specific DNA sequence, where it makes a double-strand break. The cell's own repair machinery then either joins the broken ends (often introducing small insertions or deletions) or, if a template DNA is supplied, uses that template to repair the break, allowing precise nucleotide replacement.
Understanding the Question
Part (d) is a 4-mark "suggest and explain" question. The stem tells the candidate that scientists have already decided what amino acid changes are needed to make the analogue; the question is how they then construct a synthetic gene encoding that analogue by making changes to a length of DNA, and how those DNA changes give rise to the correct protein. The candidate must therefore cover both the technique (gene editing) and the mechanism (codon → amino acid → protein).
Approach
Approach the question in two stages:
- How is the gene obtained and edited? Look up the normal human insulin gene sequence, then use a gene-editing tool (e.g. CRISPR/Cas9) to insert, delete or replace nucleotides at defined points in the sequence.
- How does the DNA change produce the analogue? Because the genetic code is read three bases at a time, changing a nucleotide alters a specific codon; the altered codon now codes for a different amino acid; the ribosome translates the modified mRNA into the desired insulin analogue.
Step-by-Step Reasoning
- Step 1 — Obtain the starting sequence: Find the nucleotide / base sequence of the human insulin gene. This information is already in a database (e.g. GenBank) or a gene library.
- Step 2 — Make the targeted change: Use gene editing (e.g. CRISPR/Cas9) to introduce an insertion, deletion or replacement of nucleotides at the specific sites in the gene that the scientists have decided to alter. The guide RNA targets the nuclease to the precise location; a supplied DNA template carries the new sequence for a replacement.
- Step 3 — From DNA to protein: The change in nucleotide sequence changes the DNA triplet (codon) at that point. Because each codon specifies one amino acid, the new codon codes for a different amino acid.
- Step 4 — The final product: When the modified gene is expressed in Escherichia coli, the ribosome translates the modified mRNA into the desired insulin analogue, with the engineered amino acid substitution(s).
- Step 5 — AVP: Credit can be earned for any further valid detail, such as a specific feature of CRISPR/Cas9 (e.g. the role of the guide RNA, the protospacer adjacent motif, or the use of a repair template for precise replacement).
Key Takeaways
- A synthetic gene is built by starting from a known sequence and using gene editing to introduce precise nucleotide changes.
- CRISPR/Cas9 is the current method of choice for targeted gene editing because of its specificity and ease of use.
- A single nucleotide change can change a single codon, and therefore a single amino acid, in the final protein — this is the molecular basis of insulin analogue design.
- The link gene → mRNA codon → amino acid → protein structure is the central explanatory chain for this part.
Common Mistakes
- Describing gene editing in vague terms without saying what is being done at the DNA level (insertion, deletion or replacement of nucleotides).
- Failing to make the codon → amino acid link, which is the central "explain" element of the question.
- Confusing gene editing (changing an existing sequence at a specific site) with restriction enzyme cutting (which is not site-specific in the same way).
- Saying that the bacteria "learn" the new sequence, or any other teleological language — bacteria do not learn; they are transformed with a plasmid carrying the modified gene.
Things to Be Careful About
- The mark scheme is "any four from", so breadth and accuracy across the chain of reasoning is what earns marks, not a single long paragraph.
- The question is about a synthetic gene for an analogue, not about a new gene from another species, so the appropriate technique is gene editing, not cDNA synthesis or database retrieval alone.
- AVP allows credit for relevant detail of the editing tool (e.g. guide RNA in CRISPR/Cas9), which is good use of the fourth mark.
Guard cells are located in the epidermis of the leaves of most plants. When environmental conditions change, this causes changes in guard cells that control the opening and closing of stomata.
Answer
Any four from:
- Variable thickness of the cell wall (thicker on the side next to the stoma, thinner on the outer side)
- No plasmodesmata between guard cells and surrounding epidermal cells
- Many chloroplasts / many mitochondria
- Chloroplasts have few grana (and few thylakoids)
- Mitochondria have many cristae
- Cell surface membrane often folded / has many transport proteins
- Cellulose microfibrils arranged in bands (radially around the cell)
See working
Background Concept
Guard cells are highly specialised epidermal cells that flank each stoma and control its aperture. Unlike the other epidermal cells that lie flat and tightly packed around them, guard cells have a distinctive kidney (or dumb-bell in grasses) shape, with unevenly thickened walls. Their structure is the structural basis for the way they open and close the pore: when the guard cell takes in water and becomes turgid, the thinner outer wall stretches more than the thickened inner wall, pulling the two guard cells apart and bending them so that the pore opens. Because stomata control the balance between CO₂ uptake for photosynthesis and water loss by transpiration, the special features of guard cells reflect both their ion-pumping role and their photosynthetic activity.
Understanding the Question
This is a 4-mark "describe" question asking for the structural features of guard cells. The mark scheme credits any four distinct points, so the candidate should aim to give as many precise, observable features as possible from memory. "Describe" requires factual statements of structure (and any implied function is acceptable only where the mark scheme makes it a creditable point).
Approach
Read the mark scheme as a menu of acceptable points: variable wall thickness; absence of plasmodesmata; abundance of chloroplasts/mitochondria; chloroplasts with few grana; mitochondria with many cristae; folded membrane with many transport proteins; cellulose microfibrils in radial bands. Choose the ones you can phrase most precisely.
Step-by-Step Reasoning
- Variable wall thickness – The wall on the side of the stoma (ventral wall) is much thicker than the wall on the outside (dorsal wall). This is the key feature that allows the asymmetric bending that opens the pore. Stating "thicker on the inner side" is more precise than just "thick wall".
- No plasmodesmata – Guard cells are isolated from neighbouring epidermal cells; ions and water must cross the cell surface membrane rather than moving through plasmodesmata. This is why active transport across the plasma membrane is so central to stomatal movement.
- Many chloroplasts – Unlike most epidermal cells, guard cells photosynthesise actively. Photosynthesis provides ATP for the H⁺/K⁺ pumps and contributes to the blue-light response that opens stomata.
- Chloroplasts with few grana – Guard cell chloroplasts have less well-developed thylakoid stacks (few grana), reflecting that photosynthesis here is geared to producing energy locally rather than running the full Calvin cycle.
- Mitochondria with many cristae – A high surface area of inner mitochondrial membrane supports the large ATP demand of the H⁺ pumps that drive ion accumulation.
- Folded / transport-protein-rich membrane – The plasma membrane is thrown into folds or is densely populated with transport proteins (H⁺-ATPases, K⁺ channels, anion channels), again to support rapid ion fluxes.
- Cellulose microfibrils in bands – The cellulose microfibrils run radially (like belts) around the cell, so when turgor increases the cell lengthens but cannot expand sideways; this forces the two guard cells to bow apart.
Key Takeaways
- Guard cells combine photosynthetic (chloroplasts), energy-generating (mitochondria) and ion-pumping (folded, transporter-rich membrane) features.
- The unique mechanical behaviour that opens the stoma comes from the unevenly thickened wall combined with radially banded cellulose microfibrils.
- Guard cells are symplastically isolated — every solute and water movement crosses the plasma membrane.
Common Mistakes
- Saying only "kidney-shaped" or "bean-shaped" without giving the reason (variable wall thickness / radial cellulose) — these are worth marks but should not be the only points.
- Confusing guard cell chloroplasts with mesophyll chloroplasts — guard cell chloroplasts have few grana, not many.
- Forgetting to mention plasmodesmata are absent; some candidates say guard cells have plasmodesmata because they "connect" with each other.
- Listing generic epidermal features (e.g. "no chloroplasts") that are true of other epidermal cells but not of guard cells.
Things to Be Careful About
- The mark scheme allows any four, so the safest strategy is to write 4–5 different points rather than spending time elaborating one.
- Avoid vague phrasing such as "have a thick wall" — the precise description is unevenly thickened (thicker on the inside).
- Mentioning function is acceptable only where the mark scheme makes the structural point sufficient; do not pad with statements about "opening the stoma" unless paired with the structural fact.
Stomata have daily rhythms of opening and closing.
Fig. 6.1 shows the percentage of stomata open at different times of the day, over a period of three days, in the thale cress plant, Arabidopsis thaliana.
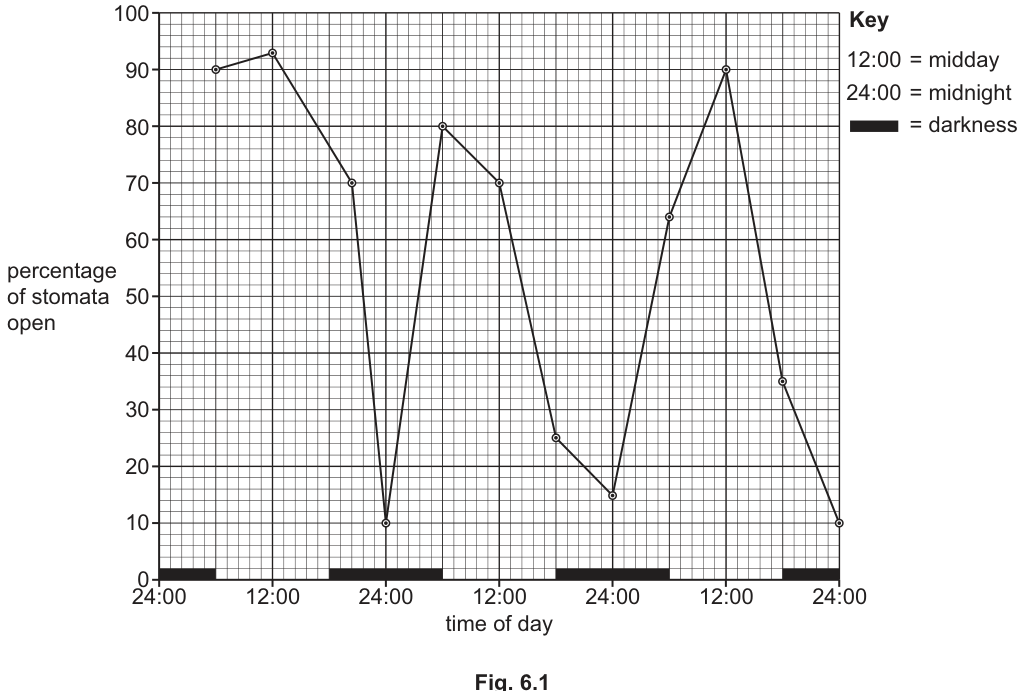
Answer
- (More) stomata are open at (mid)day and (more) stomata are closed at (mid)night / in darkness (ora).
- Data quote: at 12:00 around 90% of stomata are open, whereas at 24:00 only about 10–15% of stomata are open. (any paired times and percentages)
See working
Background Concept
Stomatal opening is not simply a passive response to light; even under constant conditions many plants show a circadian rhythm of opening and closing. In Arabidopsis, as in most C3 plants, stomata reach maximum aperture near midday (favouring CO₂ entry for photosynthesis) and are largely closed around midnight (reducing water loss when photosynthesis is not occurring). The rhythm in Fig. 6.1 is a classic illustration of this endogenous daily cycle.
Understanding the Question
This is a 2-mark "describe the rhythm" question that must be supported by reference to Fig. 6.1. Mark 1 is for a clear statement of the trend; mark 2 is for a paired data quote (two times of day with their corresponding percentages, read from the graph to ±0.5). A simple "they open during the day" without numbers scores only the trend mark.
Approach
First describe the overall pattern in words, then back it up with two paired readings. The trend is a daily oscillation, peaking at midday and troughing at midnight. Quote roughly 90% at 12:00 and 10–15% at 24:00.
Step-by-Step Reasoning
- Trend statement — More stomata are open at (mid)day, and more stomata are closed at (mid)night / in darkness. The pattern repeats each day, so it is a daily rhythm. (ora = reverse argument: open at night and closed during day would not fit this graph and would not score.)
- Data quote — Pick two times with clearly different values. At 12:00 the percentage is about 90% on the second peak (and ~93% on the third peak), while at 24:00 the percentage is about 10–15%. Any pair that contrasts day and night (e.g. 12:00 ≈ 90% vs 24:00 ≈ 10%) earns the second mark.
Key Takeaways
- "Describe with reference to" demands both a trend and supporting numbers.
- Stomatal rhythms are an example of a circadian, endogenously driven biological rhythm.
- The dark bars at the bottom of Fig. 6.1 confirm that stomata close in darkness, linking the rhythm directly to the light/dark cycle.
Common Mistakes
- Saying "stomata open and close every day" without specifying when each occurs.
- Giving only one number (one time of day), which doesn't earn the paired-quote mark.
- Quoting numbers to more precision than the graph supports (e.g. "92.4%") — the mark scheme accepts ±0.5, but quoting impossible precision suggests you didn't read the graph.
- Calling it a "yearly rhythm" or "seasonal rhythm" — the x-axis spans three days, so it is a daily (circadian) rhythm.
Things to Be Careful About
- The graph's y-axis is the percentage of stomata open, not the size of each individual aperture. Be careful not to confuse the two.
- The peaks reach roughly 90% and the troughs about 10–15%; both regions are well separated and clearly outside the same error band.
Suggest other environmental factors, apart from the time of day, that can contribute to stomatal closure.
Answer
Any two from:
- Water stress / drought
- High temperature
- Low humidity / dry atmosphere
- High carbon dioxide concentration in the leaf (air spaces)
- Low light intensity
- High wind speed
See working
Background Concept
Stomatal aperture is a compromise between the plant's need to take in CO₂ for photosynthesis and its need to conserve water. The plant therefore responds to a range of environmental cues that signal either "open" (light, low internal CO₂, humid air) or "close" (drought, high temperature, dry wind, high internal CO₂, darkness). These cues converge on the same ionic machinery in guard cells, with abscisic acid (ABA) acting as the key stress hormone that triggers closure.
Understanding the Question
The question asks for additional environmental factors — apart from time of day — that contribute to stomatal closure. The mark scheme credits any two from a list of six, so the safest strategy is to write two distinct, biologically credible factors.
Approach
Think of conditions that reduce the plant's need or ability to keep stomata open. Anything that increases transpiration rate faster than the plant can replace water, anything that signals darkness, or anything that raises the internal CO₂ concentration will close stomata.
Step-by-Step Reasoning
- Water stress / drought – When the roots detect drying soil, ABA is released from the roots and leaves; ABA triggers the ion efflux that closes stomata. This is the most biologically important closure signal in nature.
- High temperature – Increases the vapour pressure deficit between leaf and air, accelerating transpiration. The plant closes stomata to limit water loss.
- Low humidity / dry atmosphere – A larger leaf-to-air water potential gradient drives faster transpiration; the plant closes stomata to slow water loss.
- High internal CO₂ concentration – High CO₂ in the leaf air spaces (e.g. when photosynthesis is limited by another factor or when mesophyll cells cannot use CO₂ fast enough) signals stomata to close via a cGMP-related pathway in guard cells.
- Low light intensity – In dim light the value of opening stomata (for photosynthesis) falls; stomata close.
- High wind speed – Rapid air movement strips the humid boundary layer from the leaf surface, again increasing transpiration, and stomata close.
Key Takeaways
- Stomatal closure is a protective response to conditions that threaten water balance, not just a response to darkness.
- ABA is the unifying hormonal mediator, but the triggers are many and varied.
- Each factor must be phrased precisely: "water stress" or "drought", not just "water".
Common Mistakes
- Writing "cold temperature" or "rain" — these are not on the mark scheme and are not typically closure signals.
- Writing "no light" instead of "low light intensity" — the question already specifies "apart from time of day", and darkness is essentially the same thing. Pick a different factor.
- Saying "no water" instead of "water stress / drought" — the precise biological term matters.
Things to Be Careful About
- "Suggest" means there is more than one acceptable answer; pick two that you can justify briefly if asked.
- Avoid factors internal to the plant (e.g. "abscisic acid") — the question asks specifically for environmental factors.
Table 6.1 shows some of the events occurring during the closure of a stoma.
The events are not listed in the correct order.
Table 6.1
| event | description of event |
|---|---|
| A | water leaves the guard cells by osmosis |
| B | active transport of hydrogen ions out of the guard cells stops |
| C | stoma closes |
| D | plant is subjected to a change in environmental conditions |
| E | plant releases abscisic acid |
| F | calcium ions move into the cytoplasm of the guard cells |
| G | abscisic acid binds to receptors on the cell surface membrane of guard cells |
| H | guard cells become flaccid |
| I | water potential of the guard cells increases |
| J | potassium ions leave the guard cells |
Complete Table 6.2 to show the correct order of the events shown in Table 6.1.
Three of the events have been completed for you.
Table 6.2
| correct order | letter of event |
|---|---|
| 1 | D |
| 2 | |
| 3 | |
| 4 | |
| 5 | F |
| 6 | |
| 7 | |
| 8 | |
| 9 | |
| 10 | C |
Answer
| correct order | letter of event |
|---|---|
| 1 | D |
| 2 | E |
| 3 | G |
| 4 | B |
| 5 | F |
| 6 | J |
| 7 | I |
| 8 | A |
| 9 | H |
| 10 | C |
1 D, 2 E, 3 G, 4 B, 5 F, 6 J, 7 I, 8 A, 9 H, 10 C
Background Concept
Stomatal closure in response to drought is driven by the plant hormone abscisic acid (ABA). When the plant senses water stress (e.g. via root-sensed drying soil), ABA is synthesised and released, particularly from the roots and the mesophyll. ABA binds to receptors on the guard cell plasma membrane, triggering a chain of ion movements: H⁺ pumping stops, Ca²⁺ enters the cytoplasm, K⁺ (and accompanying anions) leave the guard cells, the solute concentration falls, water potential rises (becomes less negative), water leaves by osmosis, the guard cells become flaccid, and the stoma closes. This sequence converts an external stress signal into a mechanical change in guard cell shape.
Understanding the Question
Table 6.1 lists ten events labelled A–J in random order. The candidate must place nine of them (positions 2, 3, 4, 6, 7, 8, 9 are blank) in the correct sequence between D (position 1) and C (position 10). The mark scheme splits the task into two halves: events between D and F (the ABA signalling arm) and events between F and C (the ion/water/mechanical arm). To score 4 marks, both halves must be in the correct internal order.
Approach
First think of the pathway as four linked phases:
- Stress signal and hormone release (D, G, with E for ABA release).
- Membrane and calcium signalling (B = H⁺ pump stops; F = Ca²⁺ entry — F is fixed in position 5).
- Ion efflux and osmotic consequences (J = K⁺ leaves; I = water potential rises; A = water leaves by osmosis).
- Mechanical outcome (H = flaccid; C = stoma closes — C is fixed in position 10).
Use the fixed anchors (D at 1, F at 5, C at 10) to anchor each half.
Step-by-Step Reasoning
First half (between D and F):
- D = stress stimulus (water deficit).
- E = the plant releases ABA in response to the stress.
- G = ABA binds to receptors on the guard cell plasma membrane.
- B = active transport of H⁺ out of guard cells stops (because ABA signalling switches off the H⁺-ATPase).
- F (position 5, given) = Ca²⁺ moves into the cytoplasm.
This gives the order: D → E → G → B → F.
Second half (between F and C):
- F = Ca²⁺ entry triggers downstream events.
- J = K⁺ leaves the guard cells (down their electrochemical gradient through Ca²⁺-activated anion channels).
- I = water potential of the guard cells becomes less negative (increases) because the solute concentration has dropped.
- A = water leaves the guard cells by osmosis, down the water potential gradient.
- H = the guard cells become flaccid (lose turgor).
- C (position 10, given) = the stoma closes because the flaccid guard cells no longer push it open.
This gives the order: F → J → I → A → H → C.
Mark-scheme check:
- "E G B between D and F" — correct (E, G, B are placed in that order between D and F).
- "E G B in correct order throughout table" — correct.
- "J I A H between F and C" — correct (J, I, A, H are placed in that order between F and C).
- "J I A H in correct order throughout table" — correct.
All four marking points earned.
Key Takeaways
- ABA is the central hormonal trigger that closes stomata during water stress.
- The closure pathway has two clearly distinct phases: a signalling phase (ABA → receptors → H⁺ pump off → Ca²⁺ entry) and a mechanical phase (K⁺ efflux → water potential rises → osmotic water loss → flaccidity → closure).
- "Water potential increases" means it becomes less negative (closer to zero), which is the same as the solute concentration falling.
- The mark scheme rewards ordering in each half, so even if you swap one step within a half you lose all marks for that half.
Common Mistakes
- Putting J (K⁺ leaves) before B (H⁺ pump off). K⁺ efflux is downstream of the H⁺ pump switching off, not upstream.
- Putting I (water potential increases) before J (K⁺ leaves). The ion efflux is the cause; the water potential change is the consequence.
- Putting H (flaccid) before A (water leaves by osmosis). Flaccidity follows water loss; you cannot be flaccid before losing the water.
- Confusing "water potential increases" with "becomes more negative". In the strict physical sense, an increase in Ψ (towards 0) corresponds to a fall in solute concentration; this is the direction that drives water out of the guard cell.
- Swapping E (ABA release) and G (ABA binds to receptors): release must precede binding.
Things to Be Careful About
- The question tests order, not detailed reasoning; the safest strategy is to memorise the canonical sequence.
- "Water potential of the guard cells increases" = it becomes less negative (less solute, more dilute sap).
- "Flaccid" is the correct mechanical term; do not write "shrink" or "collapse".
- Anchor on the fixed events (D, F, C) to reduce the chance of transposition errors.
An axon membrane is described as being at its resting potential when an action potential is not occurring.
Describe and explain how a resting potential of an axon membrane is maintained.
Answer
- The (axon) membrane contains sodium–potassium (Na⁺/K⁺) pumps.
- These pumps actively transport Na⁺ out of the axon and K⁺ into the axon (using ATP), moving 3 Na⁺ out for every 2 K⁺ in.
- This sets up an electrochemical gradient (concentration gradient and electrical gradient) across the membrane.
- The membrane is more permeable to K⁺ than to Na⁺ (it has more K⁺ channels open at rest).
- K⁺ ions therefore diffuse back out of the axon down their concentration gradient through (open) channel proteins.
- More K⁺ moves out than Na⁺ moves in, so the outside becomes positively charged and the inside becomes negatively charged relative to the outside.
- Large negatively-charged ions / anions (e.g. proteins) are fixed inside the axon and cannot leave, contributing to the negative interior.
- The result is a resting membrane potential of about −60 mV to −70 mV (inside negative).
See working
Background Concept
The resting potential is the electrical potential difference across the membrane of a neurone when it is not firing an action potential. The inside of the axon is about 60–70 mV more negative than the outside, typically quoted as −70 mV. This potential is not produced by the membrane in isolation; it is the combined result of two factors: an ion concentration gradient set up by active transport, and a differential permeability of the membrane to those ions.
Key structures involved:
- Sodium–potassium (Na⁺/K⁺) pumps — carrier proteins in the axon membrane that hydrolyse ATP to move 3 Na⁺ out of the axon and 2 K⁺ in, against their respective concentration gradients.
- Voltage-gated and leak channels — transmembrane proteins that allow ions to diffuse down their gradients. At rest the membrane is much more permeable to K⁺ than to Na⁺ because more K⁺ leak channels are open.
- Fixed anions — large negatively charged molecules (e.g. proteins, organic phosphates) trapped inside the axon that cannot cross the membrane; they contribute directly to the net negative charge of the cytoplasm.
The key idea is that the Na⁺/K⁺ pump creates the gradients, and the differential permeability (mainly K⁺ efflux through leak channels) turns those gradients into a measurable potential difference.
Understanding the Question
Part (a) is a 6-mark "describe and explain" question about the resting potential. The command word describe requires the candidate to state what is present (the structures and processes), while explain requires the candidate to say why those structures produce a negative resting potential. Six marks means six creditable points are needed.
Approach
Build the answer in two layers:
- Active transport layer — name the Na⁺/K⁺ pump, the ions it moves, the ratio (3 Na⁺ out : 2 K⁺ in), and the fact that it uses ATP. This generates the concentration gradients.
- Diffusion / permeability layer — note that the membrane is more permeable to K⁺ at rest, so K⁺ diffuses out, the inside becomes more negative than the outside, and the result is around −70 mV. Mention the fixed anions as a contributor to the net negative interior.
Step-by-Step Reasoning
- The Na⁺/K⁺ pump is a carrier protein in the axon membrane. It is the only structure that can move ions against their concentration gradients, and it does so using energy from ATP hydrolysis (active transport).
- For each cycle it exports 3 Na⁺ out of the axon and imports 2 K⁺. This unequal movement means the pump alone makes the outside slightly more positive than the inside — but the bigger effect is that it builds up very high extracellular Na⁺ concentration and very high intracellular K⁺ concentration.
- These gradients are electrochemical gradients: there is both a concentration difference and a charge difference driving each ion across the membrane.
- At rest the membrane is much more permeable to K⁺ than to Na⁺, because many more K⁺ leak channels are open than Na⁺ leak channels.
- K⁺ therefore diffuses out of the axon down its concentration gradient, carrying positive charge out.
- Because more positive charge leaves (K⁺) than enters (a small amount of Na⁺), the inside becomes negative relative to the outside.
- Fixed anions inside the cell (negatively charged proteins and organic phosphates that cannot cross the membrane) attract K⁺ back in, but the pump keeps replacing the K⁺ that has leaked out — so the negative interior is maintained dynamically.
- The combined result is a stable resting potential of about −60 mV to −70 mV.
Key Takeaways
- The Na⁺/K⁺ pump creates the concentration gradients; differential permeability (mostly K⁺ efflux) converts them into a potential difference.
- The 3:2 stoichiometry of the pump contributes directly to a net loss of positive charge from the axon.
- The membrane is never completely impermeable to Na⁺; a small inward Na⁺ leak continually opposes the resting potential, which is why the pump must keep working.
- Fixed anions inside the axon are essential to explaining why the inside is negative.
Common Mistakes
- Saying "sodium ions diffuse in" instead of "sodium–potassium pump moves sodium ions out". Diffusion alone cannot maintain the gradient against leakage.
- Omitting the fact that ATP is required (active transport).
- Forgetting the 3 Na⁺ : 2 K⁺ ratio; this ratio is one of the marking points and explains the net loss of positive charge from the cell.
- Stating "membrane is impermeable to sodium" — it is not; it is less permeable to Na⁺ than to K⁺.
- Confusing the direction of ion movement during the resting state with the action potential (Na⁺ in / K⁺ out happens during the action potential, not at rest).
Things to Be Careful About
- "Describe and explain" demands both the what and the why. A list of structures without an explanation of how they generate the −70 mV will lose marks.
- Use the term electrochemical gradient (not just "concentration gradient") when referring to the combined electrical and chemical driving forces.
- The phrase "more K⁺ moves out than Na⁺ moves in" is the standard way to express the differential-permeability argument; it is one of the explicit marking points.
Hypokalaemia is a condition in which there is a low concentration of potassium ions () in the body. This can affect nervous coordination.
Fig. 7.1 shows a normal action potential and Fig. 7.2 shows an action potential of a person with hypokalaemia.
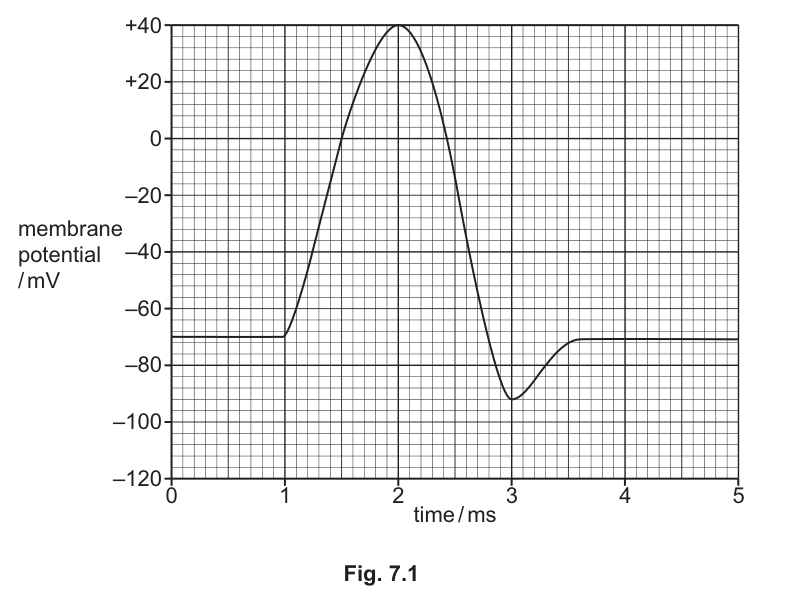
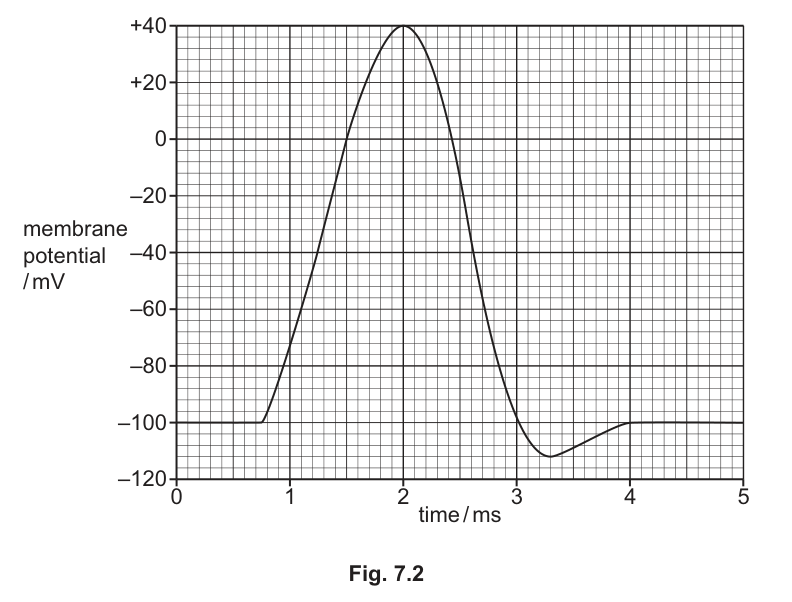
With reference to Fig. 7.1 and Fig. 7.2, describe the differences between a normal action potential and an action potential of a person with hypokalaemia.
Answer
- Resting potential is more negative in hypokalaemia (−100 mV) than normal (−70 mV).
- The action potential is longer in duration in hypokalaemia (~3.25 ms from start of depolarisation to end of hyperpolarisation) than normal (~2.6 ms).
- The hyperpolarisation is more negative in hypokalaemia (≈ −112 mV) than normal (≈ −90 mV), so the refractory period is longer in hypokalaemia.
- The depolarisation is larger in hypokalaemia (140 mV) than normal (110 mV), because the resting potential is lower but the peak is the same (+40 mV).
See working
Background Concept
An action potential is a transient reversal and restoration of the membrane potential caused by the opening and closing of voltage-gated Na⁺ and K⁺ channels. Its key phases are:
- Depolarisation — voltage-gated Na⁺ channels open, Na⁺ rushes in, the membrane potential rises rapidly (in the graphs from the resting value up to about +40 mV).
- Repolarisation — Na⁺ channels inactivate and voltage-gated K⁺ channels open, K⁺ leaves, the membrane potential falls back.
- Hyperpolarisation — K⁺ channels close slowly, so K⁺ continues to leave briefly, dragging the potential below the resting value before the Na⁺/K⁺ pump and leak channels restore the resting potential.
- Refractory period — the interval during which another action potential cannot be triggered easily; it overlaps the repolarisation and hyperpolarisation phases.
The concentration of K⁺ in the body fluid affects the gradient for K⁺ movement. In hypokalaemia, blood K⁺ is low, so the gradient favouring K⁺ efflux from the axon is steeper.
Understanding the Question
Part (b)(i) is a 3-mark "describe" question asking for differences between two action potential traces (Fig. 7.1 normal vs Fig. 7.2 hypokalaemia). The command word describe here means a structured comparison, and a mark is reserved for a data quote — the candidate must read values directly off the graphs, not give a vague qualitative statement.
Approach
Read each graph carefully. The x-axis is time in ms; the y-axis is membrane potential in mV. Pick out:
- The resting potential (the flat part before depolarisation).
- The peak of the action potential.
- The duration of depolarisation (from resting level to peak).
- The duration of repolarisation (peak back to resting level).
- The lowest point of hyperpolarisation and how long it lasts.
- Use these to compare the two traces.
Step-by-Step Reasoning
-
Resting potential: in Fig. 7.1 the resting line is at −70 mV; in Fig. 7.2 it is at −100 mV. So the hypokalaemic trace starts from a more negative baseline — a difference of 30 mV.
-
Peak: both traces reach the same peak of +40 mV at 2 ms.
-
Depolarisation size: because the starting point differs but the peak is the same, the size of the depolarisation differs.
- Normal: from −70 mV to +40 mV = a 110 mV rise.
- Hypokalaemia: from −100 mV to +40 mV = a 140 mV rise.
So the hypokalaemic depolarisation is larger by 30 mV.
-
Depolarisation duration (from start of upstroke to peak):
- Normal: starts at 1.0 ms, peaks at 2.0 ms → 1.0 ms.
- Hypokalaemia: starts at ~0.75 ms, peaks at 2.0 ms → ~1.25 ms.
The hypokalaemic upstroke is slightly longer.
-
Repolarisation duration (peak back to original resting line):
- Normal: 2.0 ms to ~3.0 ms → ~1.0 ms.
- Hypokalaemia: 2.0 ms to ~3.3 ms → ~1.3 ms.
Repolarisation is slower in hypokalaemia.
-
Hyperpolarisation:
- Normal: dips to about −90 mV at ~3 ms, lasting ~0.7 ms (returning to −70 mV by ~3.7 ms).
- Hypokalaemia: dips to about −112 mV at ~3.3 ms, lasting ~1.0 ms (returning to −100 mV by ~4.3 ms).
The hypokalaemic hyperpolarisation is both deeper (more negative) and longer.
-
Overall action-potential duration:
- Normal: from 1.0 ms to ~3.6 ms ≈ 2.6 ms.
- Hypokalaemia: from 0.75 ms to ~4.0 ms ≈ 3.25 ms.
The hypokalaemic action potential is longer overall.
-
Refractory period: because the hyperpolarisation in hypokalaemia is deeper and longer, the membrane is held further from threshold for longer, so the refractory period is longer in hypokalaemia.
Key Takeaways
- An action potential is described by its amplitude, duration, and the depth/duration of hyperpolarisation. All three should be quoted when comparing traces.
- A "data quote" mark requires reading numbers (e.g. −70 mV vs −100 mV; 1.0 ms vs 1.25 ms) directly off the graph — vague terms like "bigger" or "longer" without numbers do not earn this mark.
- The refractory period is not a separate region of the graph; it is inferred from the hyperpolarisation phase. Longer/deeper hyperpolarisation → longer refractory period.
Common Mistakes
- Saying "the action potential is bigger" without specifying what "bigger" means (amplitude? duration? — both differ here).
- Stating "more negative hyperpolarisation is smaller" — these are opposites; the value is more negative so the magnitude below resting is larger, but the difference between resting and hyperpolarisation dip is smaller (−12 mV in hypokalaemia vs −22 mV normal). Be clear which quantity is meant.
- Quoting only one of the two figures' values, not both. A comparison needs a data quote from each trace.
- Confusing the resting potential with the hyperpolarisation value — they are different points on the graph.
Things to Be Careful About
- Use the exact reading from the graph; the mark scheme accepts a small range (e.g. −90 mV to −92 mV for the normal hyperpolarisation), but reading 0 mV by mistake is wrong.
- "Longer" should be qualified — longer depolarisation, longer repolarisation, longer hyperpolarisation or longer overall action potential — not just "longer".
- When stating the resting potential is "more negative" or "lower", either phrasing is acceptable; the mark scheme lists both.
- The mark scheme uses ora (or reverse argument), so candidates can compare either way round, as long as it is a clear comparison.
Answer
- A larger / stronger stimulus is required to depolarise the membrane to threshold, because the resting potential is more negative (−100 mV instead of −70 mV) so the gap to threshold is bigger.
- The refractory period is longer (because the hyperpolarisation is deeper and longer), so fewer action potentials can be fired per unit time — the frequency of impulses is lower.
- As a result, nervous coordination is slower: reaction times are longer, sensations are weaker, and muscle contraction may be reduced.
See working
Background Concept
Two features of the action potential determine how a neurone transmits information:
- Threshold — the membrane potential (~−55 mV) at which enough voltage-gated Na⁺ channels open to trigger the all-or-nothing action potential. The depolarisation must reach this level for an action potential to fire.
- Refractory period — the period after an action potential during which another action potential cannot easily be triggered (because Na⁺ channels are inactivated and the membrane is hyperpolarised). The refractory period sets an upper limit on the frequency of impulses a neurone can fire.
If either parameter changes, the amount of information a neurone can transmit changes — information is encoded in the frequency of impulses, not the amplitude of a single impulse.
Understanding the Question
Part (b)(ii) asks the candidate to suggest how hypokalaemia may affect nervous coordination, drawing on the differences described in (b)(i). The command word suggest means the candidate is free to make a reasoned proposal that links the observed change in the action potential to a physiological consequence — but the link must be biologically valid.
The two key observations from (b)(i) are: (1) the resting potential is more negative, and (2) the hyperpolarisation is deeper and longer.
Approach
Link each observation to a consequence:
- More negative resting potential → the depolarising stimulus has further to travel to reach threshold → either a stronger stimulus is needed, or the same stimulus fails to trigger an action potential.
- Deeper / longer hyperpolarisation → a longer refractory period → the maximum firing frequency of the neurone is reduced → fewer impulses per second.
Then translate the cellular-level consequence into a body-level effect on nervous coordination: slower reactions, weaker sensations, weaker muscle contraction.
Step-by-Step Reasoning
- The threshold for an action potential is about −55 mV. In a normal axon, the resting potential (−70 mV) is 15 mV below threshold, so a modest depolarising stimulus easily opens enough Na⁺ channels to reach threshold.
- In hypokalaemia the resting potential is −100 mV, so the membrane is 45 mV below threshold — a much larger stimulus is needed to depolarise the membrane to threshold.
- A weaker stimulus, which would normally trigger an action potential, may now fail to reach threshold. This is a direct effect on sensitivity to stimulation.
- The deeper, longer hyperpolarisation in hypokalaemia means the membrane is held below resting for longer after each action potential. Voltage-gated Na⁺ channels are inactivated and the membrane is far from threshold — this is the refractory period.
- A longer refractory period means the neurone can fire fewer action potentials per second. Frequency of impulses is reduced.
- Because the strength of a sensation or the force of a muscle contraction is encoded in the frequency of impulses arriving at the synapse / neuromuscular junction, a lower firing frequency means weaker sensation and weaker muscle contraction.
- Reaction time depends on how quickly successive action potentials can travel along the sensory-to-motor pathway; a longer refractory period and a higher threshold together slow nervous coordination — slower reactions, slower cognition, reduced reflexes.
- The candidate could name any specific example (e.g. delayed withdrawal reflex, reduced grip strength, dimmer vision) as a concrete illustration.
Key Takeaways
- Threshold and refractory period are the two key variables linking an action potential's shape to how much information a neurone can transmit.
- A more negative resting potential raises the bar to threshold; a deeper hyperpolarisation lengthens the refractory period.
- Hypokalaemia is clinically recognised for causing muscle weakness, fatigue and cardiac arrhythmias, all consistent with the deductions made here.
Common Mistakes
- Stating "no action potentials can fire" — the membrane can still reach threshold with a large enough stimulus; hypokalaemia raises the threshold, it does not abolish firing.
- Saying "the action potential is bigger so coordination is stronger" — the amplitude of an individual action potential does not encode information; the frequency does.
- Conflating "resting potential more negative" with "hyperpolarisation deeper"; they are related but distinct. The resting potential shift is a long-term change in baseline, while hyperpolarisation is a brief dip below that baseline after each action potential.
- Omitting any link to stimulus strength or firing frequency — the mark scheme rewards both ideas.
Things to Be Careful About
- The mark scheme accepts named examples (e.g. weaker muscle contraction, slower reaction time) as alternatives to the formal statements. Either form is credited.
- The deduction is two-step: graph observation → cellular consequence → body-level effect. Make sure the middle step is explicit in the answer; "slower reactions" without saying why may not earn full credit.
- "Lower frequency of impulses" is a more precise way to express "fewer impulses"; both are credited.
A lichen describes a mutually beneficial association of a fungus with an organism termed a photobiont. An example of a photobiont is the green alga, Trebouxia sp., which is a photosynthetic protoctist.
Fig. 8.1 shows lichen attached to a tree.
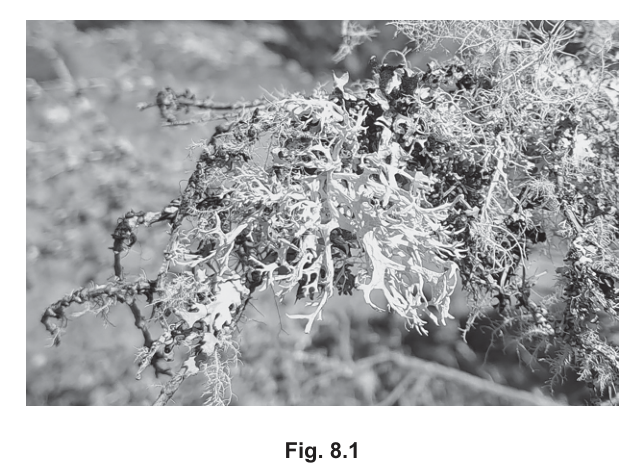
Answer
Any four from:
- Eukaryotic / have a (membrane-bound) nucleus
- No chlorophyll / no chloroplasts (so cannot photosynthesise)
- Heterotrophic nutrition: saprophytic / saprotrophic / parasitic (described)
- Cell wall made of chitin
- Reproduce by spores
- Body composed of hyphae forming a mycelium
- Cells may be multinucleate (coenocytic)
- Either unicellular (e.g. yeast) or multicellular
Any four of: eukaryotic; no chlorophyll/chloroplasts; heterotrophic/saprophytic/parasitic; chitin cell wall; spores; hyphae/mycelium; multinucleate; unicellular or multicellular.
Background Concept
The five (now often six) kingdom classification places organisms into broad groups based on fundamental features such as cell type (prokaryotic vs eukaryotic), mode of nutrition, body organisation and cell wall composition. The kingdom Fungi is one of these groups and includes moulds, yeasts, mushrooms, rusts and the fungal partner of lichens.
Key features that unite members of Fungi:
- They are eukaryotes, so their cells have a true nucleus and membrane-bound organelles.
- They lack chlorophyll and chloroplasts, so they cannot make their own food. Instead they obtain nutrients by heterotrophic means: secreting enzymes externally and absorbing soluble products (saprophytic nutrition on dead matter) or feeding on living hosts (parasitic nutrition).
- Their cell walls are made of chitin (the same polymer found in insect exoskeletons), not cellulose as in plants or peptidoglycan as in bacteria.
- The fungal body is usually a network of branching filaments called hyphae, collectively forming a mycelium. Hyphae may be divided by septa or be coenocytic, and individual cells can be multinucleate.
- Fungi reproduce by means of spores, produced sexually or asexually.
- Although most fungi are multicellular, some (such as Saccharomyces) are unicellular.
Understanding the Question
This is a "state/describe" type question worth 4 marks. The candidate must recall and list characteristic features of the kingdom Fungi. There is no single correct list — any four valid features from the accepted pool earn the four marks.
Approach
Read the question's command word ("outline") and select the four most distinctive features that, taken together, mark fungi apart from plants, animals and protoctists. A strong answer contrasts fungi with plants (no chloroplasts, chitin not cellulose, heterotrophic not autotrophic) and notes their structural organisation (hyphae/mycelium, spores, possibly multinucleate or unicellular).
Step-by-Step Reasoning
- Eukaryotic — distinguishes fungi from bacteria and from the prokaryotic cell type. Many candidates lose this mark by saying "cell has a nucleus" without the word eukaryotic, which is the precise term the mark scheme wants.
- No chlorophyll / no chloroplasts — places fungi firmly in the heterotrophic, not autotrophic, group. It explains why the fungal partner in a lichen must rely on the alga for photosynthate.
- Heterotrophic / saprophytic / parasitic — describes the mode of nutrition. A specific example of how the fungus feeds (e.g. secreting extracellular enzymes) is creditworthy but the umbrella term is enough.
- Cell wall of chitin — diagnostic chemical feature. Avoid the common error of saying "cellulose" (that is a plant feature).
- Reproduce by spores — a reproductive feature, often paired with hyphae/mycelium.
- Hyphae / mycelium — describes the body organisation. Many exam answers mention mycelium but forget that it is made of hyphae; the mark scheme wants at least one of the two terms.
- Multinucleate cells — a finer structural point, often missed. Many fungal hyphae are coenocytic, with several nuclei sharing a common cytoplasm.
- Unicellular or multicellular — covers both the yeast-like forms and the filamentous moulds/mushrooms.
Key Takeaways
- Fungi are eukaryotes with chitin cell walls, no chlorophyll, and heterotrophic (saprophytic or parasitic) nutrition.
- Their body is a mycelium of hyphae; they reproduce by spores.
- Knowing the contrasting features of Fungi, Plantae, Protoctista and Animalia is essential for taxonomic questions.
Common Mistakes
- Writing "cell wall of cellulose" — that is the plant kingdom feature, not fungi.
- Saying "they photosynthesise" — fungi do not; they lack chlorophyll.
- Calling them "prokaryotes" because they are small and microscopic — they are eukaryotes with a true nucleus.
- Confusing hyphae with rhizoids (a plant root-hair-like structure).
- Listing only three features and trying to make the fourth by repeating an idea in different words — the mark scheme requires four distinct points.
Things to Be Careful About
- Use precise terminology: eukaryotic, chitin, saprophytic, hyphae, mycelium, coenocytic / multinucleate.
- The mark scheme accepts any four features, so choose the ones you can express most accurately; do not pad a weak list with imprecise statements.
Answer
- The fungus receives (named) organic compounds / nutrients / food / oxygen from the alga (which photosynthesises).
- The alga receives support / stability / protection / water / minerals / carbon dioxide from the fungus.
Fungus: organic compounds/nutrients from alga. Alga: support, water, minerals and/or CO₂ from fungus.
Background Concept
A mutualistic (or mutual) symbiosis is a close, long-term association between two different species in which both partners benefit. A lichen is the textbook example: a fungus (most often an ascomycete) and a photosynthetic partner — the photobiont — here the green alga Trebouxia sp.
The fungus contributes:
- A body of tightly packed hyphae that gives the lichen shape, mechanical support, and the ability to cling to substrates such as bark or rock.
- A means of absorbing and retaining water and dissolved mineral ions from rainwater, dew and the substrate.
- Protection from desiccation, intense light and grazing.
- A supply of CO₂ released by its own respiration (and trapped in the thallus), which the alga can use in photosynthesis.
The alga (photobiont) contributes:
- Photosynthate — sugars, amino acids and other organic compounds produced by photosynthesis. Because the fungus cannot make its own food, this is its main carbon (and energy) source. The alga also releases O₂, which the fungus needs for aerobic respiration.
Each partner therefore occupies a niche that the other cannot fill alone: the alga provides fixed carbon, the fungus provides the structure and the inorganic supply.
Understanding the Question
This is a "suggest" question worth 2 marks — one mark for what the fungus gains, one for what the alga gains. The verb suggest means the examiner will accept any biologically sensible reciprocal benefit drawn from the structure of a lichen.
Approach
Think of the lichen as two organisms, each with a "deficit" the other can fill:
- The fungus cannot make its own organic food ⇒ the alga supplies it.
- The alga is small and has no means of attachment or of gathering water/minerals ⇒ the fungus supplies it.
The two marks correspond to one benefit for each partner.
Step-by-Step Reasoning
- Fungus gains organic compounds / nutrients from the alga. This is the principal benefit, because the fungus is heterotrophic and cannot photosynthesise. The mark scheme also accepts "food" or "oxygen" (the alga releases O₂ during photosynthesis, which the fungus uses in respiration).
- Alga gains support, water, minerals and/or CO₂ from the fungus. The fungal hyphae absorb water and dissolved ions from the environment and hold the alga against the substrate; the alga uses these for photosynthesis. CO₂ released by fungal respiration is recycled to the alga. "Protection" from desiccation and grazing is also creditworthy.
Key Takeaways
- Lichens are a mutualism: the fungus provides structure, water and minerals; the alga provides organic carbon (and O₂).
- "Suggest" means the marking is generous — any reasonable reciprocal benefit is accepted.
- The two partners occupy complementary niches and could not survive in the same habitat on their own as readily.
Common Mistakes
- Giving only one benefit, e.g. just what the fungus gains — that scores one mark, not two.
- Writing the benefits in the wrong direction (e.g. saying the alga gets food from the fungus) — the mark scheme is direction-specific.
- Using vague terms like "the fungus helps the alga" without naming what is exchanged. Always be specific: organic compounds, water, CO₂.
- Saying the alga "gets protection from the fungus" alone — the alga also needs inorganic resources, not just safety.
Things to Be Careful About
- Each mark is tied to a specific direction of benefit. Be sure the answer clearly attributes one benefit to the fungus and one to the alga.
- The mark scheme is generous (any one of several options for each side scores the mark), so pick the precise terms you know are correct: organic compounds / food for the fungus, water / minerals / CO₂ / support for the alga.
A suspension of Trebouxia in water was used to investigate the effect of the intensity of light on the rate of photosynthesis. The volume of oxygen released over a set period of time was used as a measure of the rate of photosynthesis at each different light intensity.
All other conditions were kept constant.
Fig. 8.2 shows how light intensity affected the volume of oxygen released by Trebouxia.
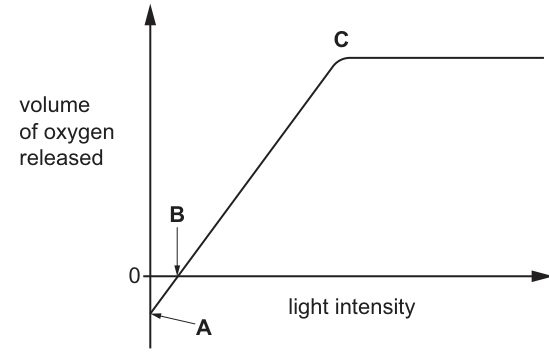
Answer
Photosystem II (also accepted: photosystem 2 / P680)
Photosystem II (or PSII / P680)
Background Concept
The light-dependent reactions of photosynthesis take place on the thylakoid membranes and involve two photosystems working in series:
- Photosystem II (PSII / P680) — its reaction-centre chlorophyll absorbs light most strongly at 680 nm. PSII is the site of photolysis of water, in which water is split to release O₂, protons (H⁺) and electrons. The electrons replace those lost from PSII and pass down an electron transport chain to PSI.
- Photosystem I (PSI / P700) — absorbs light at 700 nm; its role is to re-energise electrons so that NADP⁺ can be reduced to NADPH. PSI does not release oxygen.
The oxygen released in photosynthesis therefore comes specifically from the photolysis of water at PSII.
Understanding the Question
This is a one-mark "state" question. The candidate must name the photosystem responsible for oxygen release. The mark scheme accepts PSII, photosystem 2, or P680.
Approach
Recall that O₂ evolution is tied to the splitting of water, and that the water-splitting complex (the manganese cluster) is associated with PSII. The 680 refers to the wavelength (nm) of light at which the reaction-centre chlorophyll of PSII absorbs maximally.
Step-by-Step Reasoning
- Photolysis (splitting of water) occurs at the oxygen-evolving complex on the lumenal side of PSII.
- Therefore, the photosystem involved in the release of oxygen is Photosystem II (P680).
- Although PSI receives the electrons eventually, it is not the site of photolysis and does not release O₂.
Key Takeaways
- Photolysis of water, and therefore oxygen release, occurs at Photosystem II.
- The reaction-centre chlorophyll of PSII absorbs at 680 nm (hence "P680").
- The two photosystems are numbered in the order they were discovered, not the order they act — the electrons flow from H₂O → PSII → PSI → NADP⁺.
Common Mistakes
- Writing PSI / P700 — a common error; PSI does not photolyse water.
- Writing just "P680" without the word photosystem II — both are accepted by this mark scheme, but in other questions the full name may be required.
- Confusing photophosphorylation (ATP synthesis) with photolysis (water splitting) — both occur during the light-dependent reactions, but only photolysis releases oxygen.
Things to Be Careful About
- The number "II" is the order of discovery, not the order of electron flow.
- "P680" refers to the reaction-centre chlorophyll of PSII; "P700" is the reaction-centre chlorophyll of PSI. Do not mix them up.
With reference to Fig. 8.2:
- explain the curve between A and B
- explain why the curve levels off after C.
Answer
Between A and B (low light intensities):
- Respiration is occurring (at a constant rate) and the rate of respiration is greater than the rate of photosynthesis, so the net volume of oxygen released is negative — the cells are taking up more O₂ than they are producing. As light intensity increases, the photosynthesis rate rises while respiration stays constant, so the net O₂ release increases, crossing zero at the compensation point B.
After C (high light intensities):
- Light intensity is no longer the limiting factor.
- Another factor, such as carbon dioxide concentration or temperature, is now limiting the rate of photosynthesis, so the curve plateaus.
A→B: respiration > photosynthesis, so O₂ is consumed and net release is negative. After C: light is no longer limiting; CO₂ concentration or temperature is the limiting factor.
Background Concept
The rate of net photosynthesis measured as O₂ released per unit time is the difference between the rate of gross photosynthesis and the rate of respiration:
Both processes occur in Trebouxia simultaneously. The light compensation point is the light intensity at which gross photosynthesis exactly balances respiration, so net O₂ release is zero.
Photosynthesis is also subject to the law of limiting factors: at any given moment the rate is limited by whichever factor (light intensity, CO₂ concentration, temperature) is in shortest supply relative to demand. As one factor is increased, the rate rises until another factor becomes limiting, after which further increases in the first factor have no effect — the curve plateaus.
Understanding the Question
The candidate is given a graph of O₂ released (y-axis) against light intensity (x-axis) for a suspension of Trebouxia. Three regions are labelled:
- A — the curve starts below zero (negative O₂ release) at very low / zero light intensity.
- B — the curve crosses the x-axis (net O₂ release = 0) — this is the light compensation point.
- C — the curve bends and becomes flat (plateau) — beyond this, increasing light intensity no longer speeds up photosynthesis.
The question asks for two explanations: one for A→B and one for after C. The two together are worth 4 marks (2 + 2).
Approach
For A→B, think about the balance between photosynthesis and respiration: at very low light, photosynthesis is too slow to keep up with respiration, so net O₂ release is negative. As light rises, photosynthesis accelerates and gradually offsets respiration until at B the two are equal.
For after C, apply the law of limiting factors: light is no longer in short supply, so something else (CO₂ or temperature) must be the new ceiling, producing a plateau.
Step-by-Step Reasoning
A → B (very low light)
- In this region respiration is occurring at a roughly constant rate (it does not depend on light).
- Photosynthesis is also occurring but at a much lower rate than respiration because light is scarce.
- Therefore, the net O₂ released is negative: the cells are consuming more O₂ (in respiration) than they are producing (in photosynthesis).
- As light intensity increases, the photosynthesis rate rises; respiration stays constant. The two curves converge and the net O₂ release rises through negative values, reaching zero at point B (the light compensation point).
- Marks awarded: (i) respiration rate is greater than photosynthesis rate; (ii) therefore O₂ is consumed / not released (so the volume released is negative). These two points together earn the marks for A→B.
After C (plateau)
- The graph has stopped rising: increasing light intensity any further produces no increase in O₂ release.
- This means light intensity is no longer the limiting factor; the cell has as much light energy as it can use.
- A different factor must now be limiting. The most common candidates are CO₂ concentration (needed to fix carbon in the Calvin cycle) and temperature (which governs enzyme activity, e.g. Rubisco).
- Until the supply of this new limiting factor is increased, the rate of photosynthesis cannot rise further — hence the plateau.
- Marks awarded: (i) light intensity is no longer limiting; (ii) another factor, such as CO₂ concentration or temperature, is limiting.
Key Takeaways
- A photosynthesis-versus-light-intensity graph that starts below zero indicates that respiration is also taking place; the x-intercept is the light compensation point.
- A plateau at high light intensity indicates that light is no longer limiting and that a different factor (CO₂ or temperature) has become the new ceiling on rate.
- The law of limiting factors is essential for explaining any photosynthetic rate curve.
Common Mistakes
- For A→B, simply saying "the curve goes up because photosynthesis is occurring" — this does not earn the marks because the candidate has not explained why the values are negative. The marks require explicit reference to respiration exceeding photosynthesis.
- For after C, saying "the rate has reached its maximum" without identifying which factor is now limiting — the mark scheme wants the name of the new limiting factor (CO₂ or temperature).
- Citing chlorophyll concentration or enzyme denaturation as the new limiting factor — these are not what the question or the mark scheme are testing. (In this region, increasing light has no effect, but the cell is not yet at the temperature optimum.)
- Confusing the light compensation point (B) with the light saturation point (C). They are different concepts: B is where photosynthesis = respiration; C is where further light no longer speeds photosynthesis.
Things to Be Careful About
- Distinguish the two halves of the explanation clearly. The mark scheme separates them with a heading; in an exam answer it is good practice to start a new sentence (or a new paragraph) for each region.
- Be explicit: write "respiration > photosynthesis" rather than "the cell uses oxygen"; write "CO₂ is now the limiting factor" rather than "there is not enough raw material".
- Note that the question's experimental set-up (a suspension of Trebouxia in water) means the cells will run out of dissolved CO₂ fairly quickly, so CO₂ concentration is the most plausible limiting factor in this experiment.
The biodiversity of an area can be assessed using a variety of sampling methods.
Outline how a frame quadrat could be used to assess the biodiversity of plants in a field.
Answer
- A frame quadrat of known/standard area is placed on the ground at randomly chosen coordinates (e.g. using a random number generator to select grid coordinates) within the field.
- All plant species within the quadrat are identified using a suitable dichotomous key.
- The number of individuals of each species (abundance) and/or the percentage cover is recorded for each species in the quadrat.
- Sampling is repeated at many random positions in the field to obtain a large sample size, and the data are used to calculate species density or Simpson's Index of Biodiversity (D).
See working.
Background Concept
Biodiversity describes the variety of living organisms in an area. It has three components: genetic diversity, species diversity and ecosystem diversity. For a single habitat (a field), the relevant measure is species diversity — a combination of the number of different species (species richness) and how evenly individuals are spread across those species (evenness). Sampling must therefore record both how many species are present and roughly how abundant each is, and the sample must be representative of the whole area, not biased by where the investigator chooses to look.
A frame quadrat is a square frame, usually or , that delimits a known area of ground. By counting/recording everything inside the frame, the investigator gets a quantitative value (abundance, percentage cover, ACFOR scale, or frequency) that can be compared between places or times. Combining many random quadrats across the field gives an unbiased estimate of biodiversity, which can be expressed as species density, species frequency, or as a diversity index such as Simpson's Index of Diversity (D):
where is the number of individuals of each species and is the total number of individuals of all species.
Understanding the Question
The command word outline requires a brief, structured account — not a full lab protocol. The question is testing whether the candidate knows the practical steps that make a quadrat survey valid: standardising the area, placing the frame randomly, identifying what's inside it with a key, recording abundance/cover, repeating to get a large sample, and processing the data into a diversity measure. Any four from the mark scheme's list of seven points will earn full marks.
Approach
Select the most important features of a valid quadrat survey that are NOT obvious from the term "quadrat" alone. Mentioning the standard area, random placement, use of a key, recording species counts/cover, and repeats/large sample size captures all of the marks-scheme's first six points; the seventh (Simpson's) can be added as the analysis step. The order should reflect a logical sequence: choose a frame → place it randomly → identify and count what's inside → repeat → analyse.
Step-by-Step Reasoning
- Standardised area of the frame — All quadrats placed must be the same size so that density/abundance values are comparable. The mark scheme specifically wants the idea of a "known/same/standard area/size".
- Random placement — Lay out a grid over the field, generate pairs of random coordinates (e.g. with a random number generator or random-number tables) and place the frame at those coordinates. This removes observer bias (the tendency to place the quadrat where plants look interesting). Setting out a grid is the mark-scheme-accepted alternative when coordinate pairs are generated.
- Identify with a key — A dichotomous or taxonomic key is used to identify each plant species found inside the quadrat; without it, the candidate cannot convert observations into species data.
- Record the response variable — Either the number of individuals of each species (abundance) or the percentage cover of each species. ACFOR (Abundant, Common, Frequent, Occasional, Rare) and the Braun-Blanquet scale are accepted alternatives.
- Repeat / large sample size — A single quadrat is not enough; the frame is placed many times in randomly chosen positions so the mean values are reliable. The mark scheme's "large sample size / repeats" point is satisfied here.
- Calculate a biodiversity measure — The combined results are used to calculate a meaningful number: species density (number of species per unit area) or Simpson's Index of Biodiversity (D) (which combines richness and evenness).
Key Takeaways
- A frame quadrat gives a quantitative measure of biodiversity only when it is of standard area, placed randomly, and used many times.
- Recording should capture BOTH which species and how many of each (richness + evenness).
- A key is essential for species identification; without it, the data have no biological meaning.
- The raw data are turned into a meaningful value (Simpson's D, species density) only after sufficient repeats.
Common Mistakes
- Forgetting the random placement — stating simply "place the quadrat on the ground" without explaining where and how chosen fails to remove observer bias and loses a mark.
- Recording presence/absence only — noting "which species are present" without a quantitative measure (count, cover, ACFOR) means evenness is lost and Simpson's index cannot be calculated.
- No mention of repeats — a single quadrat is a sample of , not of "the field"; without repeats the survey is not representative.
- Forgetting the key — naming species from memory is not acceptable practice and the mark scheme explicitly rewards the use of a key.
- Confusing Simpson's Index with Simpson's Index of Diversity — candidates often quote the raw form rather than the diversity form.
Things to Be Careful About
- "Outline" demands concise, structured points — not a long prose paragraph.
- The mark scheme uses ";" between alternatives within a single point (e.g. "abundance / percentage cover / ACFOR / Braun-Blanquet"), so any one of these is acceptable.
- "Large sample size" and "repeats" are the same mark-scheme point — do not double-count them as two separate marks.
- When stating the area, "known" or "standard" or "same" is acceptable; do not write "big" or "appropriate".
A student investigated whether the height of the soft rush plant, Juncus effusus, decreases with an increase in altitude on a hillside in the United Kingdom.
- 12 sites were chosen at increasing altitudes.
- The mean height of 10 plants was calculated at each altitude.
Spearman’s rank correlation was used to assess the relationship between the height of the plants and altitude.
The equation for Spearman’s rank correlation () is:
Key to symbols:
= difference in rank between each pair of measurements
= number of pairs of items in the sample
was calculated to be 550.
Calculate the Spearman’s rank correlation for these data.
Give your answer to three decimal places.
answer = ______
Working
Answer
−0.923
Background Concept
Spearman's rank correlation coefficient () is a non-parametric test that quantifies how strongly two variables are associated, by converting the raw data into ranks and comparing the ranks rather than the raw values. The result lies between and :
- — perfect positive correlation (both variables increase together),
- — perfect negative correlation (one increases as the other decreases),
- — no correlation.
The formula, valid for small samples with no tied ranks, is:
where is the difference in rank between each pair of measurements and is the number of pairs. Because the formula squares , it removes the sign of the difference; the sign of the resulting is therefore set by the direction the ranks were assigned (lowest rank = 1). The magnitude is what is later compared against a critical value to test for significance.
Understanding the Question
The student has already calculated from ranking 12 pairs of altitude/height data. The question gives the formula, the symbol key, and the value of ; the only things to identify are (which is 12, from "12 sites were chosen") and to substitute correctly. The answer must be given to three decimal places, so the final value must be rounded at the very end.
Approach
Read the question carefully: is the number of pairs of items, which is 12 (the number of sites, each providing one mean height). Substitute into the formula in the order top-of-fraction first (), then bottom-of-fraction (), then divide, then subtract from 1. Finally, round to three decimal places — and do NOT lose the negative sign.
Step-by-Step Reasoning
- Identify the inputs. (given) and (number of sites = number of pairs).
- Compute the numerator. .
- Compute the denominator. . A common error is to write (forgetting the cube).
- Divide.
- Subtract from 1.
- Round to three decimal places. . The mark scheme's awarded answer is ; the mark scheme explicitly notes that the minus sign is required for full marks ("allow 2 marks if no minus") and that the three-decimal-place precision is required ("allow 2 marks if not three decimal places").
Key Takeaways
- in Spearman's formula is the number of pairs, which here is the number of sites (12), not the number of plants measured (120).
- The denominator is , sometimes written ; for this is .
- The sign of comes from the direction of ranking (altitude ascending = positive trend) — squaring removes the sign of each but the overall sign is still meaningful.
- The magnitude is what gets compared to the critical value in the next part; here is well above the critical value for at (which is 0.504).
Common Mistakes
- Using (10 plants × 12 sites) — the mark scheme explicitly states this gives and only 2 marks are awarded.
- Using (forgetting that there are 12 sites) — the mark scheme states this gives and only 2 marks are awarded.
- Dropping the negative sign — the correlation is negative because as altitude increases, plant height decreases; the mark scheme gives only 2 of 3 marks without the minus.
- Rounding the wrong value — candidates sometimes round to 2.0 and report , losing precision marks.
- Forgetting to cube — writing or instead of .
Things to Be Careful About
- Read the symbol key carefully: is the number of pairs, not the number of individual plants.
- The negative sign matters: write it explicitly, e.g. "", not just "".
- Three decimal places means exactly three digits after the decimal point — do not write or .
- The mark scheme gives error-carried-forward (ecf) credit if the candidate's intermediate is wrong but the rest of the working is consistent, so always show the substitution.
The null hypothesis for this investigation is: there is no correlation between the altitude and the height of the soft rush plants.
Table 9.1 shows the critical values for Spearman’s rank correlation.
Table 9.1
| 10 | 0.564 |
| 12 | 0.504 |
| 14 | 0.459 |
Use your value of Spearman’s rank correlation and Table 9.1 to state and explain if the null hypothesis is correct.
Answer
- () is greater than the critical value at , ().
- The null hypothesis is rejected; there is a significant negative correlation between altitude and the height of the soft rush plants. The probability that this correlation is due to chance is less than 5%.
Null hypothesis rejected — significant negative correlation (0.923 > 0.504).
Background Concept
A significance test answers the question "could this result have arisen by chance if there were really no relationship?" The procedure:
- State a null hypothesis (): in this case, "there is no correlation between altitude and plant height".
- Calculate a test statistic ( here).
- Compare the magnitude of the test statistic to a critical value from a statistical table. The critical value is the threshold above which the result is judged unlikely to have occurred by chance at the chosen significance level (commonly , i.e. a 5% risk of a false positive).
- If critical value → reject (significant correlation). If critical value → accept (no significant correlation).
The sign of the correlation is the biological direction (positive or negative); the magnitude is what is tested against the critical value.
Understanding the Question
The student already has from part (b)(i). Table 9.1 gives the critical value for at as . The candidate must (a) compare with , (b) decide whether to reject or accept the null hypothesis, and (c) state and explain the conclusion in biological terms. The mark scheme awards 2 marks: one for the comparison ( > critical value) and one for the conclusion + reason.
Approach
- Use the absolute value of (the magnitude), not the signed value, when comparing to the critical value, because the critical value in the table applies to either a positive or a negative correlation of that strength.
- Quote the actual numbers: .
- State the decision on (reject) and link it to the probability of chance ().
- The mark scheme allows ecf from part (b)(i), so if a candidate's has the wrong magnitude, the same logic applied to their value is still credited.
Step-by-Step Reasoning
- Compare the calculated with the critical value for at . , so the calculated value exceeds the critical value.
- Decision on : because the calculated value is greater than the critical value, the null hypothesis (no correlation) is rejected.
- Interpretation: the result is statistically significant at the 5% level. There is a negative correlation (because the sign of was negative) between altitude and the height of the soft rush plants — i.e. plant height decreases as altitude increases. The probability that this observed correlation is due to chance alone is less than 5%.
- Mark-scheme wording: the candidate must explicitly say "reject the null hypothesis" AND give the reason (significant / strong / negative correlation, or probability of chance < 5%). A bare "reject " without justification does not earn the second mark.
Key Takeaways
- Always compare the magnitude of (or ) to the tabulated critical value, not the signed value.
- The decision to reject or accept is binary: critical → reject; critical → accept.
- "Significant" in statistics has a precise meaning: the result is unlikely to have arisen by chance at the chosen -value. It does NOT mean "important" or "large".
- The sign of carries biological information (direction of the relationship), separate from the significance test.
- The mark scheme's ecf means a wrong magnitude in part (b)(i) can still be awarded marks in part (b)(ii) provided the comparison is logically consistent.
Common Mistakes
- Comparing the signed value directly to and concluding therefore "do not reject " — this is a common error because the negative sign is forgotten. The critical value is the threshold for the magnitude; always take .
- Failing to state the direction — saying only "there is a correlation" without specifying it is negative loses biological information.
- Misinterpreting "significant" — confusing statistical significance with biological importance; the mark scheme wants the specific reason, e.g. "probability of correlation due to chance is less than 5%".
- Failing to reject the null hypothesis explicitly — the mark scheme's first mark is for the comparison () and the second for the explicit rejection + reason.
Things to Be Careful About
- State the comparison in numbers, not in words alone (" is greater than the critical value of ").
- Include both the decision (reject ) and the reason (significant / strong / negative / ) for the second mark.
- The mark scheme explicitly accepts either "there is a significant/strong/negative correlation" OR "probability that the correlation is due to chance is less than 5%" as the second-mark reason — give one of these.
- The ecf rule from 9(b)(i) means a wrong magnitude is acceptable here as long as the comparison logic is correct.
The grey seal, Halichoerus grypus, is an aquatic mammal that lives in the North Atlantic Ocean. It feeds on fish, which it hunts at depths of up to 70 metres.
Fig. 10.1 shows a grey seal.
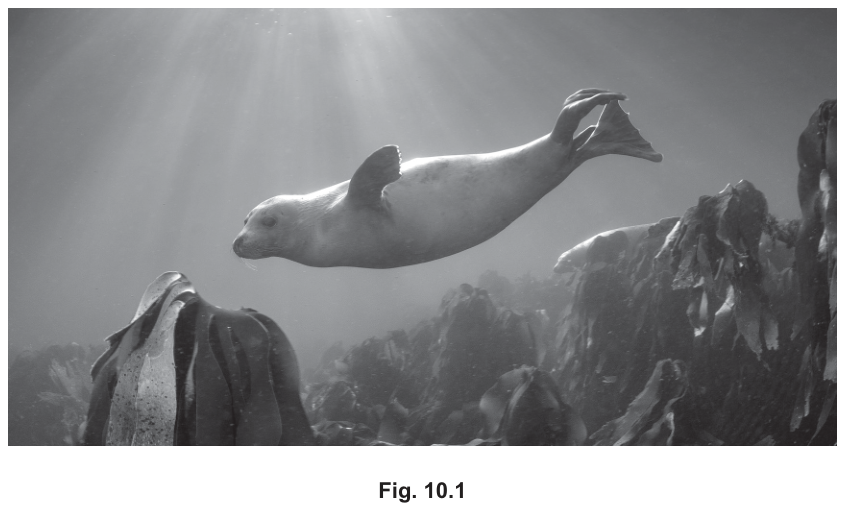
Diving to hunt for fish has an effect on the respiration of the grey seal.
A study was carried out to measure the blood lactate concentration of a grey seal before, during and after a dive in deep water.
Fig. 10.2 shows the results of this study.
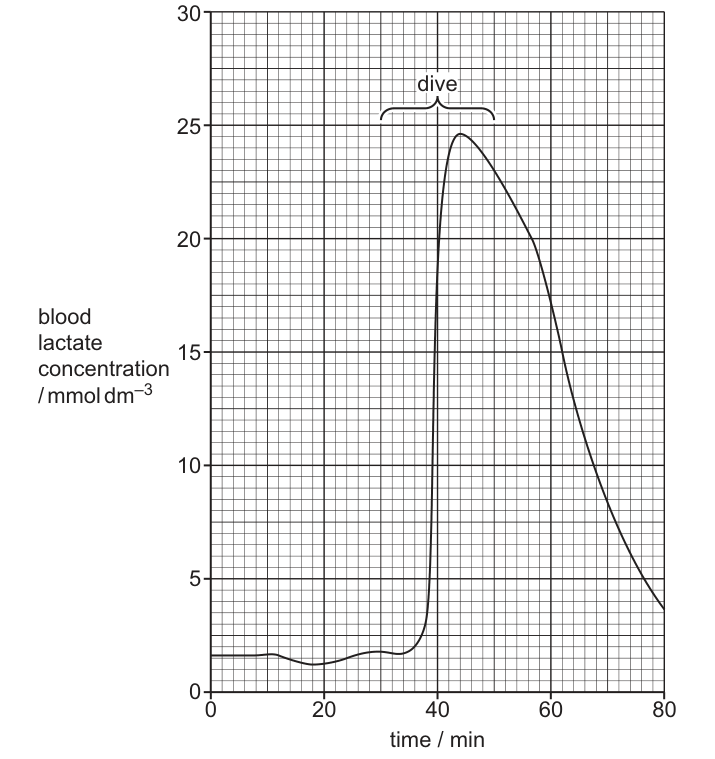
With reference to Fig. 10.2, suggest reasons for the change in blood lactate concentration of the seal:
- during the dive
- after the dive.
Answer
During the dive (blood lactate rises):
- Initially the lactate concentration is low because the seal's muscle cells are respiring aerobically (using oxygen already stored / bound to myoglobin).
- As the dive continues, less / no oxygen is available to the muscle cells, so they switch to anaerobic respiration.
- In anaerobic respiration, pyruvate (from glycolysis) is reduced by reduced NAD to lactate, so lactate concentration increases.
After the dive (blood lactate falls):
- The seal can now breathe again, so more oxygen is available and muscle (and liver) cells carry out aerobic respiration.
- Lactate is oxidised / converted back to pyruvate, which then enters the Krebs cycle / link reaction.
- Lactate is also transported in the blood to the liver, where it is converted back to glucose / pyruvate (Cori cycle).
- (AVP) The extra oxygen taken in after the dive repays the oxygen debt / EPOC.
During the dive, anaerobic respiration (due to lack of oxygen) converts pyruvate to lactate, raising blood lactate. After the dive, the seal re-breathes aerobically and lactate is oxidised to pyruvate (and processed by the liver), so blood lactate falls.
Background Concept
Aerobic respiration in mammals — glycolysis, the link reaction, the Krebs cycle and oxidative phosphorylation — uses oxygen as the final electron acceptor in the electron transport chain and produces carbon dioxide and water. When oxygen is in short supply, cells can still run glycolysis (which does not need oxygen) but the link reaction, Krebs cycle and electron transport chain cannot operate. To keep glycolysis running, the pyruvate produced must be dealt with: it accepts hydrogen from reduced NAD, regenerating NAD so that glycolysis can continue, and is itself converted to lactate. This is anaerobic respiration in mammals:
Aerobic respiration releases far more ATP per glucose than glycolysis alone, so anaerobic respiration is a short-term emergency system. The build-up of lactate in active muscles is associated with the oxygen debt (also called excess post-exercise oxygen consumption, EPOC): after strenuous activity, the animal continues to breathe heavily to oxidise the lactate (mostly by the liver, via the Cori cycle — lactate → pyruvate → glucose) and to restore ATP, phosphocreatine and oxygen stores (haemoglobin and myoglobin).
Marine mammals such as grey seals Halichoerus grypus are exceptional divers. While underwater, they cannot breathe, and circulation is partly restricted to essential organs (the dive response / bradycardia), so working muscles become hypoxic and rely on anaerobic respiration, generating lactate. Crucially, this lactate is largely trapped in the muscles and is not flushed into the general circulation until the seal surfaces and normal circulation is restored — which is why the blood lactate peak on a graph usually appears after the dive, not during it.
Understanding the Question
Fig. 10.2 plots blood lactate concentration against time. Before the dive, the concentration is low and stable at about . During the labelled dive (35–45 min) the blood lactate is still low (the seal is using anaerobic respiration inside the muscles, but circulation to muscles is restricted). When the dive ends at 45 min, blood lactate spikes sharply to about by ~48 min — this is the lactate being flushed out of the previously oxygen-starved muscles into the general circulation. After the peak, the concentration falls steadily back towards the resting value by 80 min.
The question asks for reasons for these changes during and after the dive, in terms of the biochemistry of lactate production and removal. It is a 4-mark "suggest" question, so the answer should pick out the four most important creditable points.
Approach
- Recognise the two phases the mark scheme is testing: lactate production (during / as a result of the dive) and lactate removal (after the dive).
- For production, link "no oxygen" to "anaerobic respiration" and to "pyruvate reduced to lactate by reduced NAD".
- For removal, link "oxygen available again" to "aerobic respiration", to "lactate oxidised to pyruvate", and to processing by the liver (with optional credit for oxygen debt / EPOC).
- Make sure each point is a complete marking point — state the cause and the biochemical consequence.
Step-by-Step Reasoning
-
During the dive — why blood lactate rises (after the dive). Early in the dive the seal is still using oxygen bound to myoglobin in its muscles, so aerobic respiration continues and the blood lactate stays low. As the dive continues the muscle cells run out of oxygen, so the rate of aerobic respiration falls. The cells switch to anaerobic respiration to keep producing some ATP. In anaerobic respiration, the pyruvate produced by glycolysis is reduced by reduced NAD (the cofactor must be regenerated so that glycolysis can keep going), and this reduction converts pyruvate into lactate. The lactate accumulates inside the muscle cells and is released into the blood once circulation is restored — hence the rise seen in the graph at the end of the dive.
-
After the dive — why blood lactate falls. The seal surfaces and breathes, so oxygen is again available to its tissues. The liver (and to some extent the muscles) now respire aerobically. Lactate is oxidised back to pyruvate, which can then enter the link reaction and the Krebs cycle, with the reducing equivalents feeding the electron transport chain. In addition, much of the lactate is transported in the blood to the liver, where it is converted first to pyruvate and then to glucose (gluconeogenesis) — the Cori cycle — and the glucose can be returned to the muscles.
-
Why the curve still decreases even after the obvious peak. The seal continues to breathe heavily for some time after the dive, taking in extra oxygen. This extra oxygen is needed to oxidise all the lactate that built up and to replenish the ATP, phosphocreatine and oxygen stores that were used up during the dive. This is the oxygen debt or excess post-exercise oxygen consumption (EPOC), and the mark scheme credits it as an additional valid point (AVP).
-
Interpreting the graph shape. The fact that the blood lactate peak occurs after the dive (and not during it) is itself evidence that the seal was holding lactate inside poorly-perfused muscles while underwater. The rapid rise at 45 min is the moment circulation to the muscles is restored and the trapped lactate floods into the general circulation. The slow decline afterwards reflects the time taken for the liver and aerobic respiration to clear it.
Key Takeaways
- Anaerobic respiration in mammals = pyruvate is reduced to lactate by reduced NAD, regenerating NAD so that glycolysis can continue.
- Lactate builds up when oxygen supply to a tissue is inadequate for aerobic respiration.
- Once oxygen is available again, lactate is oxidised back to pyruvate and respired aerobically, or converted to glucose in the liver (Cori cycle).
- The "oxygen debt" / EPOC describes the continued elevated oxygen consumption after exercise/diving to clear lactate and restore energy stores.
- In diving mammals, the blood lactate peak is delayed until the dive ends because lactate is trapped in muscles whose blood supply is restricted during the dive.
Common Mistakes
- Stating only "the seal is anaerobic during the dive" without naming the pathway: it is the conversion of pyruvate to lactate by reduced NAD that is the marking point.
- Saying "the seal cannot breathe underwater, so it suffocates" — the seal has adaptations (myoglobin, bradycardia, peripheral vasoconstriction) and does not suffocate; the relevant point is that the muscles become anaerobic, not the whole animal.
- Confusing lactate with carbon dioxide or with ethanol. Only lactate is made in mammalian anaerobic respiration; ethanol is the yeast / plant anaerobic product.
- Saying "lactate is broken down" without specifying the oxidation to pyruvate or the role of the liver — both are required to earn the available marks.
- Saying "lactate is removed by the kidneys" — it is processed mainly by the liver, not excreted by the kidneys (although a small amount can be excreted in urine).
- Forgetting to mention that the rise in blood lactate is delayed until after the dive (because the muscles are poorly perfused during the dive itself).
Things to Be Careful About
- Each marking point needs the reason as well as the observation — "oxygen is not available, so anaerobic respiration occurs" not just "anaerobic respiration occurs".
- Use the precise term lactate (or lactic acid), not "acid" or "pyruvate".
- For "after the dive", the key concept is the return to aerobic respiration — make the link to oxygen explicitly.
- The graph clearly shows that the peak is after the dive (≈48 min, well after the 45 min dive end), so any answer that claims the peak is "during" the dive is misreading the figure.
- AVP is reserved for an additional valid point, e.g. oxygen debt / EPOC; do not use it as a substitute for the standard marking points.
Some seal species are classified as endangered on the IUCN Red List of Threatened Species™.
Suggest ways in which seal species may be conserved.
Answer
Any three of:
- Set up (captive) breeding programmes in zoos / aquaria (or 'frozen zoos' storing gametes / embryos) to maintain or increase population size.
- Establish marine reserves / protected areas where seals are safe from disturbance and from fishing activity.
- Introduce a ban on hunting / trade in seals (and seal products), with enforcement and CITES-style international agreements.
- Educate the public and stakeholders to raise awareness of seal conservation issues.
- Carry out research on seal ecology, population sizes and threats to inform conservation decisions.
- Reduce ocean / sea pollution (e.g. plastics, chemical run-off, oil spills) that harms seals and their prey.
- Reduce (over)fishing to maintain the seal's food supply and reduce accidental by-catch in nets.
- Reduce climate change (e.g. by cutting greenhouse-gas emissions), since warming seas and melting ice threaten seal habitat and prey.
Conservation measures for seals include captive breeding programmes, marine reserves, bans on hunting/trade, public education, research, reducing sea pollution, reducing fishing by-catch, and reducing climate change (any three).
Background Concept
Conservation is the active management of a species or habitat to reduce the risk of extinction. It is driven by the recognition that biodiversity has intrinsic value and also provides ecosystem services (food, tourism, nutrient cycling, etc.). For an endangered species, conservation biologists identify the threats acting on it and design interventions that either remove the threat, increase the population, or both.
For marine mammals such as seals, the main threats are:
- Direct exploitation — historical and ongoing hunting for fur, blubber and meat; by-catch in fishing gear; disturbance by boats and tourists.
- Habitat loss / degradation — coastal development, pollution (plastics, persistent organic pollutants, oil spills, noise), and the loss of haul-out sites and breeding beaches.
- Prey availability — overfishing removing the fish that seals depend on.
- Climate change — warming seas, sea-ice loss, ocean acidification, and shifts in the distribution of prey species.
Effective conservation of an endangered species usually combines in-situ measures (protecting the species where it lives — reserves, legal protection, threat reduction) with ex-situ measures (breeding and maintaining animals outside their natural habitat — zoos, aquaria, gene banks / "frozen zoos"), and is supported by legislation, research, monitoring, education, and international cooperation (e.g. CITES, IUCN, the Marine Mammal Protection Act).
Understanding the Question
Part (b) is a 3-mark "suggest" question. The question stem says "some seal species are classified as endangered on the IUCN Red List of Threatened Species™" and asks for ways in which seal species may be conserved. The mark scheme accepts any three valid conservation measures from a wide list. The candidate is not asked to prioritise or to discuss any one measure in depth — the answer should simply name three distinct, credible conservation actions.
Approach
- Think of conservation in two broad categories: actions that directly protect / increase the seal population (e.g. breeding programmes, reserves, bans on hunting) and actions that remove the underlying threat (e.g. reduce fishing, reduce pollution, reduce climate change).
- Pick three distinct points rather than three rewordings of the same idea — each must be a creditable, separate marking point.
- Match your wording to the mark scheme's expected terms (e.g. "captive breeding programme", "marine reserve", "ban on hunting") to be safe.
Step-by-Step Reasoning
-
Captive breeding programmes / frozen zoos. Small, vulnerable populations can be augmented by breeding seals in zoos or aquaria and releasing the offspring into the wild. Gametes and embryos can also be stored in "frozen zoos" for future use. This addresses the problem of small, declining populations.
-
Marine reserves / protected areas. Designating stretches of coastline and sea as reserves gives seals protected haul-out sites and breeding beaches, free from disturbance, hunting, fishing and certain forms of pollution. Reserves are an in-situ form of conservation.
-
Bans on hunting and trade. Seals have been hunted for their fur and blubber for centuries. A legal ban (often backed by international agreements such as CITES, which controls trade in endangered species) reduces direct mortality.
-
Education and awareness. Public awareness campaigns and stakeholder engagement (e.g. involving local fishing communities) help build support for conservation measures and reduce demand for seal products.
-
Research. Studying seal populations — their size, distribution, behaviour, genetics, disease status, and the threats they face — provides the evidence base for management decisions (e.g. where to place a reserve, whether a population is recovering).
-
Reduce ocean / sea pollution. Plastic waste, chemical pollution, oil spills, and noise pollution from shipping all harm seals and their prey. Pollution-control measures directly benefit the marine ecosystem.
-
Reduce fishing / by-catch. Seals are often killed accidentally in fishing nets. Technical fixes (e.g. acoustic deterrents, modified nets) and reductions in overfishing protect both the seals' food supply and the seals themselves.
-
Reduce climate change. Sea-ice loss, sea-temperature rise and ocean acidification all affect seal habitat and prey distribution. Cutting greenhouse-gas emissions is a long-term conservation measure.
Any three of these are valid and would earn full marks.
Key Takeaways
- Conservation combines in-situ measures (reserves, legal protection, threat reduction) with ex-situ measures (captive breeding, gene banks).
- Threats to marine mammals include hunting, by-catch, habitat loss, pollution and climate change — each can be tackled with a specific conservation response.
- Conservation is supported by research, monitoring, education, legislation, and international cooperation (CITES, IUCN).
- A good "suggest ways in which…" answer gives distinct points rather than reworded versions of the same idea.
Common Mistakes
- Giving vague answers such as "look after them" or "protect them" — these do not describe a concrete conservation measure and do not score.
- Repeating the same point in different words, e.g. "ban hunting" and "stop people killing seals" — the mark scheme treats these as one point.
- Confusing ex-situ measures (zoos, captive breeding) with in-situ measures (reserves) — both are valid but they are different marking points.
- Stating a problem rather than a solution, e.g. "pollution harms seals" without saying what is done about it.
- Confusing seal conservation with general "save the planet" statements that are not specific to seals.
Things to Be Careful About
- "Suggest" is an open command word — the candidate is free to choose any reasonable answer, but the chosen answer must be a concrete conservation action.
- The question is worth 3 marks, so three distinct points are needed.
- The mark scheme wording gives specific accepted terms (e.g. "marine reserves", "captive breeding programmes", "ban on hunting / trade"); using the same or similar language is the safest route to full credit.
- "Education" and "research" are both credited, but they are different marking points — make sure they are clearly distinct if both are offered.