Biology 9700/42 — February/March 2025
Cambridge A-Level · A Level Structured Questions · worked solutions for every part, with the mark scheme
Topics Selection and Evolution · Inheritance · Energy and Respiration · Classification, Biodiversity and Conservation · Genetic Technology · Homeostasis · +2 more
Different types of respiratory substrate can have different energy values and therefore release different quantities of energy when they are respired.
Complete Table 1.1 to show the energy value of each of the three main types of respiratory substrate.
Use one tick () to identify which of the two possible energy values is correct for each respiratory substrate.
Table 1.1
| type of respiratory substrate | energy value / | |
|---|---|---|
| approximately 17 | approximately 37 | |
| carbohydrate | ||
| lipid | ||
| protein |
Answer
Ticks placed as follows:
| type of respiratory substrate | ~17 kJ g⁻¹ | ~37 kJ g⁻¹ |
|---|---|---|
| carbohydrate | ✓ | |
| lipid | ✓ | |
| protein | ✓ |
carbohydrate ≈ 17, lipid ≈ 37, protein ≈ 17 (kJ g⁻¹)
Background Concept
Respiratory substrates release different amounts of energy per gram when oxidised. The three principal substrates — carbohydrates, lipids and proteins — have characteristic energy values that you are expected to know for A Level Biology.
- Carbohydrates (e.g. glucose, glycogen, starch) release approximately 17 kJ g⁻¹.
- Lipids (fats and oils) release approximately 37 kJ g⁻¹, more than double the energy per gram of carbohydrate, because their hydrocarbon chains are more reduced and can be oxidised further.
- Proteins release approximately 17 kJ g⁻¹, similar to carbohydrates; they are not the preferred respiratory substrate because they are needed for their structural and enzymatic roles, and the amine groups must first be deaminated in the liver.
Understanding the Question
The question provides a partly completed table with two possible energy values (~17 and ~37 kJ g⁻¹) and asks you to place one tick per row indicating the correct value for each substrate. The mark is awarded only if all three ticks are correct.
Approach
Recall the three energy values, then put a single tick in the correct column for each row. The lipid row is the easiest to place because of the large gap (~37 kJ g⁻¹ is much higher than ~17 kJ g⁻¹); carbohydrate and protein are similar to each other, so be careful not to confuse them.
Step-by-Step Reasoning
- Carbohydrate ≈ 17 kJ g⁻¹ → tick the left-hand column.
- Lipid ≈ 37 kJ g⁻¹ → tick the right-hand column.
- Protein ≈ 17 kJ g⁻¹ → tick the left-hand column.
If only one or two ticks are correct, no mark is awarded (the marking note states 'all three correct = 1 mark').
Key Takeaways
- Carbohydrate and protein both yield ~17 kJ g⁻¹; lipid yields ~37 kJ g⁻¹.
- Lipids store the most energy per gram, which is why they are the long-term energy store in animals.
Common Mistakes
- Confusing protein with lipid: protein is ~17 kJ g⁻¹, not ~37 kJ g⁻¹.
- Putting ticks in both columns for one substrate (you should place exactly one tick per row).
Things to Be Careful About
The mark is only awarded when all three ticks are correct, so check your table carefully before moving on.
Determining the respiratory quotient (RQ) of an organism can be used to indicate the main type of respiratory substrate that is being metabolised in respiration. This is because the different types of respiratory substrate have different RQ values. Table 1.2 shows typical RQ values for carbohydrate, lipid and protein.
Table 1.2
| type of respiratory substrate | RQ value |
|---|---|
| carbohydrate | 1.0 |
| lipid | 0.7 |
| protein | 0.8 |
State the name of the laboratory apparatus that can be used to determine the RQ value of organisms such as blowfly larvae.
Answer
Respirometer
Respirometer
Background Concept
A respirometer is a piece of laboratory apparatus used to measure the rate of oxygen uptake (and, indirectly, carbon dioxide release) of a small organism such as a blowfly larva, germinating seed, or woodlouse. It typically consists of a sealed chamber containing the organism, connected via a capillary tube to a coloured fluid. As the organism respires, the change in gas volume inside the chamber moves the fluid along the capillary, and the displacement per unit time gives the rate of oxygen uptake.
Understanding the Question
Part (b) introduces the idea of using RQ to identify the substrate being respired and asks you to name the apparatus used to determine the RQ of an organism such as a blowfly larva.
Approach
Recall the standard piece of apparatus for measuring gas exchange in small organisms in the A Level Biology syllabus.
Step-by-Step Reasoning
The RQ is calculated from the ratio of CO₂ produced to O₂ consumed. To obtain both quantities, the apparatus must measure oxygen uptake while also accounting for the carbon dioxide released. The standard item of equipment for this is a respirometer.
Key Takeaways
- A respirometer measures the volume change caused by respiration in a closed system.
- It is the standard apparatus for RQ determination of small organisms in the A Level syllabus.
Common Mistakes
- Writing 'spirometer' (an instrument used in human physiology to measure lung volumes, not gas exchange of small organisms).
- Writing 'gas analyser' or 'oxygen meter' — these are not the apparatus credited on the mark scheme.
Things to Be Careful About
Make sure you spell the word correctly — a misspelling such as 'respirrometer' is risky on a written paper.
When determining RQ values using the laboratory apparatus stated in (b)(i), chemicals such as soda lime or potassium hydroxide solution are used.
State the reason for using chemicals such as soda lime or potassium hydroxide solution when measuring RQ values.
Answer
To absorb (or remove) the carbon dioxide produced by the organism, so that the volume change measured reflects only the uptake of oxygen.
To absorb/remove the carbon dioxide produced during respiration.
Background Concept
In a respirometer, the organism takes in O₂ and releases CO₂. If both gases were free in the chamber, the two volume changes would partially cancel out and the net fluid movement would not equal the oxygen uptake. The standard solution is to include a chemical that absorbs only the CO₂ (commonly soda lime, or potassium hydroxide solution on filter paper), so that the only gas changing in volume is oxygen.
Understanding the Question
The question asks why chemicals such as soda lime or KOH are placed inside the respirometer during an RQ measurement.
Approach
Think about which gas is responsible for each component of the RQ measurement and which one must be eliminated to obtain a clean reading of oxygen uptake.
Step-by-Step Reasoning
- The organism consumes O₂ (volume decreases) and produces CO₂ (volume would increase).
- To measure the volume of O₂ taken in, the CO₂ must be removed from the air in the chamber.
- Soda lime and KOH react with (absorb) CO₂ but not with O₂.
- Therefore the only net change in gas volume is the decrease due to O₂ uptake, which moves the manometer/capillary fluid in proportion to the oxygen consumption.
Key Takeaways
- Carbon dioxide must be absorbed in a respirometer so the volume change observed is due solely to oxygen uptake.
- Soda lime or KOH are the standard absorbents used.
Common Mistakes
- Saying only 'to absorb gases' — you must specify CO₂, not O₂.
- Saying 'to provide oxygen' — these chemicals do not release oxygen, they absorb CO₂.
Things to Be Careful About
It is the carbon dioxide that is absorbed, not the oxygen. The mark scheme specifically credits 'to absorb / remove carbon dioxide'.
Organic acids such as malic acid can also act as respiratory substrates. When respired aerobically, their RQ values may be different to the RQ values of the main respiratory substrates.
Fig. 1.1 shows the formula that is used to calculate RQ values.

When malic acid is respired aerobically, the equation is:
Calculate how many molecules of oxygen are taken in when one molecule of malic acid is respired aerobically.
number of molecules of oxygen = ______
Working
Balance the equation by equating each element on both sides.
- C: 4 on the left, 4 on the right ✓
- H: 6 on the left, 6 on the right (from 3 × H₂O) ✓
- O: 5 + 2x on the left; 8 + 3 = 11 on the right → 2x = 6 → x = 3
Answer
3
3
Background Concept
When a respiratory substrate is oxidised in aerobic respiration, oxygen is consumed and carbon dioxide and water are released. The full balanced equation must conserve every element (C, H and O) on both sides. For an organic acid such as malic acid (C₄H₆O₅) the equation takes the same form as for a carbohydrate or lipid, but the stoichiometry of oxygen is different because the substrate already contains some oxygen atoms within its structure.
Understanding the Question
You are given a partly written equation for the aerobic respiration of one molecule of malic acid (C₄H₆O₅) and asked to fill in the number of molecules of O₂ required.
Approach
Balance the equation element by element. Start with carbon (easiest), then hydrogen, then oxygen (the trickiest because oxygen appears in the substrate as well as in O₂ and in the products).
Step-by-Step Reasoning
- Carbon: 4 carbons on the left must produce 4 CO₂ — already given, so carbon is balanced.
- Hydrogen: 6 H on the left, 3 H₂O on the right gives 6 H, so hydrogen is balanced.
- Oxygen: 5 oxygens in malic acid + 2x oxygens in xO₂ on the left; 8 from 4 CO₂ + 3 from 3 H₂O = 11 on the right.
So 5 + 2x = 11 → 2x = 6 → x = 3. - Therefore 3 molecules of O₂ are required.
Key Takeaways
- The oxygen in the substrate itself contributes to the products, so fewer O₂ molecules are required than the total oxygen in the products.
- A useful shortcut: total O atoms in products = 11; substrate already supplies 5; the remaining 6 must come from O₂, i.e. 3 molecules.
Common Mistakes
- Forgetting that the substrate contains its own oxygen atoms and so treating the equation as if 11 O₂ were required.
- A common incorrect answer is 4 or 5.
Things to Be Careful About
Double-check the count: 4 × 2 + 3 × 1 = 11 O atoms in the products; the substrate contributes 5, leaving 6 → 3 O₂.
Working
Answer
1.33
1.33
Background Concept
The respiratory quotient (RQ) is defined as the volume (or number of molecules) of CO₂ released divided by the volume (or number of molecules) of O₂ consumed during aerobic respiration. It is a useful diagnostic because different respiratory substrates have characteristic RQ values (carbohydrate ≈ 1.0, lipid ≈ 0.7, protein ≈ 0.8, organic acids can be higher or lower than 1).
Understanding the Question
You are asked to use the RQ formula shown in Fig. 1.1 together with the balanced aerobic respiration equation for malic acid from (c)(i) to find the RQ of malic acid, to two decimal places.
Approach
Read off the number of CO₂ molecules produced and the number of O₂ molecules consumed from the balanced equation, then divide.
Step-by-Step Reasoning
- From (c)(i), the equation is C₄H₆O₅ + 3O₂ → 4CO₂ + 3H₂O.
- CO₂ produced per malic acid = 4 molecules.
- O₂ consumed per malic acid = 3 molecules.
- RQ = 4 / 3 = 1.333…
- Rounded to two decimal places: 1.33.
Key Takeaways
- RQ for an organic acid can exceed 1.0 because the substrate is already partially oxidised — it contains C–O bonds but still releases a relatively large amount of CO₂ per O₂ taken in.
- A value of 1.33 indicates that, per molecule of O₂, more CO₂ than usual is being released, consistent with a substrate that is more oxidised than a carbohydrate.
Common Mistakes
- Inverting the ratio (writing 3/4 = 0.75). The RQ is CO₂ produced ÷ O₂ taken in, in that order.
- Quoting 1.3 instead of 1.33 — the question specifically asks for two decimal places.
Things to Be Careful About
Use the value of O₂ from (c)(i). If you made an error there, you may still obtain a mark here via error carried forward (ecf) provided your final value follows correctly from your (c)(i) answer.
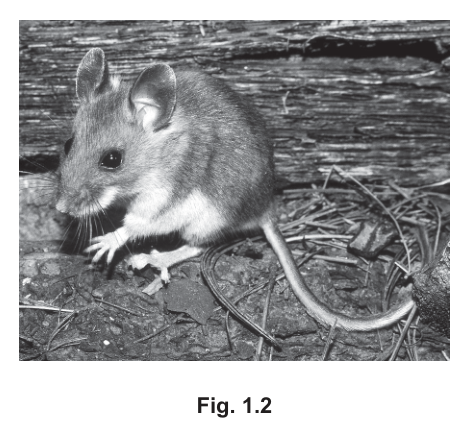
The deer mouse, Peromyscus maniculatus, lives in forests in North America.
Fig. 1.2 shows a deer mouse.
The deer mouse is active throughout the year and is much more active during the night than during the day.
At certain times of the year, deer mice spend a number of hours during the day in a physiologically controlled state of inactivity (not active), known as torpor. During this time there is a decrease in metabolic rate.
Fig. 1.3 is a graph showing the RQ of a deer mouse from 6:00 to 22:00 on a day that included time in torpor.
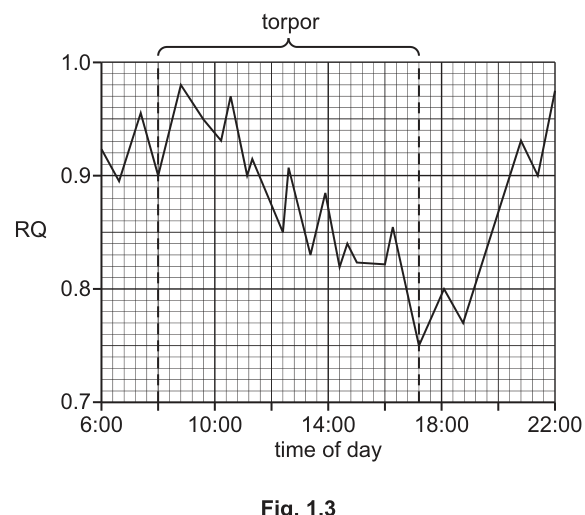
Describe the trend shown during torpor in Fig. 1.3 and suggest an explanation for this trend.
Answer
- During torpor the RQ value falls (overall decrease).
- Supporting data: RQ ≈ 0.9 at the start of torpor (about 08:00) and falls to RQ ≈ 0.75 by the end of torpor (about 17:00).
- This indicates that the deer mouse is respiring (metabolising) lipid (RQ ≈ 0.7) and/or protein (RQ ≈ 0.8) during torpor, rather than carbohydrate (RQ ≈ 1.0).
- (AVP) e.g. the carbohydrate / glycogen reserves of the mouse have run out, so it switches to lipid metabolism to meet its energy demands.
RQ falls during torpor, from ~0.9 to ~0.75, indicating a switch to respiring lipid/protein.
Background Concept
The respiratory quotient (RQ) reveals which substrate is being oxidised, because different substrates give different CO₂:O₂ ratios. Carbohydrate (RQ ≈ 1.0) yields one CO₂ per O₂; lipid (RQ ≈ 0.7) yields less CO₂ per O₂ because its hydrocarbon chains already contain a high H:C ratio; protein (≈ 0.8) lies in between. A shift in the RQ of an animal therefore indicates a shift in the substrate mix being respired.
Torpor is a short-term, controlled reduction in metabolic rate and body temperature. Energy demand is greatly reduced, but the animal must still keep respiring to stay alive, so it draws on its stored energy reserves.
Understanding the Question
Fig. 1.3 plots the RQ of a deer mouse between 06:00 and 22:00, with a period of torpor marked between roughly 08:00 and 17:00. You are asked to describe the trend during torpor and to suggest an explanation. The marking scheme awards three marks for: a description of the trend, a data quote, and an explanation in terms of substrate.
Approach
Read the start and end values of RQ during the torpor window from the graph, describe the overall change, and link that change to the substrate the mouse is now using (using Table 1.2 in the question as a reference).
Step-by-Step Reasoning
- At the start of torpor (about 08:00) the RQ is approximately 0.9 (close to 0.95 in places, but ~0.9 is a fair read).
- By the end of torpor (about 17:00) the RQ has fallen to approximately 0.75.
- The overall trend is therefore a decrease in RQ during torpor (with small fluctuations, but the general direction is downwards).
- The end value (~0.75) is close to the RQ of lipid (0.7) and protein (0.8), and well below the RQ of carbohydrate (1.0). This implies the mouse has switched from using mainly carbohydrate to using mainly lipid (and some protein) during torpor.
- A plausible biological explanation: easily mobilised carbohydrate / glycogen stores become depleted over the hours of torpor, so the mouse progressively oxidises stored lipid (and possibly some protein) to meet its reduced energy needs.
Key Takeaways
- A drop in RQ below 1.0 indicates that lipid (or protein) is contributing more to respiration than carbohydrate.
- Stored carbohydrate is the most readily mobilised fuel but is limited in quantity; lipid stores are vast but require more time to mobilise and oxidise.
- Torpor, by reducing energy demand, prolongs the use of these reserves.
Common Mistakes
- Saying only that the RQ 'decreases' without quoting values from the graph — the mark scheme explicitly requires a data quote.
- Saying the mouse 'is respiring fat because it is hungry' — you must link the RQ value (0.75) to the substrate table (lipid 0.7, protein 0.8) explicitly.
- Confusing torpor with hibernation (torpor is a daily/short-term state; hibernation is seasonal).
Things to Be Careful About
The trend is described using two figures from the graph (start and end of torpor). Choose values you can actually see on the curve. Small fluctuations around the trend are normal — describe the overall direction, not every wiggle.
Deer mice have a daily period of torpor only at certain times of the year.
Suggest reasons why a deer mouse enters torpor only at certain times of the year.
Answer
Any two from:
- During winter / cold weather, when food is scarce, entering torpor conserves energy stores and reduces heat loss to the cold environment.
- During summer / hot, dry conditions, remaining inactive in a burrow during the day conserves water and prevents overheating (the mouse is more active at night anyway).
- Torpor reduces activity, so the mouse is less conspicuous to predators during the part of the day when it would otherwise be exposed.
- (AVP) e.g. females with young may not enter torpor because they need to feed their offspring; in the breeding season torpor is suppressed.
Energy conservation when food is scarce (winter) and/or water/heat conservation (summer) and/or reduced predation risk.
Background Concept
Torpor is energetically expensive to enter and leave (it requires reheating the body, which costs ATP and therefore food reserves), so an animal should only enter torpor when the benefits clearly outweigh the costs. For a small endotherm such as the deer mouse, the costs of staying active and the benefits of becoming inactive both change with the season.
Key seasonal pressures on a small nocturnal mammal:
- Winter: low ambient temperature → high heat loss; food (insects, seeds) is scarcer; short day length → less time to forage. Conserving energy by being inactive during the day is very advantageous.
- Summer: high daytime temperatures → risk of overheating and dehydration; food is more abundant so a long rest is less costly; remaining hidden in a burrow during the day conserves water and reduces exposure.
- Year-round: small mammals suffer high predation; being hidden and still during the day reduces the chance of being seen by diurnal predators.
- Breeding season: females caring for young cannot afford to be inactive for long; torpor is generally suppressed.
Understanding the Question
The question states that deer mice enter torpor only at certain times of the year, and asks you to suggest reasons why. The mark scheme accepts any two reasonable suggestions, and the strongest answers link a specific seasonal factor (cold, food, water, predators) to a clear advantage of being in torpor.
Approach
For each potential advantage, name the season or environmental condition, state the pressure the mouse faces, and explain how torpor helps.
Step-by-Step Reasoning
- Winter / cold weather: small mammals lose heat rapidly because of their high surface area to volume ratio. When food is also scarce, reducing metabolic rate (torpor) cuts both the energy needed to keep warm and the food needed to fuel that energy. So torpor is favoured in winter.
- Hot, dry summer days: being active in a burrow during the day avoids overheating and reduces evaporative water loss; the mouse is anyway more active at night.
- Predation: being still and concealed during daylight, when many predators hunt, reduces the risk of being detected.
- AVP: e.g. during the breeding/lactating period, females must forage often to feed their young and so do not enter torpor.
Key Takeaways
- Torpor is a seasonally timed adaptation to environmental pressures on energy, water, temperature and predation.
- The most commonly credited reasons are: cold + food shortage (winter) and water/heat conservation (summer); predator avoidance and breeding constraints are also acceptable.
Common Mistakes
- Saying only 'to save energy' without specifying the season or the environmental pressure.
- Saying torpor helps the mouse 'find food' — torpor is a state of inactivity; the benefit is not feeding but reducing the need to feed.
Things to Be Careful About
The question asks for reasons why torpor occurs only at certain times of the year, so link your answer to a specific time of year or seasonal condition. Generic 'energy saving' statements without a seasonal anchor will not earn the mark.
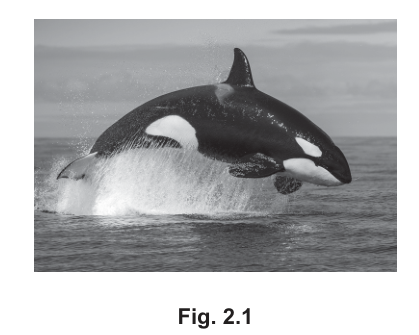
The orca, Orcinus orca, has the largest distribution of all aquatic mammals and is found in nearly all seas and oceans. Orca are social mammals that usually live in groups. These groups can vary in size.
Fig. 2.1 shows an orca.
There are a number of distinct types of orca. These distinct types of orca are classified as members of the same species. However, there is evidence that sympatric speciation is occurring.
There are two distinct types of orca in the Northeast Atlantic Ocean: Type 1 and Type 2. Type 1 orca feed mainly on fish. Type 2 orca feed mainly on aquatic mammals, such as seals.
Fig. 2.2 shows the locations in the Northeast Atlantic Ocean where Type 1 orca and Type 2 orca have been observed. Orca do not occur only in these areas and some groups of orca travel great distances.
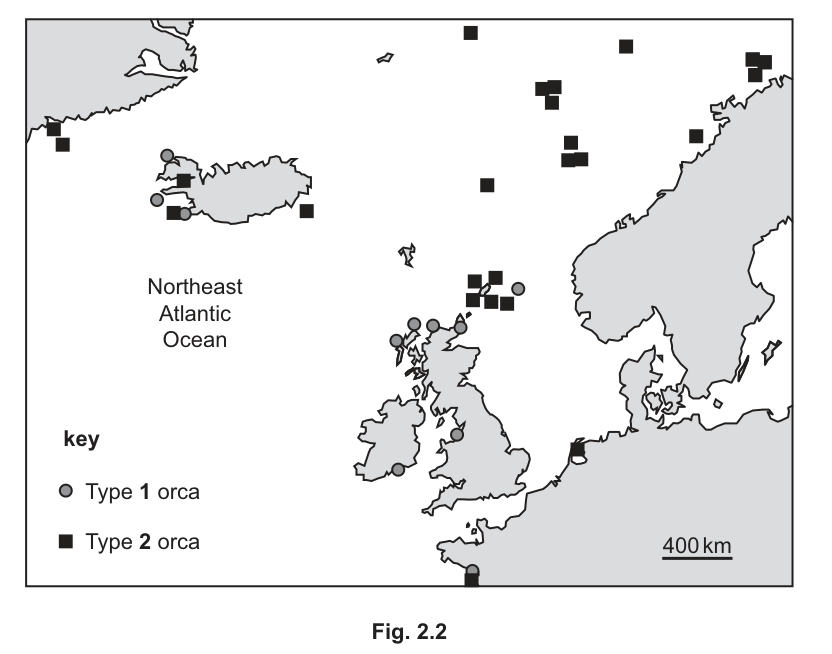
With reference to Fig. 2.2, explain why the type of speciation that is occurring in the orca is described as sympatric speciation.
Answer
The two types of orca are found in the same geographical area (e.g. around Iceland, the Faroe Islands, the northern UK and Norway), so there is no geographical separation between Type 1 and Type 2 orca — speciation is occurring within the same area.
no geographical separation between the two types of orca (they overlap in range)
Background Concept
Speciation is the formation of new species from an existing one. There are two main modes:
- Allopatric speciation: a population becomes geographically isolated (e.g. by a mountain range, ocean or river) and the separated groups evolve independently until they can no longer interbreed.
- Sympatric speciation: a new species arises within the same geographical area as the parent population, without any physical barrier. Separation is driven instead by behavioural, ecological or genetic isolation (e.g. different mating calls, different food sources, polyploidy in plants).
The defining feature of sympatric speciation, therefore, is that the diverging populations continue to share the same geographical range while reproductive isolation develops.
Understanding the Question
You are asked to use Fig. 2.2 to explain why the speciation occurring in Northeast Atlantic orca is described as sympatric. Fig. 2.2 shows circles (Type 1) and squares (Type 2) plotted in the Northeast Atlantic. The command word explain here means you should use the figure to justify the term 'sympatric'.
Approach
Look at the symbols on the map and ask: are Type 1 and Type 2 found in the same places, or in completely different places? If they overlap, there is no geographical separation, and this is the hallmark of sympatric (as opposed to allopatric) speciation.
Step-by-Step Reasoning
- Inspect Fig. 2.2 — both Type 1 (circles) and Type 2 (squares) are plotted in broadly the same waters around Iceland, the Faroe Islands, the northern UK, and the coast of Norway.
- There is no physical barrier (land, ice, current system shown) dividing the ranges of the two types.
- Because the populations co-occur geographically, any reproductive isolation between them cannot be due to distance or physical separation — it must instead be due to behavioural or ecological differences.
- This is exactly the criterion for sympatric speciation, hence the term applies.
Key Takeaways
- Sympatric = 'same homeland' (Greek syn = together, patria = homeland).
- The geographical overlap between Type 1 and Type 2 in Fig. 2.2 is the visual evidence for sympatric speciation.
- Sympatric speciation still requires a mechanism of reproductive isolation — that mechanism is explored in (a)(ii).
Common Mistakes
- Saying 'because they live in the same ocean' — too vague. Cite specific overlapping regions shown on the map (Iceland / Faroes / UK / Norway).
- Confusing sympatric with allopatric: remember allopatric requires geographical isolation, sympatric does not.
- Writing 'because they don't interbreed' — that is the consequence of speciation, not the reason the term 'sympatric' is used.
Things to Be Careful About
- Use the figure as evidence — do not give a textbook definition of sympatric speciation in place of a figure-based explanation.
- The mark is awarded for stating that there is no geographical separation between the two types.
Suggest examples of behavioural separation that would contribute to sympatric speciation of Type 1 orca and Type 2 orca.
Answer
- Type 1 and Type 2 orca do not interbreed, because they do not interact with each other;
- They have different courtship / mating behaviour, e.g. different mating calls or breeding at different times of year;
- They form different sized groups (e.g. Type 1 in larger pods, Type 2 smaller or solitary);
- They have different hunting / feeding behaviour — Type 1 hunt fish, Type 2 hunt other marine mammals such as seals.
Any three of: no interbreeding; different courtship / mating (calls, timing); different group sizes; different diets / hunting.
Background Concept
For sympatric speciation to occur, the two diverging populations must become reproductively isolated even though they share the same range. Reproductive isolation can occur before mating (prezygotic) or after mating (postzygotic). In animals, the most common route in sympatric speciation is behavioural isolation — differences in signals or habits that prevent mating even when individuals meet.
Behavioural isolation can involve:
- Differences in courtship displays or mating calls so individuals do not recognise each other as potential mates.
- Differences in breeding season / time of day of mating.
- Differences in habitat use within the same area (e.g. feeding in shallow vs deep water).
- Differences in diet or foraging behaviour that reduce encounters between the groups.
Understanding the Question
You are told that Type 1 orca feed mainly on fish and Type 2 feed mainly on seals / marine mammals, and that the two types share the same Northeast Atlantic range. You are asked to suggest behavioural separations (i.e. plausible behaviours that would keep the two types from interbreeding) that contribute to sympatric speciation. Suggest means propose reasonable possibilities — you do not need to know them as established fact.
Approach
Think about the kinds of behaviours that, if they differed between two populations in the same area, would prevent them from meeting at mating time. Then ask which of these could plausibly vary between orca types that already differ in diet.
Step-by-Step Reasoning
- Mating calls / courtship: if the two types produce different acoustic signals or perform different courtship displays, individuals may not recognise each other as mates. Orca are known to have distinct dialects within pods, so it is plausible that Type 1 and Type 2 calls differ.
- Breeding timing: if one type mates at a different time of year, the chances of cross-mating are reduced. Even slight seasonal differences in oestrus would suffice.
- Group size / social structure: orca populations vary in pod size. Type 1 might travel in larger family groups, Type 2 in smaller pods or as solitary individuals. Different social structures reduce interactions between the types.
- Diet / hunting behaviour: because Type 1 and Type 2 hunt different prey in different ways (fish vs seals), they spend time in different micro-habitats and use different hunting techniques. This further reduces the chance of mixed groups meeting, reinforcing isolation.
Any three of these four marking points (or other plausible behaviours) score full marks.
Key Takeaways
- Sympatric speciation requires behavioural or ecological isolation, not physical isolation.
- In social mammals such as orca, differences in group size, diet, and mating calls are realistic isolating mechanisms.
- Prezygotic isolation (especially behavioural) is the most common route to sympatric speciation in animals.
Common Mistakes
- Giving only one or two points when three are required.
- Writing vague statements such as 'they behave differently' — be specific (which behaviour?).
- Confusing behavioural with geographical or mechanical isolation.
- Omitting the link back to mating / not interbreeding.
Things to Be Careful About
- The mark scheme accepts either the general behaviour (e.g. 'different group sizes') or a specific example (e.g. 'groups vs solitary'). Either scores.
- Three independent points are needed; restating the same idea twice does not earn extra marks.
In the Southern Ocean, which surrounds Antarctica, there are three distinct types of orca: Type B, Type C and Type D.
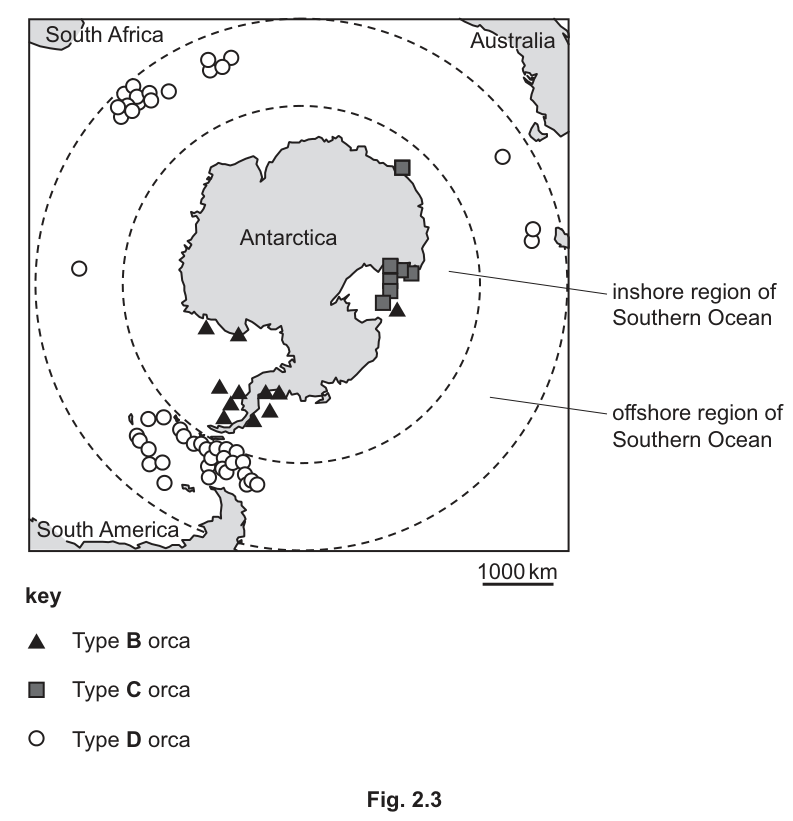
Fig. 2.3 shows the locations around Antarctica where Type B orca, Type C orca and Type D orca have been observed.
- Type B orca and Type C orca are mainly seen near the coastline of Antarctica (inshore).
- Type D orca are mainly seen in the Southern Ocean further away from the coastline of Antarctica (offshore).
There are phenotypic differences between the different types of orca. Fig. 2.4 shows a diagram of a Type B orca, a Type C orca and a Type D orca.
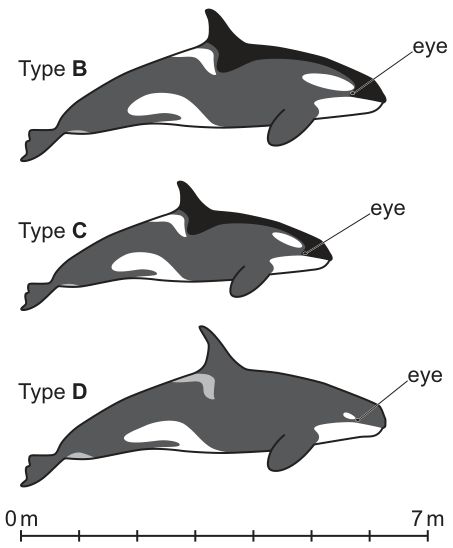
With reference to Fig. 2.4, state one way in which the Type D orca is different from both the Type B orca and the Type C orca.
Answer
Type D has a much smaller eye patch than both Type B and Type C (the white patch near the eye is very small / narrow in Type D but large in B and C).
small(er) eye patch
Background Concept
Phenotypic differences between closely related populations (or subspecies) are the raw material on which natural selection, genetic drift, or sexual selection act. Identifying consistent morphological differences is the classical first step in taxonomy and in detecting incipient speciation.
Understanding the Question
Fig. 2.4 shows side-view diagrams of Type B, Type C and Type D orca on the same scale (0–7 m scale bar). You are asked to state one way in which Type D differs from both Type B and Type C — a single, specific, observable difference from the figure.
Approach
Compare the Type D diagram with the Type B and Type C diagrams. Look at:
- Eye patch (size and shape)
- Dorsal fin (size and shape)
- Body / head shape
- Colour patches on the back, sides and underside
Pick one difference that is clearly shown in the diagram and unique to Type D.
Step-by-Step Reasoning
- In Fig. 2.4, the eye patch of Type B is large and roughly horizontal.
- The eye patch of Type C is smaller and slanted.
- The eye patch of Type D is very small and narrow — clearly smaller than in either B or C.
- Other differences visible: Type D has a bulbous / rounded head, no black 'cape' on the back, a small grey patch just behind the dorsal fin, and a taller, more pointed dorsal fin. Any one of these is acceptable.
Key Takeaways
- Phenotype = observable characteristics (morphology, colour, behaviour).
- Distinct, consistent morphological differences between populations are evidence that divergence is occurring.
Common Mistakes
- Giving a difference that is not shown in the figure (e.g. internal anatomy).
- Stating a size difference without giving a feature (size of what?).
- Listing more than one difference when only one is asked for.
Things to Be Careful About
- State = a single, direct answer — no explanation needed.
- The difference must distinguish Type D from both B and C, not just one of them.
Phenotypic differences between Type D orca and the other types of orca shown in Fig. 2.4 could have resulted from the process of genetic drift, including the founder effect.
Suggest how genetic drift could result in phenotypic differences between Type D orca and the other types of orca shown in Fig. 2.4.
Answer
- A small number of orca became isolated from the main population and migrated to the offshore region of the Southern Ocean (a chance event founded the Type D population);
- This group formed a small starting population with a small gene pool / low genetic diversity;
- By chance (the founder effect), the allele frequencies in this small population differed from those of the original population, and some alleles were lost;
- Over time, these changes in allele frequency produced the phenotypic differences seen between Type D and the other orca types (e.g. eye-patch size, head shape).
Founder effect / chance change in allele frequency in a small, isolated population leads to different phenotypes.
Background Concept
Genetic drift is the random (chance) change in allele frequency from one generation to the next, with no involvement of natural selection. Its effects are strongest in small populations, where chance events have a proportionally large effect on the gene pool.
The founder effect is a special case of genetic drift: when a new population is founded by a small number of individuals separated from the parent population, the founders carry only a sample of the original alleles — by chance, some alleles may be over-represented and others absent entirely. Subsequent generations inherit this biased gene pool, so the new population diverges genetically (and eventually phenotypically) from the original.
Understanding the Question
You are told Type D orca occur offshore in the Southern Ocean, geographically separate from the inshore Type B and Type C populations. You are asked to suggest how genetic drift (including the founder effect) could lead to phenotypic differences between Type D and the other types. Suggest means you need to construct a plausible chain of reasoning, not recall a single fact.
Approach
Identify the sequence of events the mark scheme rewards:
- Isolation of a small group from the parent population.
- Small starting population / small gene pool.
- Chance / founder effect acting on this small gene pool.
- Change in allele frequency / loss of alleles.
- Phenotypic consequences.
Step-by-Step Reasoning
- Isolation: a small group of orca became separated from the larger population and migrated to the offshore Southern Ocean region (Fig. 2.3 shows Type D is geographically separate from B and C).
- Small starting population: the founding group was small, so only a sample of the alleles present in the original population was carried into the new region.
- Small gene pool / low genetic diversity: with fewer individuals, the new population started with less genetic variation than the parent population.
- Founder effect / chance: by chance, the founders did not carry all the alleles from the parent population — some were absent from the start. Subsequent generations are built from this biased sample.
- Change in allele frequency: because the population remains small, genetic drift continues to change allele frequencies at random each generation; some alleles are lost, others become fixed.
- Phenotypic differences: the resulting change in allele frequencies produces the visible phenotypic differences seen in Fig. 2.4 (eye-patch size, head shape, dorsal fin, etc.).
Key Takeaways
- Genetic drift is most powerful in small populations and is driven by chance, not selection.
- The founder effect is genetic drift initiated by a small colonising group — it is the most likely mechanism behind the divergence of an offshore orca population.
- Drift causes changes in allele frequency, which in turn produce phenotypic change.
Common Mistakes
- Confusing genetic drift with natural selection — drift is random; selection is non-random (favours beneficial alleles).
- Saying 'inbreeding caused the differences' — inbreeding may occur in a small population, but the mark scheme's mechanism is founder effect / chance, not inbreeding per se.
- Forgetting to mention the small initial population size — without this, drift has little effect.
- Giving only one or two points when three are required.
Things to Be Careful About
- The question says 'including the founder effect', so founder effect specifically must be mentioned (or implied via 'chance' / small founding population).
- Drift affects allele frequencies, not individuals — be precise about the level at which the change occurs.
In the future, the different types of orca may be classified as separate species. If so, some of these newly classified species will have very small population sizes.
Suggest two factors, other than population size, that should be monitored when assessing the conservation status of any newly classified species of orca.
Answer
Any two of:
- Habitat (size / destruction / disturbance / pollution) — orca depend on a healthy marine environment;
- Hunting (by humans);
- Food source availability (e.g. fish stocks);
- Sea temperature (climate change);
- Genetic diversity / risk of inbreeding in a very small population;
- Any other valid factor, e.g. geographical range, migration patterns, disease, breeding frequency, mortality rate.
Any two of: habitat; hunting; food source; sea temperature; genetic diversity.
Background Concept
Assessing the conservation status of a species requires more than counting individuals. The IUCN Red List, for example, evaluates:
- Population size and trend (the factor excluded here).
- Geographic range (how restricted the species is).
- Habitat (quality, area, fragmentation).
- Threats such as hunting, pollution, climate change, disease.
- Genetic diversity (small populations risk inbreeding depression).
- Life-history traits (breeding rate, mortality).
For newly recognised species with very small populations, even moderate additional threats can rapidly drive extinction.
Understanding the Question
You are told some newly classified orca species will have very small population sizes. You are asked to suggest two factors, other than population size, that should be monitored when assessing conservation status. Suggest means propose plausible factors, not recall a fixed list.
Approach
Think about what could go wrong for a small orca population besides its size alone:
- Could their environment be degraded?
- Are they hunted or accidentally caught?
- Is their food supply secure?
- Is climate change altering their habitat?
- Are they genetically diverse enough to avoid inbreeding depression?
- What about disease or migration patterns that concentrate risk?
Step-by-Step Reasoning
- Habitat: orca depend on clean, productive seas. Pollution, noise (which interferes with echolocation), or destruction of coastal feeding grounds would affect survival.
- Hunting: although many orca populations are protected, illegal hunting or by-catch in fishing gear remains a threat in some regions.
- Food source: Type D orca, for instance, depend on specific prey. Overfishing of that prey could collapse the population regardless of its size.
- Sea temperature: climate change is altering sea temperatures and the distribution of prey species in polar waters, directly affecting orca range and feeding.
- Genetic diversity / inbreeding: very small populations have low genetic diversity and are vulnerable to inbreeding depression, which reduces fertility and survival.
- Any of the AVP options in the mark scheme (geographical range, migration patterns, disease, breeding frequency, mortality rate) is also acceptable.
Two of these give full marks.
Key Takeaways
- Conservation assessment is multi-dimensional — population size alone is insufficient.
- For marine apex predators, habitat quality, prey availability and climate are often as critical as numbers.
- Genetic diversity is a special concern for very small populations.
Common Mistakes
- Giving factors that are really aspects of population size (e.g. 'population growth rate') — these are excluded by the question.
- Being too vague: 'the environment' is not enough — specify what aspect (pollution, habitat destruction, temperature).
- Naming only one factor when two are required.
Things to Be Careful About
- Mark scheme AVP allows credit for less-obvious factors — anything biologically plausible specific to orca should be accepted.
- Stay focused on monitoring factors, not on conservation actions (e.g. 'create a marine reserve' is an action, not a monitored factor).
Gentamicin is an antibiotic used to treat severe bacterial infections in children.
Some children have a genetic mutation in the gene MT-RNR1. If gentamicin is given to children with this genetic mutation, it can cause deafness.
Before gentamicin can be given to a child with a severe bacterial infection, PCR (polymerase chain reaction) and electrophoresis are used to test whether the child has this mutation. If the mutation is found, a different antibiotic must be given.
Answer
- Taq polymerase is a DNA polymerase that synthesises a new, complementary DNA strand using the target (template) DNA.
- It binds to the primers (short DNA sequences complementary to the flanking regions of the target) and adds free DNA nucleotides to the 3' end of the primer during the extension stage of each PCR cycle.
- It has an optimum working temperature of about (extension step).
- It is thermostable — it does not denature at the high temperature (≈) used in the denaturation step, so it can be reused for many PCR cycles without needing to be replaced after each cycle.
Taq polymerase is a thermostable DNA polymerase that extends primers by adding DNA nucleotides during PCR, allowing repeated thermal cycling without denaturation.
Background Concept
The polymerase chain reaction (PCR) is an in-vitro method for amplifying a specific region of DNA. Each cycle has three temperature-controlled steps:
- Denaturation (≈): the double-stranded DNA is heated so the two strands separate by breaking the hydrogen bonds between complementary bases.
- Annealing (≈): short single-stranded DNA primers bind (anneal) to the flanking regions of the target sequence on each single strand.
- Extension (≈): a DNA polymerase adds free DNA nucleotides to the 3' end of each primer, synthesising a new complementary strand.
Because each new strand acts as a template in the next cycle, the number of target DNA molecules doubles per cycle, giving exponential amplification.
The DNA polymerase used must remain active after being heated to ≈. Ordinary human DNA polymerases would denature. Taq polymerase, isolated from the thermophilic bacterium Thermus aquaticus, is naturally heat-stable.
Understanding the Question
The question asks you to describe AND explain the role of Taq polymerase — that is, what it does and why it is suitable for PCR. Four marks are available, so four clear, distinct points are needed (one mark each). Pick points from the mark scheme's list of eight; any four that are biologically correct will earn the marks.
Approach
Start with the basic identification of what Taq polymerase IS (an enzyme, a DNA polymerase), then describe what it DOES in the cycle (synthesise new strands, bind primers, add nucleotides, act at the extension step), and finally explain WHY it is suitable (thermostable at , optimum at , can be reused). Linking the property of thermostability to the practical advantage — no need to add fresh enzyme after every denaturation step — is the key explanatory link that examiners look for.
Step-by-Step Reasoning
- MP1 — Type of enzyme. Taq polymerase is a DNA polymerase. This is the foundational identification; everything else flows from it.
- MP2 — What it does. It synthesises a new (complementary) DNA strand, using the single-stranded template exposed after denaturation.
- MP3 — Where on the DNA it acts. It binds to the primers that have already annealed to the target sequence, and adds nucleotides to the 3' end of each primer during the extension step. It cannot start a strand from scratch — it needs a primer with a free 3'-OH.
- MP4 — Temperature optimum. It works optimally at about , matching the extension temperature of a standard PCR programme.
- MP5 — Thermostability. It is not denatured by the ≈ denaturation step. This is the property that makes it the polymerase of choice.
- MP6 — Why thermostability matters. Because it survives the denaturation step, a single addition of enzyme at the start of the reaction can be reused for all 25–35 cycles, which would otherwise be impossibly laborious and expensive.
Any four of these earn the four marks. Stronger answers combine several, e.g. identifying the enzyme, naming what it does, stating the optimum temperature, and linking thermostability to repeated reuse.
Key Takeaways
- Taq polymerase is the heat-stable DNA polymerase used in PCR.
- It extends primers (cannot initiate synthesis) at the extension step of each cycle.
- Its thermostability is what makes automated thermal cycling practical.
Common Mistakes
- Calling it "a polymerase" without specifying DNA polymerase.
- Saying it "makes copies of DNA" without specifying that it synthesises a complementary strand using a template.
- Saying the enzyme "unwinds the DNA" or "separates the strands" — this is done by the high temperature, not the enzyme.
- Saying it adds nucleotides to either end of the primer (it must be the 3' end).
- Forgetting to link thermostability to re-use across many cycles.
Things to Be Careful About
- The mark scheme accepts for the optimum temperature.
- "Thermostable" is the required word; "heat-resistant" or "works at high temperatures" are less precise but usually still credited if the meaning is clear.
- A common trap is to describe PCR generally instead of focusing on Taq polymerase specifically — keep the answer centred on the enzyme.
PCR with primers specific to the MT-RNR1 gene is used to amplify DNA from the child that is being tested.
The PCR primers are designed so that the amplified product of the normal allele of MT-RNR1 is longer than the amplified product of the mutant allele.
Gel electrophoresis is used to separate the PCR products.
Fig. 3.1 shows the results of gel electrophoresis after using this method of PCR on DNA samples collected from three children.
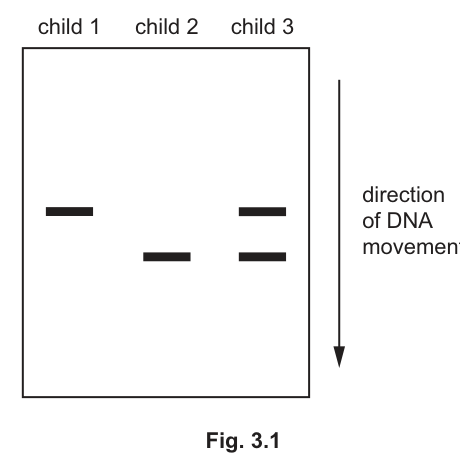
State which of the children in Fig. 3.1 cannot receive the antibiotic gentamicin to treat a severe bacterial infection.
Answer
Children 2 and 3 cannot receive gentamicin.
Working
- The normal allele of MT-RNR1 produces a longer PCR product → the band nearer the top of the gel (less far migrated).
- The mutant allele produces a shorter PCR product → the band further down the gel (migrated further).
- Child 1: only the longer (normal) band → homozygous normal → can be given gentamicin.
- Child 2: only the shorter (mutant) band → homozygous mutant → cannot be given gentamicin.
- Child 3: both bands → heterozygous (carries one mutant allele) → cannot be given gentamicin, because the mutation is present.
Children 2 and 3
Background Concept
The MT-RNR1 gene encodes a mitochondrial ribosomal RNA. A specific mutation in this gene predisposes carriers to aminoglycoside-induced ototoxicity — gentamicin (an aminoglycoside) damages the hair cells of the cochlea and causes irreversible deafness in anyone carrying even a single copy of the mutant allele. Screening before treatment is therefore essential, and the screening is done with PCR followed by gel electrophoresis.
In this test, primers are designed to amplify a region of MT-RNR1 that changes length when the mutation is present (the mutation creates or removes a sequence, so the amplified fragment is shorter in mutant DNA). On a gel, longer DNA fragments stay near the wells, while shorter DNA fragments travel further towards the anode.
Understanding the Question
The question gives you a completed gel (Fig. 3.1) with three children's DNA samples. You have to decide which child(ren) carry the mutation and therefore must NOT be given gentamicin. Note that this is a one-mark question, but the answer has two children in it, so reading the pattern correctly is essential.
Approach
Translate each child's band pattern into a genotype:
- one band at the "top" position = homozygous normal
- one band at the "bottom" position = homozygous mutant
- two bands (one at each position) = heterozygous
Then apply the rule: anyone with at least one mutant allele must not receive gentamicin. Only the homozygous normal child (Child 1) is safe.
Step-by-Step Reasoning
- Identify the gel setup. DNA migrates from top to bottom, so the band nearer the top has travelled less far, and the band further down has travelled further. Smaller/shorter DNA fragments travel further.
- Translate band position to allele type.
- The higher band (less far migrated) = the longer PCR product = the normal allele.
- The lower band (further migrated) = the shorter PCR product = the mutant allele.
- Read each lane.
- Child 1: one band, at the higher (normal) position → homozygous normal → safe to give gentamicin.
- Child 2: one band, at the lower (mutant) position → homozygous mutant → must NOT be given gentamicin.
- Child 3: two bands, one at each position → heterozygous → carries the mutant allele → must NOT be given gentamicin.
- Apply the rule. Children carrying even a single mutant allele cannot receive gentamicin, so the answer is Children 2 and 3.
Key Takeaways
- A single band on a gel can mean homozygous for whichever allele that band represents.
- Two bands at the two diagnostic positions means heterozygous.
- For a dominant adverse drug reaction, heterozygotes must also be excluded from the drug — carriers are not safe.
Common Mistakes
- Saying only Child 2 (forgetting the heterozygote Child 3).
- Saying only Child 3 (forgetting that a single mutant band also indicates the mutation).
- Misreading the gel direction — assuming the lower band represents the larger fragment.
Things to Be Careful About
- This is autosomal (mitochondrial) inheritance: the mutation is dominant in its effect on drug response, so a heterozygote is just as much at risk as a homozygote.
- A one-mark question with two names in the answer is a common Cambridge trap: the mark is only awarded if BOTH names are correct, so don't list them separately across multiple sentences.
Explain how gel electrophoresis produces the pattern of results shown in Fig. 3.1 from the PCR products of the MT-RNR1 gene.
Answer
- DNA fragments are negatively charged (because of the phosphate groups in the sugar–phosphate backbone), so when a voltage is applied across the gel, the DNA fragments migrate towards the positive electrode (anode).
- The gel acts as a molecular sieve: smaller/shorter DNA fragments move through the pores of the gel faster and further than larger/longer fragments.
- The PCR product from the normal MT-RNR1 allele is longer, so it travels a shorter distance through the gel and forms a band near the top (closer to the wells).
- The PCR product from the mutant allele is shorter, so it travels a greater distance and forms a band further down the gel.
- This produces the pattern in Fig. 3.1: Child 1 has only the upper (longer/normal) band; Child 2 has only the lower (shorter/mutant) band; Child 3 has both bands and is heterozygous.
DNA is negatively charged and migrates towards the anode; the gel separates fragments by size, with shorter (mutant) fragments travelling further than longer (normal) fragments, producing the observed pattern.
Background Concept
Gel electrophoresis separates DNA fragments (or proteins) by applying an electric field across a gel. Two principles govern DNA migration:
- Charge. Every nucleotide in DNA carries a phosphate group in the sugar–phosphate backbone, giving the whole molecule a uniform negative charge per unit length. So all DNA fragments — whatever their size — are pulled in the same direction by the electric field, towards the positive electrode (anode). The wells are loaded at the cathode (negative) end.
- Size. The agarose (or polyacrylamide) gel is a mesh of pores. Long DNA fragments are slowed by the mesh and so migrate more slowly; short DNA fragments slip through more easily and migrate faster. The result is that distance travelled is inversely related to fragment length.
A molecular-weight marker (DNA ladder) is run alongside the samples so that band positions can be converted to approximate sizes in base pairs (bp).
Understanding the Question
The question asks you to explain the mechanism of gel electrophoresis as it applies to the specific pattern in Fig. 3.1. That means you must state the underlying principles AND link them to what is actually shown: a single upper band in lane 1, a single lower band in lane 2, and both bands in lane 3. Four marks are available, so aim for three to four developed points.
Approach
Lay out the logic in this order:
- State the principle of separation (size-based).
- State WHY DNA migrates at all (its charge and the electric field).
- State the direction of movement (cathode → anode) and the consequence of size (shorter = further).
- Apply it to this specific experiment: the normal allele's PCR product is longer → less far; the mutant allele's PCR product is shorter → further; therefore Child 1 is homozygous normal, Child 2 homozygous mutant, Child 3 heterozygous.
Step-by-Step Reasoning
- MP1 — Separation by size. Gel electrophoresis separates DNA fragments according to their length (or mass). Fragments of different sizes are resolved into distinct bands.
- MP2 — DNA is negatively charged. The phosphate groups in the sugar–phosphate backbone give DNA an overall negative charge.
- MP3 — Direction of movement. The negatively charged DNA is attracted to the positive electrode (anode) and therefore migrates from the wells (cathode end) towards the anode.
- MP4 — Size determines distance. Smaller/shorter DNA fragments experience less resistance from the gel matrix and so migrate faster and further. Conversely, longer fragments travel less far in the same time.
- MP5 — Application to Fig. 3.1.
- The PCR product from the normal allele is longer → travels a shorter distance → upper band.
- The PCR product from the mutant allele is shorter → travels a greater distance → lower band.
- Child 1 (one upper band only) is homozygous normal; Child 2 (one lower band only) is homozygous mutant; Child 3 (both bands) is heterozygous.
Key Takeaways
- Gel electrophoresis separates DNA by size because of the sieving effect of the gel.
- All DNA moves the same direction (to the anode) because the charge-to-mass ratio is uniform.
- Shorter fragments travel further in a given time — this is the principle that allows alleles of different lengths to be distinguished.
Common Mistakes
- Saying DNA moves towards the negative electrode — DNA is negative and so is repelled by the negative electrode, attracted to the positive one.
- Saying larger fragments move faster because they "have more charge" — all DNA has the same charge per unit length, so charge does not differ between fragments.
- Failing to link the principle to the actual bands in Fig. 3.1 (so the answer reads like a generic description of electrophoresis with no link to MT-RNR1).
- Confusing "size" with "mass" — both are accepted, but do not say "shape" or "density".
Things to Be Careful About
- The mark scheme phrases the size point as "smaller DNA fragments migrate faster/further" (or, in reverse argument, "longer fragments migrate slower/less far"). Either wording earns the mark, but be consistent.
- The explanation must include BOTH the direction of movement (charge-based) AND the size-based separation; missing one of these forfeits a mark.
- For part (iii) you do NOT need to re-state which child is which genotype — that was part (ii). Focus on the mechanism.
Some bacteria have plasmids that contain a gene conferring resistance to gentamicin. The gene can be transferred to other bacteria.
Suggest how the gentamicin-resistance gene can be transferred to other bacteria.
Answer
The gene can be transferred by horizontal gene transfer between bacteria, for example by:
- conjugation — direct transfer of the plasmid from one bacterial cell to another through a pilus;
- transduction — transfer of the gene by a bacteriophage (virus that infects bacteria);
- transformation — uptake of free DNA / plasmid from the surrounding environment by a recipient bacterium.
By horizontal gene transfer between bacteria, e.g. conjugation, transduction or transformation (transfer of plasmids).
Background Concept
Bacteria can acquire new genes by horizontal gene transfer (HGT) — the movement of genetic material between cells of the same generation, as opposed to vertical transmission from parent to offspring. HGT is the reason antibiotic-resistance genes can spread rapidly through a bacterial population, even between species. Three classical mechanisms are recognised:
- Conjugation: a donor bacterium forms a pilus (conjugation tube) that connects to a recipient cell; a copy of the plasmid is transferred through the pilus. This is the most important mechanism for plasmid-borne resistance genes.
- Transduction: a bacteriophage (a virus that infects bacteria) accidentally packages bacterial DNA from one host and injects it into another.
- Transformation: a bacterium takes up free DNA released into the environment (e.g. from dead, lysed cells) and incorporates it.
A fourth, transfection, refers specifically to the uptake of viral nucleic acid by a cell and is occasionally accepted by mark schemes in this context. Any one of these terms scores the mark.
Understanding the Question
The question has told you that the resistance gene is on a plasmid in some bacteria, and that it can be transferred to other bacteria. It is a one-mark "suggest" question — you need to name ONE valid mechanism. You do not need to describe the mechanism in detail; one correct term is enough. Because the word "suggest" is used, the mark scheme is permissive and accepts any of the four mechanism names.
Approach
Recognise that plasmid transfer between bacteria is horizontal gene transfer. The simplest answer that earns the mark is the catch-all phrase "horizontal transmission / horizontal gene transfer" or a named mechanism (conjugation, transduction, transformation). Pick the one you can spell confidently — any of them scores.
Step-by-Step Reasoning
- The gene is on a plasmid, so it can move with the plasmid.
- Plasmids can be transferred between bacteria by conjugation (the classic answer for plasmid transfer), where the plasmid is copied and a copy is passed through a pilus to a recipient cell.
- Plasmids (or chromosomal DNA containing the gene) can also be moved by transduction (via a bacteriophage) or by transformation (uptake of free DNA from the environment).
- Any one of these mechanisms, or the umbrella term "horizontal gene transfer", scores the mark.
Key Takeaways
- Antibiotic-resistance genes on plasmids spread between bacteria by horizontal gene transfer.
- Conjugation is the principal mechanism for plasmid transfer — direct cell-to-cell contact via a pilus.
- Transduction and transformation are also valid, less common routes.
Common Mistakes
- Describing the mechanism but forgetting to name it — the mark is for the term.
- Saying "by binary fission" or "by reproduction" — these are vertical transmission, not horizontal, and do not move genes between unrelated cells.
- Confusing the term with a different process, e.g. "translation", "transcription" or "transfection" (transfection can be credited but is less commonly known).
Things to Be Careful About
- "Conjugation" in this context means bacterial conjugation — do not confuse it with the eukaryotic process of exchanging genetic material (e.g. in ciliates).
- The question is about how the gene moves between cells, not about how it arose (which is by random mutation) or how it spreads through a population (which is by natural selection acting on the resistance phenotype).
The HFE gene codes for the HFE protein, which has a role in the regulation of iron absorption by the body. Iron is an essential mineral that can be obtained only from the diet.
A mutation of the HFE gene known as C282Y causes hereditary haemochromatosis, which is an autosomal recessive disease. The mutant allele codes for a non-functioning protein. People who are homozygous for the mutant allele produce no functioning HFE protein and this results in an excess of iron being absorbed by the body. The accumulation (build-up) of iron in body organs over many years can cause organ damage.
People that are heterozygous for the HFE gene do not have hereditary haemochromatosis. They do absorb more iron from their diet than people who do not have the mutation, but this does not usually have any health effects.
Construct a genetic diagram of a monohybrid cross to show how two parents who do not have hereditary haemochromatosis can produce a child with the disease.
Use the following symbols:
= normal HFE allele
= mutant HFE allele.
Answer
Both parents must be heterozygous (carriers) Hh, because they do not have the disease but can pass a recessive allele to an affected child.
Parents: Hh × Hh
Parental gametes: (H, h) × (H, h)
Offspring genotypes: HH, Hh, Hh, hh (ratio 1 : 2 : 1)
Offspring phenotypes: no disease : no disease : no disease : hereditary haemochromatosis (ratio 3 : 1)
Hh × Hh → 1 HH : 2 Hh : 1 hh → 3 no disease : 1 haemochromatosis
Background Concept
The HFE gene has two alleles in this question: a dominant normal allele H and a recessive mutant allele h. Because hereditary haemochromatosis is autosomal recessive, only individuals who are homozygous recessive (hh) express the disease. Heterozygotes (Hh) and homozygous dominants (HH) are both unaffected, although the stem tells us that heterozygotes absorb slightly more iron than normal homozygotes.
A monohybrid cross considers one gene at a time. The possible offspring genotypes from any cross are determined by the random fusion of gametes, each carrying only one of the two alleles of the gene. A Punnett square is the standard way to display this: the gametes of one parent form the column headings and the gametes of the other form the row headings; the body of the square then shows every possible fusion.
Understanding the Question
The question asks for a genetic diagram showing that two unaffected parents can produce an affected child. The only way this is possible is if both parents are heterozygous carriers (Hh) — homozygous dominant parents could not pass on a recessive disease allele at all. The candidate must show the parents' genotypes, their gametes, the four possible offspring genotypes, and the resulting phenotypes.
Approach
- Recognise that the parents must be Hh, because an hh child requires an h allele from each parent and the parents themselves are unaffected.
- State the parental cross as Hh × Hh.
- State the gametes each parent can produce: H or h.
- Lay out a Punnett square to show the four offspring genotypes.
- Convert each genotype to a phenotype, noting that only hh gives the disease.
Step-by-Step Reasoning
Parents: Hh × Hh
Gametes from each parent: H or h
The Punnett square combines the gametes of the two parents:
| H | h | |
|---|---|---|
| H | HH | Hh |
| h | Hh | hh |
This gives the offspring genotype ratio 1 HH : 2 Hh : 1 hh, i.e. one homozygous dominant, two heterozygotes and one homozygous recessive.
Translating to phenotype:
- HH — no disease (two normal alleles produce enough functional HFE protein)
- Hh — no disease (one normal allele is enough; heterozygotes do not have haemochromatosis)
- hh — hereditary haemochromatosis (no functional HFE protein)
Phenotype ratio: 3 no disease : 1 haemochromatosis.
The diagram therefore satisfies the requirement that two unaffected parents can produce an affected child, because each Hh parent has a 1-in-2 chance of passing the h allele, and only the hh combination expresses the disease.
Key Takeaways
- An autosomal recessive disease can skip generations: unaffected parents can have affected offspring only if both are carriers (heterozygotes).
- A Punnett square systematically shows all possible gamete fusions and is the standard way to present a monohybrid cross.
- The genotype ratio from a heterozygote × heterozygote cross is 1 : 2 : 1, and the phenotype ratio for a recessive trait is 3 : 1.
Common Mistakes
- Using Hh × hh or HH × hh as the parents — these do not satisfy the question's requirement that the parents are unaffected.
- Forgetting to state the parental gametes explicitly (the mark scheme credits these separately from the offspring genotypes).
- Writing the offspring phenotypes without first stating the offspring genotypes.
- Confusing the symbols: H must be the dominant (normal) allele and h the recessive (mutant) allele.
Things to Be Careful About
- Use the exact symbols given in the question (H for normal, h for mutant).
- The mark scheme awards a separate mark for the gametes, a separate mark for the offspring genotypes and a separate mark for the phenotypes — all three must be present.
- A Punnett square in tabular form is fully acceptable, as is a list of offspring with genotypes and phenotypes.
Some scientists believe that the C282Y mutation may have first occurred in Ireland.
Scientists sequenced DNA obtained from two human fossil skeletons in Ireland. One of the fossils was 5200 years old and the other was 4000 years old.
The scientists concluded that:
- the human living 4000 years ago did have the C282Y mutation
- the human living 5200 years ago did not have the C282Y mutation.
Explain how analysis of the results of these DNA sequencing studies could have been carried out to allow the scientists to make these conclusions.
Answer
- The known DNA base sequence of the HFE gene, including the C282Y mutant version, was obtained from DNA sequence databases / bioinformatics resources.
- DNA was extracted from each fossil skeleton, the HFE gene region was sequenced, and the fossil sequence was compared with the reference sequences for the normal HFE allele and for the C282Y mutation.
- A match with the normal reference sequence means the individual did not carry the mutation; a match with the C282Y reference sequence means the individual did carry it (so the 5200-year-old fossil matched the normal sequence, the 4000-year-old fossil matched the C282Y sequence).
Compare fossil DNA sequences with the known HFE / C282Y reference sequences held in databases.
Background Concept
DNA sequencing reads the order of nucleotide bases in a region of DNA. Once a gene's normal sequence has been worked out, it is stored in public databases (e.g. GenBank, Ensembl) along with any documented mutations. Bioinformatics is the use of computer-based tools to search, retrieve and compare these stored sequences. Any new sample — including ancient DNA from a fossil — can be sequenced and its sequence aligned against the reference to identify whether it carries a known mutation.
Understanding the Question
Two fossil skeletons, one 5200 and one 4000 years old, were sequenced. The scientists needed to decide whether the HFE gene in each fossil contained the C282Y point mutation. The question asks how the analysis was carried out to make this conclusion possible.
Approach
State the role of known sequence data (databases) and the role of comparison between fossil and reference sequences.
Step-by-Step Reasoning
- The DNA base sequence of the HFE gene — and of the C282Y mutant version of it — is already known and stored in DNA sequence databases / bioinformatics resources.
- DNA is extracted from each fossil skeleton, the HFE gene region is amplified (typically by PCR) and sequenced.
- The fossil sequence is compared with the reference sequence(s) of the normal HFE allele and with the known C282Y mutant sequence.
- A match with the normal reference sequence means the individual did not carry the mutation; a match with the C282Y reference means the individual did carry it. The 5200-year-old fossil matched the normal sequence and the 4000-year-old fossil matched the C282Y sequence.
Key Takeaways
- DNA sequencing plus database comparison (bioinformatics) is the standard way to detect known mutations in unknown samples.
- Ancient DNA is often degraded, so amplification (PCR) of the relevant region is usually needed before sequencing.
- A positive identification of a mutation requires a sequence match with a previously characterised reference sequence.
Common Mistakes
- Stating vaguely that the DNA was 'analysed' without mentioning comparison with known sequences or databases.
- Confusing the direction of the comparison (e.g. claiming the reference was derived from the fossil rather than the other way round).
- Failing to name the C282Y sequence specifically — the question is about a specific mutation, not just any difference in the HFE gene.
Things to Be Careful About
- The mark scheme awards a mark for mentioning the use of known sequences / databases, and another mark for comparing fossil DNA with that known sequence. Both points must appear.
At about the same time as the C282Y allele is thought to have first occurred in Ireland, the lifestyle of people in Europe began to change from hunter-gatherers to farmers.
Hunter-gatherers ate mainly meat with some wild plant food. Their diets had high quantities of iron. Early farmers ate mainly plants with some meat. Their diets had lower quantities of iron and these quantities were often inadequate (not enough).
Fig. 4.1 is a map of Europe showing the percentage of people in different countries who now have one C282Y allele of the HFE gene.
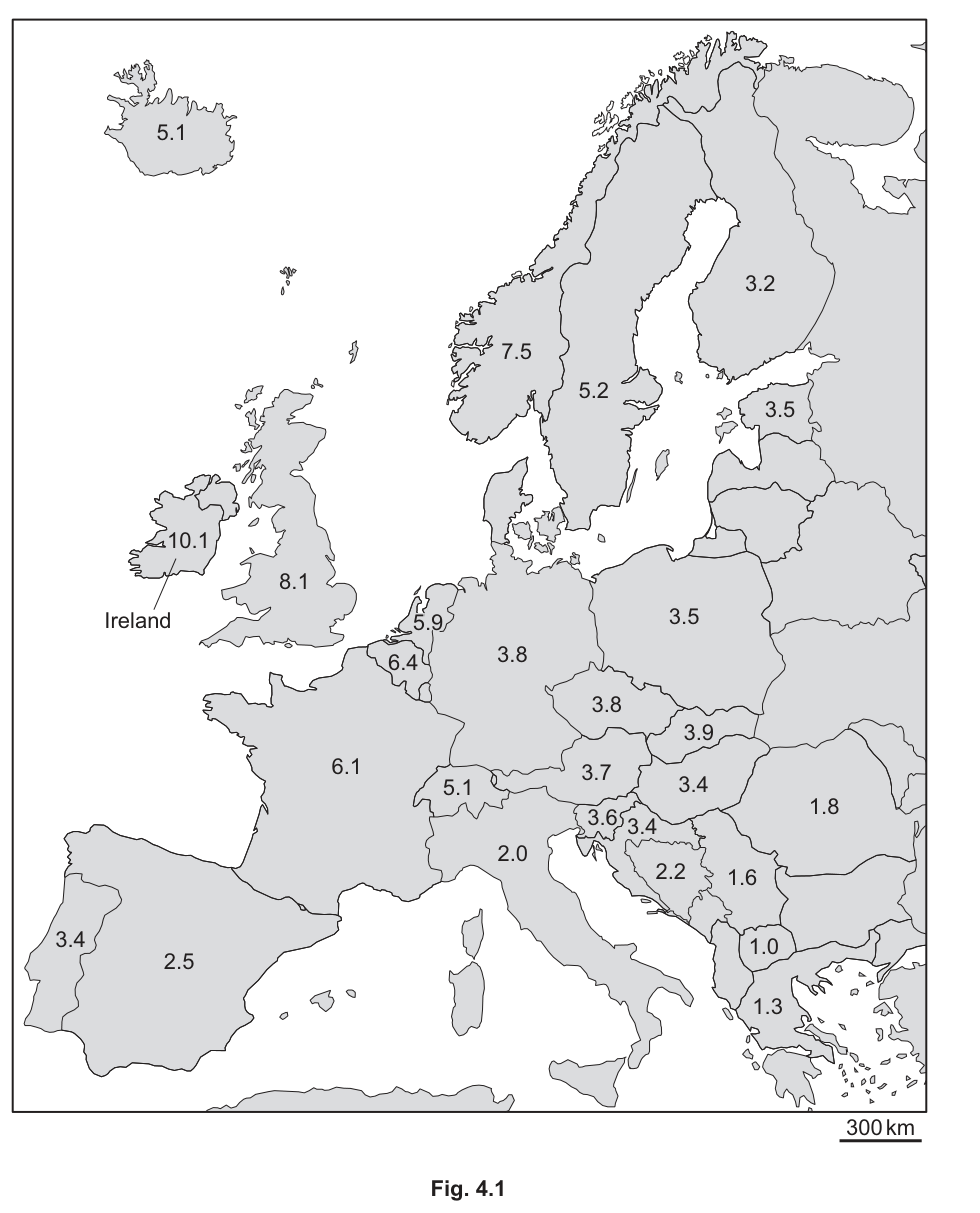
Fig. 4.1 shows that the C282Y allele does not occur only in Ireland and is now present throughout Europe. The C282Y allele has been maintained in European populations, even though it is a cause of hereditary haemochromatosis.
Suggest how the C282Y allele of HFE has been maintained in European populations.
Answer
- When the lifestyle changed to farming, the diet contained much less iron, so iron deficiency became a selection pressure.
- Heterozygotes (Hh) absorb more iron than people with two normal alleles, so they are less likely to suffer from iron deficiency (heterozygote advantage).
- These heterozygotes were more likely to survive and reproduce, so the frequency of the C282Y allele increased in the population by natural selection.
- In modern diets the allele is effectively neutral in heterozygotes (no iron deficiency and no disease), so it is still maintained in the population.
Heterozygote advantage: increased iron absorption protects against iron deficiency in low-iron farming diets, so the allele is maintained by natural selection.
Background Concept
Natural selection acts on heritable variation in a population. If individuals carrying a particular allele have greater survival or reproductive success in a given environment, that allele's frequency in the population increases over generations. A situation in which heterozygotes have higher fitness than either homozygote is called heterozygote advantage; the classic textbook example is the sickle-cell allele (HBB^S) in malarial regions, and the C282Y allele of HFE is sometimes presented as a parallel example in relation to iron deficiency.
A recessive disease allele can be maintained at relatively high frequency if, in heterozygous form, it confers a survival benefit that outweighs the disadvantage of the rare homozygous-recessive individuals who do become ill.
Understanding the Question
The stem says the C282Y allele has been maintained in European populations even though homozygotes develop a serious disease. The question asks the candidate to suggest how the allele has been maintained. The expected answer is heterozygote advantage driven by a low-iron diet during the early farming era, with a secondary point that in modern, iron-rich diets the allele is effectively neutral in heterozygotes.
Approach
- Identify the change in diet (low iron) as a new selection pressure.
- State the advantage conferred on heterozygotes.
- State the consequence in terms of survival and reproduction.
- State the consequence in terms of allele frequency, and name the process as natural selection.
- (Optional) Note the modern situation in which the allele is effectively neutral in heterozygotes.
Step-by-Step Reasoning
- Low dietary iron acts as a selection pressure: people with insufficient iron become ill and may be less able to survive and reproduce.
- Heterozygotes (Hh) absorb more iron from their food than HH individuals (the stem says this explicitly), so they are less likely to become iron deficient.
- Therefore heterozygotes have a greater chance of surviving and reproducing in a low-iron environment — this is heterozygote advantage.
- Because more heterozygotes passed on the h allele, the frequency of h in the population increased over generations. This is natural selection.
- In modern, iron-rich diets the C282Y allele is essentially neutral in heterozygotes (they get enough iron but rarely suffer the disease, because disease occurs only in homozygotes). An allele that is not strongly selected against can persist in a population for many generations.
The candidate should also be aware that the question allows additional credit (AVP) for valid points such as: the allele may also confer protection against other diseases, or that the allele frequency in present-day populations reflects past selection rather than current selection.
Key Takeaways
- Recessive disease alleles can be maintained by heterozygote advantage if the heterozygote phenotype is beneficial in some environmental condition.
- A change in environment (here, the shift to farming) can create a new selection pressure that favours an allele previously rare or neutral.
- Allele frequencies in a modern population reflect the cumulative effect of selection over many generations; an allele currently neutral may be common because of past advantage.
Common Mistakes
- Stating only that heterozygotes 'have an advantage' without specifying the advantage (more iron absorbed, less likely to be iron deficient).
- Failing to name natural selection or to link survival/reproduction to allele frequency.
- Claiming the allele is maintained by mutation alone — mutation introduces new alleles but cannot by itself maintain a high frequency.
- Confusing heterozygote advantage with the disease being harmless in heterozygotes (it is not 'harmless' — heterozygotes have a measurable phenotype, increased iron absorption).
Things to Be Careful About
- The mark scheme credits four points, and the answer should make the chain from selection pressure → heterozygote advantage → survival/reproduction → allele frequency explicit.
- A named example of the heterozygote advantage (e.g. 'less likely to be iron deficient') is required for full credit.
Suggest explanations for the differences in the percentage of people in different European countries who have one C282Y allele of the HFE gene, as shown in Fig. 4.1.
Answer
- The highest percentage of C282Y carriers is in Ireland, where the mutation is thought to have first occurred, and the frequency is lower in countries further from Ireland.
- Allele frequencies fall with distance from Ireland because of migration (gene flow) out of the original population into the rest of Europe; the further from Ireland, the more the allele frequency is diluted by mixing with non-carrier populations.
- Geographical barriers (e.g. mountains, seas) and political borders have restricted migration between some populations, producing local differences.
- Differences in diet between countries and differences in the availability of treatment for hereditary haemochromatosis (e.g. blood-letting) will alter the selection pressure on the allele and hence its frequency.
Highest in Ireland (origin); falls with distance because of migration / gene flow; affected by barriers, diet and medical treatment.
Background Concept
Allele frequencies in modern populations reflect their evolutionary history. A new mutation occurs in one individual in one place; over time it can spread through migration (gene flow) into neighbouring populations, becoming diluted as it does so. The further a population is from the origin of the mutation, the lower its frequency tends to be — unless selection or further migration events have altered the pattern. Geographical barriers (mountains, seas) and political borders restrict gene flow, while differences in environment and in medical care alter the selection pressure acting on the allele.
Understanding the Question
Fig. 4.1 shows the percentage of people with one C282Y allele in different European countries. The map shows a clear gradient, with the highest percentage in Ireland (10.1%) and generally lower percentages in countries further away. The candidate must suggest explanations for these differences.
Approach
Read the map for the spatial pattern and then propose a small number of plausible explanations consistent with that pattern: origin, migration, barriers, diet and medical care.
Step-by-Step Reasoning
- The C282Y mutation is thought to have first occurred in Ireland. The highest percentage in Ireland is therefore consistent with the mutation having arisen there and been present in the local gene pool for longest.
- The percentage generally falls with distance from Ireland (e.g. UK 8.1%, Norway 7.5%, France 6.1%, Spain 2.5%, Italy 2.0%). This pattern is consistent with migration of carriers out of Ireland into neighbouring countries, with allele frequency being diluted by mixing with non-carrier populations the further the gene flow spreads.
- Migration is not uniform: geographical barriers (e.g. the Alps, the Mediterranean) and political borders have slowed gene flow into some regions, producing local differences in allele frequency. For example, southern European countries (Italy, Greece) have very low frequencies.
- Diet and medical care vary between countries. In countries with a low-iron diet, the heterozygote advantage described in part (c)(i) maintains the allele at higher frequency; in countries where haemochromatosis is well-managed (e.g. routine blood-letting), the homozygous-recessive individuals survive and reproduce, so the allele is not strongly selected against and can persist.
Key Takeaways
- Patterns of allele frequency across a continent often reflect a combination of origin, migration, gene flow, geographical isolation, and selection.
- Reading a distribution map correctly involves identifying the spatial pattern (here, a fall with distance from Ireland) and offering several plausible mechanisms rather than a single explanation.
- Migration dilutes allele frequencies as it spreads them; barriers preserve local differences.
Common Mistakes
- Offering only one explanation when the question asks for suggestions (the mark scheme expects up to three independent points).
- Failing to link the highest frequency in Ireland to the proposed origin of the mutation.
- Ignoring the role of barriers and borders in slowing gene flow.
- Suggesting without justification that differences are due to 'different races' — this is not a biological mechanism and would not be credited.
Things to Be Careful About
- The mark scheme credits three independent points; aim to make all three clearly distinct.
- 'Migration' alone is too vague — it is the direction of migration (out of Ireland into the rest of Europe) and its limitation by barriers that explain the observed pattern.
Biological databases contain DNA sequence data from a large number of different people.
Table 4.1 shows three of these databases and the percentage of people in each database who have one C282Y allele of the HFE gene.
Table 4.1
| database | percentage of people who have one C282Y allele of the HFE gene |
|---|---|
| database A | 2.6 |
| database B | 9.1 |
| database C | 6.3 |
Suggest one reason for the differences between the three databases shown in Table 4.1.
Answer
The three databases may contain DNA from people of different ethnicities / nationalities / regions, so the sample of people is not the same in each database.
The databases sample people of different ethnicities / regions.
Background Concept
Allele frequencies differ between human populations because of their different evolutionary histories. A database that is dominated by DNA samples from one region or ethnic group will record a different frequency for an allele than a database drawn from a different region. Sample size also matters: a small database records less reliable frequencies than a large one.
Understanding the Question
The table shows three databases with very different percentages of people carrying one C282Y allele (2.6%, 9.1%, 6.3%). The candidate must suggest one reason for the differences. The mark scheme accepts any one valid reason, with the most common answers being differences in sample size, ethnicity or region/country of origin of the people whose DNA is in each database.
Approach
Suggest a single, plausible difference between the samples that would lead to different recorded percentages.
Step-by-Step Reasoning
The C282Y allele is much more common in north-western Europe than in southern or eastern Europe (see Fig. 4.1). If database A contains mostly DNA from people of southern European origin while database C contains DNA from a more mixed population and database B contains DNA from a population with strong north-western European ancestry, then the three databases will record very different frequencies of the C282Y allele even though the same allele is being measured. Similarly, a database with very few entries (a small database) is more easily skewed by individual samples than a large one.
Key Takeaways
- A database only reflects the people whose DNA has been entered into it; differences in the sample explain differences in the recorded frequency of an allele.
- Allele frequencies in human populations vary geographically, so the country / ethnicity of the sampled people strongly affects the percentage recorded.
Common Mistakes
- Suggesting that the databases 'use different methods' — the question describes them as the same kind of database (all recording percentage of C282Y carriers), so the difference is most likely in the sample, not the method.
- Being too vague: 'different people' is not credit-worthy; 'different ethnicities' or 'different regions' is.
Things to Be Careful About
- One mark is available for one valid reason. State the reason specifically.
In one population consisting of 2501 people, there were 9 people who were homozygous recessive for the HFE gene.
Use equation 1 and equation 2 of the Hardy–Weinberg principle to calculate the number of people in the population who are heterozygous for the HFE gene.
equation 1:
equation 2:
key to symbols:
= frequency of the dominant allele
= frequency of the recessive allele
= frequency of homozygous dominant genotype
= frequency of heterozygous genotype
= frequency of homozygous recessive genotype
number of people who are heterozygous for the HFE gene = ______
Working
Total population = 2501; number of homozygous recessive individuals (hh) = 9.
Number of heterozygotes = 0.1128 × 2501 = 282.1
Answer
Number of people heterozygous for the HFE gene = 282
282
Background Concept
The Hardy–Weinberg principle describes the relationship between allele frequencies and genotype frequencies in a population that is not evolving. If p is the frequency of the dominant allele and q the frequency of the recessive allele, then:
- p + q = 1 (allele frequencies must sum to 1)
- p² + 2pq + q² = 1 (genotype frequencies must sum to 1)
The principle can be used in reverse: if the frequency of one genotype is known from a population sample, the allele frequencies can be calculated, and from them the frequencies of the other two genotypes. The number of individuals with each genotype is then frequency × population size. The principle assumes a large population, random mating, no mutation, no migration and no selection — assumptions that are approximations for real populations but work well for many purposes.
Understanding the Question
The candidate is told that in a population of 2501 people, 9 are homozygous recessive (hh) for HFE. They must use equations 1 and 2 of the Hardy–Weinberg principle to find the number of heterozygotes. The two equations are given, along with the key to the symbols. Two marks are available: one for arriving at the correct 2pq, and one for the correct final number of heterozygotes. The mark scheme also allows an error-carried-forward (ecf) mark for correctly multiplying an incorrect 2pq by 2501.
Approach
- Calculate q² = 9 / 2501.
- Take the square root to get q.
- Use p = 1 − q to get p.
- Calculate 2pq.
- Multiply 2pq by the population size to obtain the number of heterozygotes.
Step-by-Step Reasoning
Step 1: q² from the homozygous recessive count
The 9 hh individuals represent the q² genotype. With a population of 2501:
Step 2: q by taking the square root
(That is, about 6% of alleles in the population are the mutant allele.)
Step 3: p from p + q = 1
Step 4: 2pq
So about 11.28% of the population are heterozygotes.
Step 5: Convert frequency to number of people
Rounded to the nearest whole person, this is 282 heterozygotes. (It is acceptable to give 282.1 or 282; the mark scheme answer is 282.)
The two marks are awarded for the correct value of 2pq and the correct final number of heterozygotes; an error-carried-forward mark allows a candidate who makes an arithmetic slip earlier to still pick up credit for correctly scaling their 2pq by 2501.
Key Takeaways
- Hardy–Weinberg lets a single known genotype frequency be used to derive all the others in an ideal population.
- The trick is to start from the homozygous recessive class (q²), square-root to get q, then derive p and 2pq.
- Always multiply the final frequency by the population size to convert it back into a number of individuals.
Common Mistakes
- Forgetting to take the square root: writing 2pq = 2 × (1 − 9/2501) × (9/2501) is wrong because the recessive allele frequency is q, not q².
- Rounding errors: if q is rounded too early, 2pq can drift by several percent. Keep three or four significant figures at each step.
- Forgetting to multiply by the population size — the question asks for a number of people, not a frequency.
- Using the wrong value as q²: it must be the number of homozygous recessive individuals divided by the total, not just the number itself.
Things to Be Careful About
- Show full working — both marks can be earned from a clearly laid-out calculation even if the final answer is given to one decimal place.
- The mark scheme allows 1 mark for the correct number of heterozygotes when calculated from an incorrect 2pq (ecf), so even if the square root is miscalculated, partial credit is possible for the final scaling step.
Fig. 5.1 shows a photomicrograph of a single plant cell in a stage of meiosis.
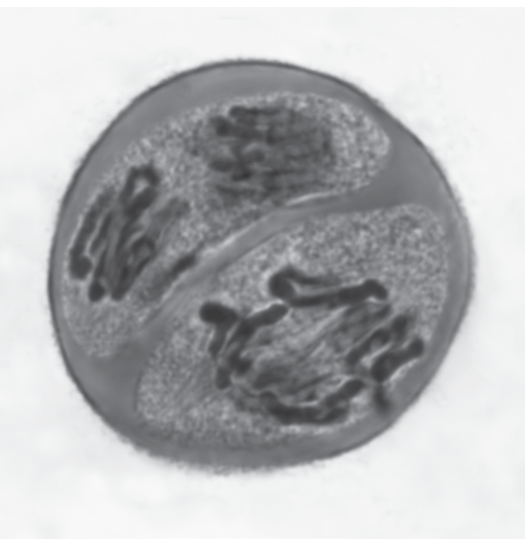
Describe the stage of meiosis shown in Fig. 5.1.
Answer
- This is meiosis II / the second meiotic division.
- Two cells are visible, each containing two groups of chromosomes.
- The stage is anaphase.
- In each daughter cell, sister chromatids / daughter chromosomes are being pulled to opposite poles (two groups of chromosomes per daughter cell).
- Centromeres / kinetochores are attached to spindle fibres / microtubules.
- The spindle fibres / microtubules shorten / contract.
- This pulls the (sister) chromatids / daughter chromosomes to opposite poles.
- The centromeres lead, with the chromosome arms trailing behind.
- There is no nuclear envelope visible.
Anaphase of meiosis II — two cells, each with two groups of sister chromatids being pulled to opposite poles by shortening spindle fibres attached at the centromeres, with no nuclear envelope present.
Background Concept
Meiosis is a reduction division that produces four haploid cells from one diploid cell. It consists of two divisions:
- Meiosis I (reductional division): Homologous chromosome pairs are separated. Key events include pairing of homologues, crossing over (prophase I), alignment of bivalents at the equator (metaphase I), separation of homologues to opposite poles (anaphase I), and cytokinesis to give two haploid cells.
- Meiosis II (equational division): Resembles mitosis. The sister chromatids of each chromosome are separated. In prophase II chromosomes condense, in metaphase II they line up on the equator, in anaphase II the centromeres split and sister chromatids are pulled to opposite poles, and telophase II/cytokinesis produces four haploid cells.
In plant cells, cytokinesis occurs by formation of a cell plate (a new cell wall and membrane laid down across the middle of the cell) rather than by cleavage as in animal cells.
Understanding the Question
The question shows Fig. 5.1, a photomicrograph of a single plant cell in meiosis. The command word is "describe", so you should give a clear account of what is visible and what is happening biologically. The mark scheme awards 5 marks from a list of 9 creditable points, so any five of the listed points will earn full marks.
Key observations from the image:
- A cell plate clearly divides the cell diagonally into two cells.
- Each daughter cell contains two groups of darkly stained, condensed chromosomes at opposite ends.
- Thin lines (spindle fibres) extend from the chromosomes towards the poles.
- There is no nuclear envelope visible around the chromosome groups.
Approach
- Identify the division: Because there are already two cells (cytokinesis has occurred) but each still contains a full set of chromosomes that are being separated, this must be meiosis II (in meiosis I, you would see whole chromosomes — each with two chromatids — separating, not sister chromatids separating).
- Identify the stage: Two groups of chromosomes per cell, each group being pulled towards a pole = anaphase.
- Describe the dynamics: Spindle fibres shorten, centromeres lead, arms trail, nuclear envelope is absent.
Step-by-Step Reasoning
-
Meiosis II: The cell plate shows cytokinesis has already produced two daughter cells. This is characteristic of late telophase I or any stage of meiosis II. Since chromosomes are still moving and being separated into new groups, this is during meiosis II, not telophase I. Award mark 1.
-
Two cells / four groups of chromosomes: The cell plate produces two cells, and in each cell the chromosomes form two clusters. So in total there are four groups — but the key point is two cells, each with two groups. Award mark 2.
-
Anaphase: The two groups of chromosomes per cell are at or moving towards opposite poles. This is the defining feature of anaphase. Award mark 3.
-
Two groups per daughter cell: Reinforces the anaphase identification. Award mark 4.
-
Centromeres/kinetochores attached to spindle fibres: Spindle microtubules attach at the kinetochore (a protein structure on the centromere). Award mark 5.
-
Spindle fibres shorten / contract: The shortening of kinetochore microtubules (depolymerisation at the kinetochore end) generates the pulling force. Award mark 6.
-
Pulls chromatids to opposite poles: Once the centromeres split (in anaphase II), each sister chromatid becomes an independent daughter chromosome and is pulled to its respective pole. Award mark 7.
-
Centromeres lead, arms trail: The geometry of chromosome movement — the centromere is pulled poleward by shortening microtubules while the chromosome arms drag behind. Award mark 8.
-
No nuclear envelope: During anaphase the nuclear envelope has broken down (it disassembled in prometaphase) and has not yet reformed. Award mark 9.
Key Takeaways
- A cell plate in a plant photomicrograph indicates plant cytokinesis — useful for recognising plant cells and the division of cytoplasm.
- Anaphase II is identified by: two cells (cytokinesis already underway), sister chromatids being pulled apart to opposite poles in each cell, no nuclear envelope.
- The distinction between meiosis I anaphase and meiosis II anaphase is critical: in I, whole chromosomes (still consisting of two chromatids joined at a centromere) separate; in II, sister chromatids separate.
- Always describe the mechanism of chromosome movement (spindle fibres shorten, attached at centromeres, centromeres lead) — this earns biology marks rather than just naming the stage.
Common Mistakes
- Stating "telophase II" instead of anaphase II. Although a cell plate is present (suggesting telophase), the chromosomes are clearly in two separate groups moving to poles, which is anaphase. The mark scheme specifically credits "anaphase".
- Stating "mitosis" or "meiosis I". The presence of two cells each with separating sister chromatids indicates meiosis II, not mitosis (no cell plate with separated chromatids within each cell) or meiosis I (no homologous pair separation visible).
- Vague descriptions like "the chromosomes are moving". The mark scheme credits the mechanism (spindle fibres shorten, centromeres attached, chromatids pulled to opposite poles), not just the observation.
- Saying "the chromosomes are splitting". In anaphase II, the centromeres have already split; sister chromatids are being separated. The split itself is not the visible process — the movement is.
- Forgetting to mention meiosis II. The mark scheme awards a separate mark for identifying it as meiosis II rather than just "anaphase".
Things to Be Careful About
- Cell plate vs cell wall: The cell plate is the developing new wall/membrane forming across the cell during plant cytokinesis. Do not confuse it with the pre-existing cell wall of the parent cell.
- Chromatid vs chromosome terminology: Before centromere split = chromosome (with two chromatids). After centromere split (in anaphase II) = each former chromatid is now an independent daughter chromosome. The mark scheme allows "(sister) chromatids" OR "daughter chromosomes" — either is acceptable.
- Counting groups: Do not be thrown off by the apparent "four groups of chromosomes" in the whole figure. The biologically meaningful description is "two cells, each with two groups" — this distinguishes meiosis II anaphase from any other stage.
- Poles: In a plant cell, "poles" refers to the two ends of the spindle apparatus, not to a physical structure — the centrosomes/asters typical of animal cells are absent in higher plants.
Fig. 6.1 outlines part of the control mechanism that regulates blood glucose concentration.
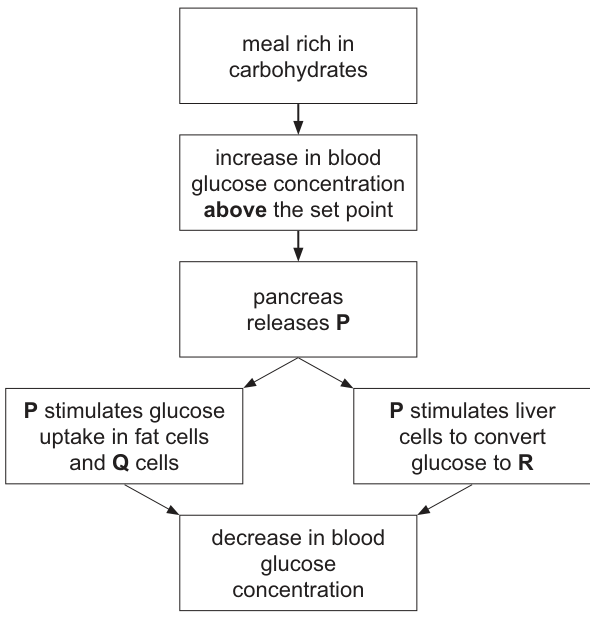
Answer
P = insulin
Q = muscle / liver (cells)
R = glycogen
P = insulin; Q = muscle / liver cells; R = glycogen
Background Concept
Blood glucose concentration is kept within narrow limits (≈ 4–6 mmol dm⁻³) by the antagonistic hormones insulin and glucagon, both secreted by the islets of Langerhans in the pancreas. Insulin is released by β-cells when blood glucose rises above the set point; it is the only blood-glucose-lowering hormone. It acts on body cells to increase glucose uptake and on the liver to store the excess as glycogen (glycogenesis).
Understanding the Question
Fig. 6.1 traces what happens after a carbohydrate-rich meal: blood glucose rises above the set point, the pancreas releases a hormone P, P has two effects — increasing glucose uptake by certain cells and promoting conversion of glucose to a storage product in liver cells — and blood glucose falls back. You must name the hormone P, the type of cell Q, and the storage product R.
Approach
Read each box carefully and match it to the role of insulin:
- Released by the pancreas in response to high blood glucose → insulin.
- Stimulates glucose uptake in fat cells AND another cell type → insulin increases glucose uptake in muscle cells (and, indirectly, adipocytes); in the liver it mainly promotes glycogen synthesis, so the missing Q cell type is the muscle cell (liver is mentioned separately in the next branch).
- Liver cells convert glucose to a storage polysaccharide → glycogen.
Step-by-Step Reasoning
- The pancreas releases P when blood glucose rises. Of the two pancreatic hormones, insulin is the one released in response to high blood glucose, so P = insulin.
- The diagram states that P stimulates glucose uptake in fat cells and Q cells. Insulin increases glucose uptake from the blood into muscle cells (and adipose tissue); the partner of fat cells given here is muscle cells (mark scheme also accepts liver cells here).
- The diagram states that P stimulates liver cells to convert glucose to R. Insulin promotes glycogenesis in hepatocytes, so R = glycogen.
Key Takeaways
- Insulin = the only blood-glucose-lowering hormone; secreted by β-cells.
- Insulin's main targets: muscle, adipose tissue (↑ glucose uptake) and liver (↑ glycogenesis, ↓ gluconeogenesis).
- Glycogen is the body's short-term glucose store, predominantly in liver and skeletal muscle.
Common Mistakes
- Writing "P = glucagon" — glucagon is the raising hormone; the diagram shows the decrease of blood glucose.
- Naming R as glucose, fat or starch — only glycogen is the human storage polysaccharide made from glucose in the liver.
- Putting "liver" for Q — the mark scheme accepts muscle or liver, but the next branch already names the liver, so muscle is the cleaner answer.
Things to Be Careful About
Q must be a CELL TYPE (muscle cells / liver cells), not an organ or a tissue. Spelling "glycogen" correctly is required — "glucagon" is the antagonist and will not earn the mark.
Answer
Negative feedback
Negative feedback
Background Concept
Homeostasis maintains the internal environment around a set point. The two broad types of control are:
- Negative feedback — the response reverses the initial change, restoring the variable towards its set point (e.g. blood glucose, temperature, CO₂).
- Positive feedback — the response amplifies the initial change (e.g. oxytocin in childbirth, action-potential depolarisation).
Understanding the Question
In Fig. 6.1, a rise in blood glucose triggers a response (insulin release) that lowers blood glucose — i.e. the response opposes the stimulus. This is the textbook definition of one specific kind of control loop, and you must name it.
Approach
Identify the direction of the response relative to the stimulus: stimulus = ↑ glucose; response = ↓ glucose. Because the response opposes (negates) the stimulus, the answer is negative feedback.
Step-by-Step Reasoning
- The set point is the target value (≈ 5 mmol dm⁻³ glucose).
- The stimulus (above set point) is detected by pancreatic β-cells.
- The effector response (insulin) reduces blood glucose back towards the set point.
- The correction is in the opposite direction to the deviation → negative feedback.
Key Takeaways
- Nearly all homeostatic control in mammals is by negative feedback.
- The hallmark feature is that the effector response opposes the original stimulus.
Common Mistakes
- Writing "positive feedback" because the system is "active" — the question asks about the type of control, and a stimulus–response that reverses itself is negative.
- Vague answers such as "homeostasis" or "self-regulation" — the mark requires the exact term negative feedback.
Things to Be Careful About
Don't write "negative feedback loop" unless the mark scheme credits it; "negative feedback" alone is sufficient.
When the blood glucose concentration decreases below the set point, a hormone is released from the pancreas.
Describe how the release of this hormone leads to the blood glucose concentration returning to the set point.
Answer
- Glucagon is released from α-cells of the pancreas.
- Glucagon binds to a receptor on the cell surface membrane of liver cells.
- This activates a G-protein in the membrane.
- The G-protein activates adenyl(yl) cyclase.
- Adenyl cyclase converts ATP into cyclic AMP (cAMP).
- cAMP acts as a second messenger inside the liver cell.
- cAMP triggers an enzyme cascade.
- (Cascade) enzymes are activated by phosphorylation.
- This amplifies the signal so a small hormonal stimulus produces a large response.
- The cascade activates enzymes that break down glycogen into glucose (glycogenolysis).
- Glucose is released from the liver cell into the blood, raising blood glucose back to the set point.
- Amino acids / glycerol / lactate can also be converted into glucose (gluconeogenesis), further raising blood glucose.
Glucagon binds to liver-cell receptors → activates G-protein → activates adenyl cyclase → converts ATP to cAMP (second messenger) → enzyme cascade with amplification → glycogenolysis (and gluconeogenesis) → glucose released into the blood, restoring the set point.
Background Concept
Glucagon is a peptide hormone secreted by the α-cells of the islets of Langerhans when blood glucose falls below the set point. It is the main blood-glucose-raising hormone and acts almost exclusively on the liver. Like many peptide hormones, glucagon does not enter its target cell; it binds a cell-surface receptor and acts through a second-messenger cascade that amplifies the signal.
The standard pathway is:
receptor → G-protein → adenyl cyclase → cAMP (second messenger) → protein kinase A → phosphorylates downstream enzymes → activates glycogen phosphorylase (and inactivates glycogen synthase) → glycogenolysis → glucose released into blood.
Understanding the Question
Part (b) is a 7-mark "describe" question that asks you to explain how the release of the hormone (glucagon) returns blood glucose to the set point. The mark scheme lists twelve possible creditable points, of which you need any seven. The question is testing both your knowledge of the molecular signal-transduction cascade AND your ability to link it to the physiological outcome.
Approach
Plan your answer in three blocks, in the order that matches the cascade:
- Hormone identity and receptor binding — name glucagon and state where it binds.
- The cAMP cascade inside the cell — receptor → G-protein → adenyl cyclase → cAMP → enzyme cascade → amplification.
- The cellular and physiological response — activation of glycogen phosphorylase, breakdown of glycogen to glucose, release of glucose into the blood; mention gluconeogenesis if you can.
Step-by-Step Reasoning
- Hormone: blood glucose falls below the set point → α-cells of the pancreas secrete glucagon (mark point 1).
- Receptor binding: glucagon is a peptide hormone and cannot cross the plasma membrane, so it binds to a receptor on the cell surface membrane of hepatocytes (mark point 2).
- G-protein activation: the occupied receptor activates an intracellular G-protein by promoting GTP binding (mark point 3).
- Adenyl cyclase: the activated G-protein stimulates adenyl(yl) cyclase, an enzyme that converts ATP into cyclic AMP (mark point 4).
- Second messenger: cAMP is the second messenger, relaying the signal from the membrane to the interior of the cell (marks 5 and 6 — often combined).
- Cascade and phosphorylation: cAMP activates protein kinase A, which initiates an enzyme cascade in which successive enzymes are activated by phosphorylation (marks 7 and 8).
- Amplification: because each enzyme in the cascade activates many copies of the next, the original hormonal signal is greatly amplified, allowing a small glucagon stimulus to mobilise a large amount of glucose (mark point 9).
- Glycogenolysis: the cascade activates glycogen phosphorylase (and inhibits glycogen synthase); glycogen is broken down into glucose (mark point 10).
- Glucose release: glucose leaves the hepatocyte and enters the blood, raising the blood glucose concentration back towards the set point (mark point 11).
- Optional / for full marks: the cascade also promotes gluconeogenesis — the synthesis of new glucose from non-carbohydrate precursors such as amino acids, glycerol and lactate (mark point 12).
Key Takeaways
- Glucagon is the antagonistic partner of insulin and is secreted in response to low blood glucose.
- Peptide hormones use cell-surface receptors and second messengers — they never enter the cell.
- The cAMP cascade is the classic example of signal amplification, a recurring CIE theme (also seen with ADH).
- Glycogenolysis in the liver is the body's fastest way to raise blood glucose.
Common Mistakes
- Calling the hormone adrenaline — the question specifically says "released from the pancreas"; adrenaline from the adrenal medulla is wrong here.
- Stating that glucagon enters the cell — it cannot; it acts via a membrane receptor.
- Writing "second messenger" without naming cAMP, or vice versa — the mark scheme lists both as separate creditable points.
- Saying glycogen is converted directly to glucose without naming glycogenolysis or an enzyme (e.g. glycogen phosphorylase).
- Confusing gluconeogenesis (making new glucose) with glycogenolysis (breaking down glycogen).
Things to Be Careful About
- "Adenyl cyclase" and "adenylate cyclase" are both accepted; "ATP cyclase" or "kinase" is not.
- "cAMP" must be written in lower-case c, capital AMP — not "CAMP" or "cyclic amp".
- The mark scheme requires seven from twelve; you should aim for the full pathway plus the physiological outcome so you are not reliant on partial recall.
The Sumatran tiger, Panthera tigris sumatrae, is classified as critically endangered on the International Union for Conservation of Nature (IUCN) Red List of Threatened Species™.
Fig. 7.1 shows a Sumatran tiger.
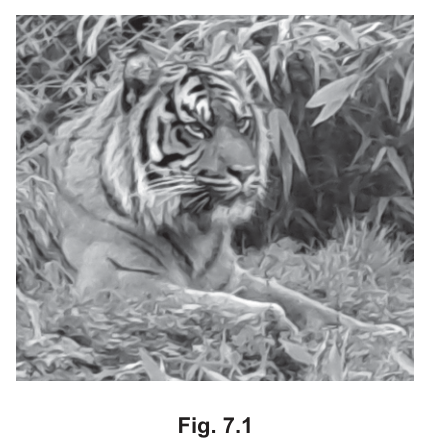
Fig. 7.2 shows the number of wild Sumatran tigers in the world between 1970 and 2020.
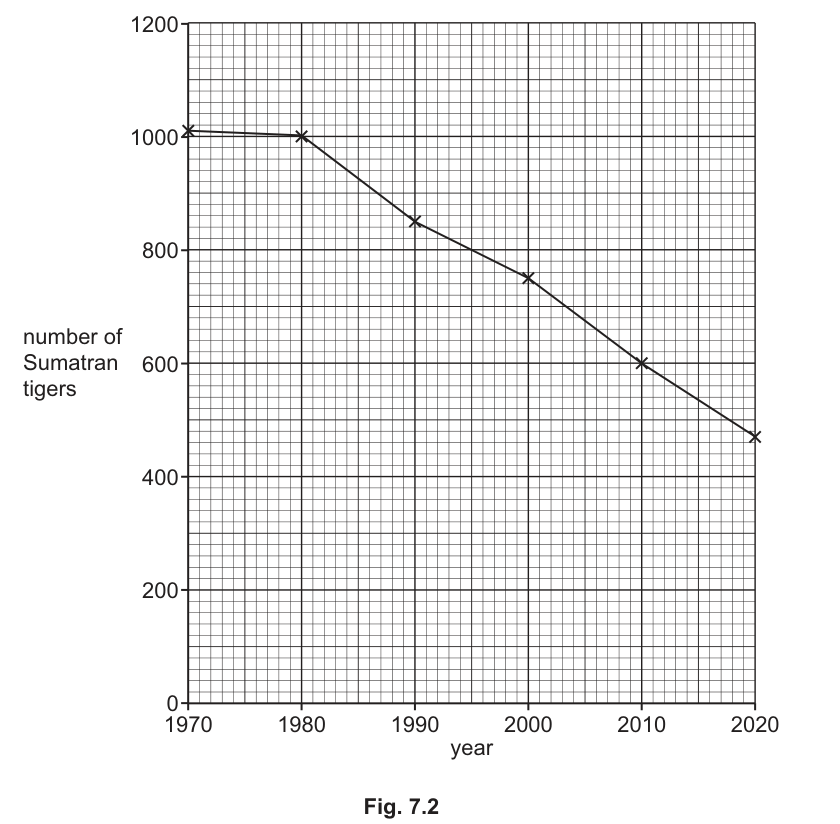
Calculate the mean rate of decrease in the Sumatran tiger population between 1970 and 2020.
mean rate of decrease = ______
Working
Read from Fig. 7.2:
- 1970 population = 1010
- 2020 population = 470
- Time interval = 2020 − 1970 = 50 years
Answer
10.8 year⁻¹
10.8 year⁻¹
Background Concept
The Sumatran tiger (Panthera tigris sumatrae) is a subspecies of tiger native to the Indonesian island of Sumatra and is listed as Critically Endangered on the IUCN Red List. Population sizes of endangered species are routinely monitored, and changes in size over time are summarised as a mean rate of change:
A negative result indicates a decrease. The mean rate does not reveal whether the decrease has been steady or has accelerated/decelerated — that requires looking at the shape of the graph — but it gives a useful single number to summarise a long-term trend.
Understanding the Question
Fig. 7.2 plots the estimated number of wild Sumatran tigers at 10-year intervals from 1970 to 2020. We are told to find the mean rate of decrease between 1970 and 2020, in units of (tigers per year, ignoring the sign).
The command word is calculate, so we must show working and a numerical answer with units.
Approach
- Read the values at the two endpoints (1970 and 2020) as carefully as the grid allows.
- Take the difference (later minus earlier; the question asks for decrease, so subtract the smaller from the larger).
- Divide by the time interval (50 years).
- Quote the answer with the correct unit, .
Step-by-Step Reasoning
Step 1 — Read Fig. 7.2.
The plotted point in 1970 sits very close to the 1000 gridline, slightly above it. The mark scheme accepts a reading of 1010. The plotted point in 2020 lies just below the 500 line; the mark scheme accepts 470.
Step 2 — Compute the decrease.
Step 3 — Divide by the time interval.
Step 4 — Attach the unit.
The question specifies , giving a mean loss of 10.8 tigers per year over the 50-year window.
Key Takeaways
- A mean rate of change is always (change in y) ÷ (change in x).
- Always quote the unit the question specifies.
- For "decrease" questions the sign convention is up to you — CIE accepts the magnitude with , or a negative value; just be consistent.
Common Mistakes
- Dividing 50 ÷ 540 instead of 540 ÷ 50, giving 0.0926 year⁻¹.
- Using only one of the endpoint values (e.g. just reading off 2020 alone).
- Forgetting to include the unit (the unit is part of the mark).
- Using the wrong interval, e.g. 40 years between 1980 and 2020.
Things to Be Careful About
- Read both endpoints carefully — small reading errors here are amplified by the division.
- The mark scheme awards 1 mark for correct working even if the final value is wrong, so always show the substitution.
- Note that the answer is given to 3 significant figures; do not round prematurely.
There are a number of different ways to help conserve Sumatran tigers. For example, some zoos have captive breeding programmes.
Outline ways in which Sumatran tigers may be conserved, other than captive breeding programmes.
Answer
Any three from:
- Ban hunting / poaching / trade in tiger products
- Enforcement of laws with strict penalties for poachers and traffickers
- Establish national parks / protected reserves / habitat protection in Sumatra
- Fit tigers with tracking devices / collars and monitor populations
- Raise public awareness / education about the plight of the Sumatran tiger
- AVP e.g. veterinary care for injured wild tigers; CITES controls on international trade
Any three conservation methods from: ban hunting/poaching/trade; enforcement/strict penalties; national parks/protected reserves/habitat protection; tracking devices/monitoring; raise awareness/education; AVP (e.g. veterinary care).
Background Concept
Conservation of an endangered species is rarely achieved by a single measure; biologists combine in-situ actions (protecting animals and habitat where they naturally live) with ex-situ actions (managing populations outside the wild, such as in zoos). The question excludes captive breeding, so the marks must come from other measures — chiefly in-situ, but also legal, political and educational interventions.
Key categories of intervention for large, wide-ranging mammals like the Sumatran tiger are:
- Legal — bans on hunting, trade and poaching, with enforcement.
- Habitat-based — protected areas, national parks, corridors connecting fragmented forests.
- Monitoring — radio collars, camera traps, population surveys.
- Social — education and awareness to reduce demand for tiger parts and to gain local support for conservation.
- Other — veterinary intervention, CITES listings, anti-poaching patrols, eco-tourism revenue.
Understanding the Question
We are asked to outline (give a brief explanation of) three conservation measures for Sumatran tigers other than captive breeding. Each mark is for a distinct, sensible measure; vague statements such as "help the tigers" score nothing.
Approach
Work through the categories above and pick three measures, each phrased in a way that is concrete enough to earn a mark. Aim for variety — three habitat-based points, for example, would be weak.
Step-by-Step Reasoning
- Measure 1 — Ban hunting/poaching/trade. Tigers are killed for skins, bones and traditional medicines. A legal ban removes the supply side, and the mark is strengthened by mentioning enforcement / strict penalties, which actually makes the ban work.
- Measure 2 — National parks/protected reserves/habitat protection. Sumatran tigers live in lowland and montane forest. Without protecting the forest, the prey base (wild pig, deer) collapses and tigers are killed when they venture near villages. Protected areas plus habitat corridors are the main in-situ tool.
- Measure 3 — Tracking devices/monitoring. GPS collars or camera traps allow rangers to locate tigers, identify poaching hotspots, and estimate population sizes — essential for assessing whether the conservation measures are working.
- (Optional additional) — Education/awareness campaigns target the local and international demand for tiger products; veterinary care treats injured or snared wild tigers; CITES listings restrict international trade.
Key Takeaways
- Conservation is multi-pronged: legal, habitat, monitoring, social and veterinary.
- Ex-situ work (zoos, captive breeding, IVF) is only one part; in-situ measures are at least as important.
- An "outline" requires a brief description, not just a buzzword — "ban hunting" alone is enough but adding why it works improves the answer.
Common Mistakes
- Mentioning captive breeding or zoos — explicitly excluded.
- Writing vague statements such as "look after them" or "stop killing them".
- Repeating the same idea in different words (e.g. "ban hunting" then "stop poaching") — only one mark is awarded.
Things to Be Careful About
- Stay within the scope: Sumatran tigers, not generic wildlife conservation.
- Do not invent impractical ideas (e.g. "move all tigers to Antarctica").
- "Awareness" alone is weak; pair it with what the audience should do, or accept it as the mark scheme does.
Answer
Any four from:
- Maintain, gene pool / genetic diversity, so populations can adapt to environmental change (e.g. disease, climate change)
- Ecotourism provides income for local people and for further conservation work
- Ethical / moral reasons: animals have a right to exist and we should not cause their extinction
- Effect on ecosystems / food chains / food webs — loss of one species can destabilise others (e.g. as a top predator the tiger helps regulate prey populations)
- Aesthetic reasons — people enjoy seeing wildlife and wild places
- Research — wild species and their genes can be studied and may yield useful information (e.g. new medicines)
- Cultural significance — tigers feature in the folklore, art and identity of many cultures
- Pollination (although primarily relevant to plants, maintaining habitats supports pollinators too)
- AVP e.g. keystone species concept; indicator species; potential future resource
Any four reasons from: maintain gene pool/genetic diversity; ecotourism; ethical/moral; effect on ecosystems/food chains/webs; aesthetic; research; cultural significance; pollination; AVP (e.g. keystone species).
Background Concept
Biodiversity is the variety of living organisms in an ecosystem, biome or on Earth. The case for maintaining it rests on several independent lines of argument:
- Ecological — species interact in food webs; removing one can have cascading effects. Apex predators such as tigers are often keystone species whose loss reshapes the whole community.
- Genetic — genetic diversity is the raw material for adaptation and for evolution; small, inbred populations lose it rapidly.
- Economic — ecotourism, bioprospecting (novel pharmaceuticals from wild species) and ecosystem services all have monetary value.
- Ethical — many people argue that species have a right to exist and that humans have a duty not to drive them extinct.
- Cultural and aesthetic — wildlife features in art, folklore and identity; wild landscapes are valued for their beauty.
- Scientific — biodiversity is a library of biological information for research.
Understanding the Question
The question asks us to outline reasons for maintaining animal biodiversity. "Outline" means give the main features or points, briefly but clearly. The mark scheme accepts up to nine alternative points, of which any four earn the four available marks.
Approach
Aim for breadth — pick at least four reasons that come from different categories (ecological, ethical, economic, aesthetic, scientific). A list of four ecological points scores no extra marks beyond four, but mixing categories shows wider understanding.
Step-by-Step Reasoning
- Reason 1 — Gene pool/genetic diversity. A diverse gene pool contains alleles that may confer resistance to disease, drought or other stresses. Loss of genetic diversity reduces the population's ability to adapt and increases the risk of inbreeding depression.
- Reason 2 — Ecological role. Tigers are top predators; they suppress herbivore populations, which in turn affects vegetation. Their loss can cause a trophic cascade. This is the strongest ecological argument.
- Reason 3 — Ethical/moral. Many people believe species have an inherent right to exist, and that humans, as the most powerful species, have a special responsibility to prevent extinctions we cause.
- Reason 4 — Aesthetic. People enjoy seeing wildlife; charismatic species such as tigers generate support for conservation and inspire artists, filmmakers and writers.
- Reason 5 — Ecotourism. Tiger reserves in India and elsewhere attract visitors whose spending supports local economies and funds further conservation.
- Reason 6 — Research. Wild species are reservoirs of biological information and may yield pharmaceuticals or other useful compounds.
- Reason 7 — Cultural. The tiger is a national symbol of several Asian countries and features prominently in mythology and religion.
- Reason 8 — AVP — keystone species, indicator species, future resource, ecosystem services (e.g. pollination, although the question specifies animal biodiversity).
Key Takeaways
- Reasons for maintaining biodiversity fall into ecological, genetic, economic, ethical, aesthetic, scientific and cultural categories.
- The Sumatran tiger in particular illustrates several of these at once — apex predator, charismatic species, cultural icon, eco-tourist attraction.
- "Outline" requires a short justification, not just a heading.
Common Mistakes
- Giving only one reason expressed in different words (e.g. "important to ecosystems" then "important to food webs") — these are the same mark.
- Confusing plant biodiversity reasons (pollination, timber) with animal-specific ones.
- Writing generic statements such as "biodiversity is good" without specifying what for or why.
Things to Be Careful About
- The question specifies animal biodiversity, so pollination of crops is only relevant insofar as it depends on pollinating animals (mostly insects) or maintaining habitats that support them.
- Four marks require four distinct points; one developed point with multiple clauses still only scores once.
- "AVP" (any valid point) means there is no closed list — but it must be biologically credible.
Captive breeding programmes sometimes use IVF.
Table 7.1 shows some of the events that occur during an IVF procedure.
They are not listed in the correct order.
Table 7.1
| letter | event |
|---|---|
| A | sperm added to oocyte |
| B | embryo formed |
| C | female given hormones to stimulate ovulation |
| D | zygote placed in culture medium |
| E | embryo placed in uterus of female |
| F | zygote formed |
| G | oocyte harvested with a fine needle |
Complete Table 7.2 to show the correct order of the events.
One of the events has already been added in the correct position.
Table 7.2
| correct order | letter |
|---|---|
| 1 | |
| 2 | |
| 3 | |
| 4 | F |
| 5 | |
| 6 | |
| 7 |
Answer
| correct order | letter |
|---|---|
| 1 | C |
| 2 | G |
| 3 | A |
| 4 | F |
| 5 | D |
| 6 | B |
| 7 | E |
Stage meanings:
- C – female given hormones to stimulate ovulation
- G – oocyte harvested with a fine needle
- A – sperm added to oocyte (fertilisation)
- F – zygote formed (given)
- D – zygote placed in culture medium to develop
- B – embryo formed (after cleavage divisions)
- E – embryo placed in uterus of female (embryo transfer)
1 = C, 2 = G, 3 = A, 4 = F, 5 = D, 6 = B, 7 = E
Background Concept
In-vitro fertilisation (IVF) is an assisted-reproductive technology in which oocytes are fertilised outside the body. It was developed for human fertility treatment but is now widely used in conservation breeding programmes for endangered animals, including big cats such as the Sumatran tiger.
The standard IVF protocol proceeds in the following logical order:
- Hormonal stimulation of the female to mature multiple oocytes (using FSH and LH analogues).
- Oocyte (egg) collection from the ovaries, usually by ultrasound-guided follicular aspiration with a fine needle.
- Sperm collection from the male and co-incubation with the oocyte in a culture dish — the in vitro part of IVF.
- Fertilisation and formation of the zygote (single-celled fertilised egg).
- Culture of the zygote in a defined medium so it can undergo cleavage divisions.
- Embryo formation after several mitotic divisions (typically by day 3–5 the embryo has 8+ cells).
- Embryo transfer into a surrogate or the biological mother's uterus, where implantation can occur.
Understanding the Question
We are given seven IVF events labelled A–G in random order. Event F ("zygote formed") is already placed in position 4. We must slot the remaining six events into positions 1–3 (above F) and 5–7 (below F).
The mark scheme awards:
- 1 mark for getting C, G, A in the correct order (above F).
- 1 mark for placing C, G, A above F (i.e. fertilisation occurs after hormone stimulation and oocyte collection).
- 1 mark for getting D, B, E in the correct order (below F).
- 1 mark for placing D, B, E below F.
Approach
Split the seven events into the three that happen before fertilisation (C, G, A), the fixed step F, and the three that happen after fertilisation (D, B, E). Then put each group in biological order.
Step-by-Step Reasoning
Events above the zygote (must be C, G, A in this order):
- C first. Without stimulating the ovaries, very few (or no) mature oocytes would be available to harvest.
- G second. Only after the follicles have matured under hormone stimulation can the oocytes be harvested with a fine needle.
- A third. The harvested oocytes are then mixed with sperm in a culture dish — this is the moment of in vitro fertilisation.
- → F (zygote formed) is the immediate product of A.
Events below the zygote (must be D, B, E in this order):
- D first. The newly formed zygote is placed in a culture medium where it can divide.
- B second. After several mitotic divisions the single-celled zygote becomes a multicellular embryo.
- E last. The embryo is transferred into the uterus of a recipient female so it can implant and develop to term.
Final sequence: C → G → A → F → D → B → E.
Key Takeaways
- IVF has three broad phases: (1) gamete preparation, (2) fertilisation, (3) embryo culture and transfer.
- A zygote is the single-celled product of fertilisation; an embryo is multicellular and comes later — the distinction matters in the marking.
- Hormonal stimulation precedes oocyte harvest; embryo transfer is always last.
Common Mistakes
- Placing A (sperm added) before G (oocyte harvested) — there must be an oocyte for the sperm to be added to.
- Confusing zygote (F) with embryo (B). A zygote is one cell; an embryo is many cells.
- Placing E (embryo placed in uterus) before B (embryo formed) — by definition you cannot place an embryo before it exists.
- Placing D (zygote in culture medium) before F (zygote formed) — the zygote must exist before it can be cultured.
Things to Be Careful About
- The mark scheme allows intervening letters to be incorrect as long as the named letters are in the right order. So C–A–G (skipping G in the middle) above F still earns the order mark for CGA — but only if the relative C-before-G-before-A is maintained. Always check both the order and the position of each group.
- "Culture medium" is where the zygote develops into an embryo, not where fertilisation occurs.
In the link reaction, a two-carbon acetyl group is produced from pyruvate. The acetyl group is transferred to coenzyme A to form acetyl coenzyme A (acetyl-coA).
State the terms used to summarise the two chemical changes that occur in the link reaction to produce an acetyl group from pyruvate.
Answer
- Decarboxylation
- Dehydrogenation (oxidation)
Decarboxylation and dehydrogenation (oxidation).
Background Concept
The link reaction is the short transitional step that connects glycolysis (in the cytoplasm) to the Krebs cycle (in the matrix of the mitochondrion). During this step the three-carbon pyruvate, produced at the end of glycolysis, is converted into a two-carbon acetyl group that is then carried into the Krebs cycle by coenzyme A.
To turn pyruvate into an acetyl group, two chemical changes must happen to the pyruvate molecule:
- One carbon is removed as . Removing a carboxyl group (-COOH) as is called decarboxylation.
- Hydrogen atoms (2 H, i.e. 2 protons + 2 electrons) are removed from what remains of the pyruvate and accepted by the coenzyme NAD, forming reduced NAD (). Loss of hydrogen is called dehydrogenation, and because electrons leave with the hydrogen, this is also an oxidation.
The remaining two-carbon fragment (the acetyl group, ) is then attached to coenzyme A, producing acetyl-coA, which delivers the acetyl group to the Krebs cycle by combining with oxaloacetate to form citrate.
Understanding the Question
The question is a two-mark 'state' item. It is asking for the technical names given to the two chemical processes that occur during the link reaction when pyruvate is converted into an acetyl group. We are not asked to describe the chemistry in full, only to give the terms that summarise the changes.
Approach
Recall that the link reaction is summarised as:
There are two named changes to identify: the loss of and the loss of hydrogen (with reduction of NAD).
Step-by-Step Reasoning
- Pyruvate () is converted to an acetyl group (). A carbon atom is released as carbon dioxide. The technical term for the removal of a carboxyl group as is decarboxylation.
- Hydrogen atoms are removed from pyruvate and accepted by , producing reduced NAD. The technical term for the removal of hydrogen is dehydrogenation, which is also an oxidation (because electrons are lost). Mark schemes typically accept either term here.
Key Takeaways
- The link reaction involves both decarboxylation and dehydrogenation (oxidation).
- Decarboxylation refers to the loss of ; dehydrogenation refers to the loss of hydrogen (with reduction of a coenzyme).
- Both changes are needed to produce the two-carbon acetyl group from three-carbon pyruvate.
Common Mistakes
- Writing 'reduction' instead of 'dehydrogenation/oxidation' — pyruvate is oxidised, not reduced, because it loses hydrogen.
- Confusing the link reaction with glycolysis. Glycolysis occurs in the cytoplasm and does not involve decarboxylation; decarboxylation only happens at the link reaction and again during the Krebs cycle.
- Listing only one of the two terms when both are required for full marks.
Things to Be Careful About
- The mark scheme accepts either 'dehydrogenation' or 'oxidation' for the second mark, so either is acceptable. Many candidates choose 'oxidation' because they are more familiar with the term; 'dehydrogenation' is the more precise answer because the change is specifically a loss of hydrogen atoms.
- Do not describe the chemistry in detail — the question asks only for the two terms.
Acetyl-coA combines with oxaloacetate in the Krebs cycle to form citrate. This reaction is catalysed by the enzyme citrate synthase.
Acetyl-coA has a similar shape to succinyl-coA, one of the compounds made in a later part of the Krebs cycle.
An experiment was carried out to investigate the effect of increasing the concentration of acetyl-coA on the activity of citrate synthase. The experiment was repeated, this time adding a solution of succinyl-coA.
Fig. 8.1 shows the results of these experiments.
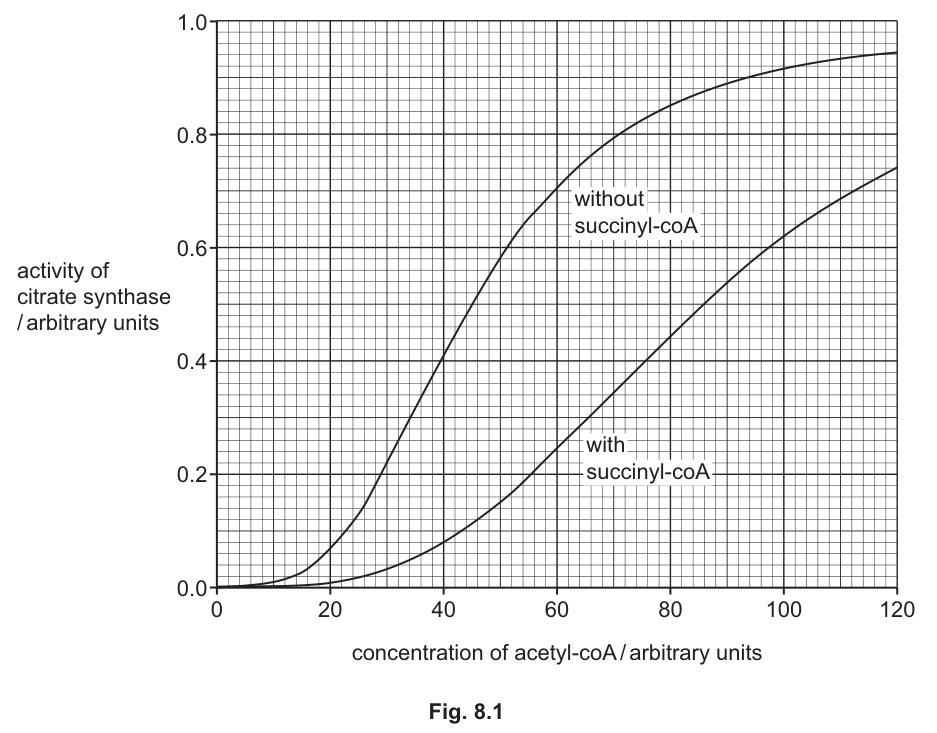
With reference to Fig. 8.1, explain how succinyl-coA could help to regulate the Krebs cycle.
Answer
- Succinyl-coA reduces the activity of citrate synthase. At any given concentration of acetyl-coA, the activity of citrate synthase is higher without succinyl-coA than with succinyl-coA.
- Comparative data quote: e.g. at 60 arbitrary units of acetyl-coA, activity is approximately 0.78 (without succinyl-coA) compared with 0.30 (with succinyl-coA).
- Succinyl-coA binds to the active site of citrate synthase because it has a similar shape to acetyl-coA.
- Succinyl-coA acts as a (competitive) inhibitor, competing with acetyl-coA for the active site.
- This slows down the Krebs cycle, preventing a build-up of citrate and other Krebs cycle intermediates.
Succinyl-coA acts as a competitive inhibitor of citrate synthase, lowering its activity and slowing the Krebs cycle to prevent build-up of intermediates.
Background Concept
The Krebs (citric acid) cycle is a closed loop of enzyme-catalysed reactions in the matrix of the mitochondrion. The first step is the condensation of acetyl-coA (a two-carbon unit derived from pyruvate via the link reaction) with the four-carbon oxaloacetate to form the six-carbon citrate. This reaction is catalysed by the enzyme citrate synthase and is the committed step of the cycle.
Many metabolic pathways are regulated by end-product (negative feedback) inhibition: when the concentration of a downstream product rises, it inhibits an enzyme earlier in the pathway. This prevents the wasteful over-production of intermediates when the cell does not need more ATP or reducing power. The inhibitor is usually a molecule whose shape resembles the natural substrate, so it can bind to the active site — a competitive inhibitor.
In this question, the natural substrate of citrate synthase is acetyl-coA. The question tells us that succinyl-coA, an intermediate produced later in the Krebs cycle, has a similar shape to acetyl-coA. This makes succinyl-coA an excellent candidate to act as a competitive inhibitor of citrate synthase, providing feedback control of the cycle.
Understanding the Question
The question gives us a graph (Fig. 8.1) of citrate synthase activity versus acetyl-coA concentration, with and without succinyl-coA added. The candidate must:
- read the graph and describe the difference between the two curves;
- give a comparative numerical quote;
- explain the mechanism of inhibition;
- explain why this helps to regulate the Krebs cycle as a whole.
The command word is 'explain', so each point must include the biological reasoning, not just a description of the graph.
Approach
- Compare the two curves and state the effect of succinyl-coA on enzyme activity.
- Quote at least one pair of values at the same acetyl-coA concentration to support the comparison.
- Explain the mechanism: succinyl-coA resembles acetyl-coA and therefore competes for the active site of citrate synthase (competitive inhibition).
- Connect this to the regulation of the whole pathway: slowing citrate synthase slows the Krebs cycle and prevents build-up of intermediates.
Step-by-Step Reasoning
Point 1 — Effect of succinyl-coA on activity:
The curve labelled 'without succinyl-coA' lies above the curve labelled 'with succinyl-coA' at every concentration of acetyl-coA. Therefore, succinyl-coA reduces the activity of citrate synthase.
Point 2 — Comparative data quote:
Read two values from the graph at the same acetyl-coA concentration. For example, at 60 arbitrary units of acetyl-coA:
- without succinyl-coA: activity ≈ 0.78 arbitrary units
- with succinyl-coA: activity ≈ 0.30 arbitrary units
This shows the activity is roughly two-and-a-half times higher without succinyl-coA at the same substrate concentration. Other pairs (e.g. at 40, 80, 100 arbitrary units) are equally acceptable provided they are read correctly from the graph.
Point 3 — Mechanism — binding to the active site:
Because succinyl-coA has a similar shape to acetyl-coA, it can fit into the active site of citrate synthase, blocking acetyl-coA from binding. The two molecules are competing for the same site.
Point 4 — Type of inhibition:
This is therefore competitive inhibition. The graph supports this interpretation: as acetyl-coA concentration increases, the activity with succinyl-coA also rises and approaches the same maximum as without succinyl-coA — a higher substrate concentration overcomes the inhibition.
Point 5 — Regulation of the Krebs cycle:
Citrate synthase catalyses the committed first step of the Krebs cycle. Inhibiting it slows the rate of the whole Krebs cycle. This prevents an unnecessary build-up of citrate (and the other intermediates downstream of it, including succinyl-coA itself) when their concentrations are already high.
Point 6 — Negative feedback:
The consequence is end-product (negative feedback) inhibition: when the concentration of a downstream intermediate (succinyl-coA) rises, it feeds back to inhibit the first enzyme of the pathway, reducing flux through the cycle until the intermediate is consumed.
Key Takeaways
- Citrate synthase catalyses the first committed step of the Krebs cycle (acetyl-coA + oxaloacetate → citrate).
- Molecules that resemble the natural substrate can act as competitive inhibitors at the active site.
- End-product inhibition by a downstream intermediate (here succinyl-coA) is a common mechanism for regulating metabolic pathways.
- Graphical evidence for competitive inhibition: increasing substrate concentration overcomes the inhibition (curves converge at high [S]).
Common Mistakes
- Stating that succinyl-coA is a 'non-competitive inhibitor'. The graph shows activity can be partly restored at high acetyl-coA concentrations, which is the hallmark of competitive, not non-competitive, inhibition.
- Saying that succinyl-coA 'binds to an allosteric site' rather than the active site. The question explicitly states that succinyl-coA has a similar shape to acetyl-coA, so it binds to the active site (competitive inhibition).
- Giving a description of the graph without quoting comparative data — the mark scheme explicitly requires a numerical comparison.
- Failing to link the inhibition of citrate synthase to the slowing of the whole Krebs cycle and to the prevention of intermediate build-up.
Things to Be Careful About
- Use precise wording: 'active site', 'competitive inhibitor', and 'Krebs cycle' are all key terms the mark scheme rewards.
- Quote figures with units and at the same x-value for both curves.
- Explain, do not just describe: the question asks how succinyl-coA helps to regulate the cycle, so the consequence (slowing the cycle, preventing build-up) must be made explicit.
The coenzyme NAD plays an important role in respiration.
Describe the role of NAD in the stages of aerobic respiration that occur in a mitochondrion.
Answer
- NAD is a hydrogen carrier; it becomes reduced when it accepts hydrogen (atoms) / protons and electrons.
- This occurs in the link reaction and in the Krebs cycle (in the matrix of the mitochondrion), where NAD is reduced to .
- Reduced NAD moves to the inner mitochondrial membrane / cristae.
- Reduced NAD releases its hydrogen (atoms) — protons and electrons — at the electron transport chain.
- The hydrogen (electrons) is used in oxidative phosphorylation to generate ATP via the electron transport chain and ATP synthase.
- NAD is oxidised and recycled to be reused in the link reaction and Krebs cycle.
NAD acts as a hydrogen carrier, becoming reduced in the link reaction and Krebs cycle, then transporting H atoms to the inner mitochondrial membrane where they are released for use in oxidative phosphorylation; NAD is then oxidised and recycled.
Background Concept
(nicotinamide adenine dinucleotide) is a coenzyme — a small, non-protein helper molecule that works with enzymes called dehydrogenases. Its job in aerobic respiration is to act as a hydrogen carrier:
When a substrate is oxidised (loses hydrogen) in a dehydrogenation step, the hydrogen (effectively 2 electrons + 1 proton, the second proton being released into solution) is accepted by , reducing it to . The reduced NAD then carries this 'reducing power' to the inner mitochondrial membrane, where the hydrogen is handed to the electron transport chain. The energy released as electrons pass along the chain is used to pump protons and drive ATP synthesis by ATP synthase (oxidative phosphorylation). The released is recycled back into the matrix.
In the mitochondrion, NAD is reduced in two stages:
- Link reaction — when pyruvate is converted to acetyl-coA, one molecule of NAD is reduced.
- Krebs cycle — three further molecules of NAD are reduced (plus one and one GTP/ATP, depending on the pathway) per turn of the cycle, per acetyl-coA oxidised.
Understanding the Question
The question asks for a description of the role of NAD 'in the stages of aerobic respiration that occur in a mitochondrion'. The relevant stages are therefore the link reaction, the Krebs cycle, and oxidative phosphorylation. (Glycolysis happens in the cytoplasm, so it is not in the mitochondrion and should not be discussed here, even though it does use NAD.)
The command word is 'describe', so the answer should outline what NAD does in each relevant stage and how it links them together.
Approach
- State that NAD is a hydrogen carrier / becomes reduced.
- Name the two mitochondrial stages where NAD is reduced (link reaction and Krebs cycle).
- Describe where reduced NAD goes (inner mitochondrial membrane / cristae).
- Describe what happens there: reduced NAD releases its hydrogen (electrons + protons).
- State the purpose of the released hydrogen: oxidative phosphorylation (ATP production via the electron transport chain / ATP synthase).
- Note that NAD is oxidised back to and recycled.
Step-by-Step Reasoning
Point 1 — Hydrogen carrier:
NAD exists in two forms. In its oxidised form () it accepts hydrogen; in its reduced form () it carries the hydrogen to a new location. The chemical equation is:
Point 2 — Where NAD is reduced in the mitochondrion:
- In the link reaction, pyruvate is oxidised to acetyl-coA; the hydrogen is accepted by NAD.
- In the Krebs cycle, several dehydrogenation steps (e.g. isocitrate → α-ketoglutarate, α-ketoglutarate → succinyl-coA, malate → oxaloacetate) reduce NAD.
These reactions all occur in the matrix of the mitochondrion.
Point 3 — Movement to the inner membrane:
The reduced NAD diffuses (or is shuttled) from the matrix to the inner mitochondrial membrane (the cristae), where the electron transport chain is embedded.
Point 4 — Release of hydrogen:
At the inner membrane, reduced NAD donates its hydrogen to the electron transport chain. The hydrogen separates into protons () and electrons (). The electrons are passed along carriers in the chain; the protons are pumped across the membrane to create a proton gradient.
Point 5 — Use in oxidative phosphorylation:
The energy released as electrons pass along the chain is used to drive the synthesis of ATP from ADP and via ATP synthase (chemiosmosis). This is oxidative phosphorylation, the major source of ATP in aerobic respiration.
Point 6 — Recycling:
Having released its hydrogen, NAD is back in its oxidised form () and is free to be reused by dehydrogenases in the link reaction and Krebs cycle. This recycling is essential because the cell has only a small pool of NAD.
Key Takeaways
- NAD is a coenzyme that acts as a hydrogen (and electron) carrier.
- In the mitochondrion it is reduced in the link reaction and the Krebs cycle, in the matrix.
- Reduced NAD carries hydrogen to the inner mitochondrial membrane (cristae) and releases it to the electron transport chain.
- The hydrogen (electrons) powers oxidative phosphorylation, the main source of ATP in aerobic respiration.
- NAD is then reoxidised and recycled — the cell's pool of NAD is small and must be turned over continuously.
Common Mistakes
- Including glycolysis in the answer. The question restricts the answer to stages that occur 'in a mitochondrion'. Glycolysis happens in the cytoplasm, so it should not be described here, even though it does use NAD.
- Writing that NAD 'produces ATP' directly. NAD does not produce ATP; it donates hydrogen whose energy is used in oxidative phosphorylation to make ATP.
- Forgetting to mention that NAD is recycled — many candidates describe reduction but not the all-important reoxidation step.
- Confusing NAD with NADP (used in photosynthesis) or with FAD (a related hydrogen carrier that works in a similar but distinct way).
- Saying NAD carries 'electrons only' or 'protons only' — the mark scheme requires hydrogen atoms (which include both protons and electrons).
Things to Be Careful About
- The mark scheme rewards the term 'hydrogen carrier' or 'reduced' for the first mark; either is acceptable.
- The question is worth 4 marks and requires a structured, point-by-point description, not a short sentence.
- Use precise anatomical terms: 'matrix', 'inner mitochondrial membrane', 'cristae', 'electron transport chain' and 'ATP synthase' are all key terms the mark scheme rewards.
- 'Oxidative phosphorylation' must be named explicitly, not just alluded to.
The chloroplasts of leaves of tobacco plants, Nicotiana sp., contain chlorophyll and chlorophyll .
Answer
- Chlorophyll b is an accessory pigment.
- It absorbs light at wavelengths (e.g. blue-green) that are not absorbed by chlorophyll a / the reaction centre pigment, so it extends the range of wavelengths that can drive photosynthesis.
- It transfers the absorbed energy to chlorophyll a in the reaction centre of the photosystem, increasing the efficiency of the light-dependent stage.
Accessory pigment that absorbs additional wavelengths of light and passes the energy to chlorophyll a in the reaction centre, extending the range of wavelengths usable in photosynthesis.
Background Concept
A chloroplast contains several pigments embedded in the thylakoid membranes. Chlorophyll a is the primary pigment (the reaction-centre pigment of photosystems I and II); it absorbs red and blue light most strongly and is the only pigment whose excited electrons are actually used in the light-dependent reactions. Chlorophyll b, carotenoids and xanthophylls are accessory pigments: they do not have reaction centres themselves but absorb light at wavelengths chlorophyll a absorbs poorly (chlorophyll b absorbs mainly blue (~450 nm) and red-orange (~640 nm) light, with a different profile from chlorophyll a).
When an accessory pigment absorbs a photon, the energy is not used to drive electron transport at that pigment. Instead, the energy is passed by resonance transfer from one pigment molecule to the next until it reaches a chlorophyll a molecule in the reaction centre, where charge separation occurs and an electron enters the electron transport chain. The net effect is that more of the incident light spectrum is captured and used for photophosphorylation.
Understanding the Question
Part (a) is a short-answer "describe the role" worth 2 marks. It asks specifically about chlorophyll b — not chlorophyll a, and not the light-dependent stage as a whole. The mark scheme accepts any two of five creditable points: that chlorophyll b is an accessory pigment, that it absorbs extra wavelengths, that it extends the range, that it passes energy to chlorophyll a / the reaction centre, and that it improves the efficiency of the light-dependent stage. Two well-chosen points will earn full marks.
Approach
State what type of pigment chlorophyll b is (accessory), then describe the consequence of being an accessory pigment: it captures wavelengths that chlorophyll a cannot, and passes the energy onwards. That covers the three most commonly credited points and is enough to secure the two marks.
Step-by-Step Reasoning
- Point 1 — "accessory pigment": this is the categorical statement the examiner looks for first, and it sets up everything else. Chlorophyll a is the primary/reaction-centre pigment; chlorophyll b is not.
- Point 2 — "absorbs light wavelengths not absorbed by chlorophyll a / the reaction centre / primary pigment": this is the function and is the second most commonly credited point. Wording matters — "absorbs more light" is too vague and is rejected; the marker wants the idea that it absorbs additional wavelengths.
- Point 3 — "passes energy to chlorophyll a / the reaction centre": this explains how the absorbed energy is used. The energy is transferred by resonance, not by an electron, and reaches a chlorophyll a molecule whose excited electron is then promoted into the electron transport chain.
- Implicit consequence: because (2) and (3) both apply, the wavelength range over which photosynthesis can occur is widened and the light-dependent stage runs more efficiently. This is point 3 of the mark scheme ("extends the range") and point 5 ("improves efficiency").
A combined answer such as "chlorophyll b is an accessory pigment that absorbs wavelengths not absorbed by chlorophyll a and passes the energy to chlorophyll a in the reaction centre" would earn both marks without listing every alternative.
Key Takeaways
- Chlorophyll a is the only pigment with a reaction centre; all other photosynthetic pigments (including chlorophyll b) are accessory.
- The biological role of accessory pigments is to broaden the wavelengths of light that can be used and to channel that energy to chlorophyll a.
- Wording "absorbs more light" is too vague on its own; the marker expects the idea of additional wavelengths.
Common Mistakes
- Saying "chlorophyll b absorbs light for photosynthesis" without stating that it is an accessory pigment — this loses the easy first mark.
- Confusing chlorophyll b with the reaction-centre pigment. Chlorophyll b never directly loses an electron to the electron transport chain.
- Writing "chlorophyll b helps chlorophyll a" or "chlorophyll b is needed for photosynthesis" — too vague, no mark.
- Saying it "absorbs green light" — this is the textbook oversimplification; chlorophyll b actually absorbs strongly in the blue and red-orange regions, and the plant pigment complex together reflects green.
Things to Be Careful About
- "Describe" is the command word, so the answer must say what chlorophyll b does — not just name it.
- The mark scheme accepts either "chlorophyll a" or "reaction centre" or "primary pigment" as the destination of the energy transfer. Any one is fine.
- Two clear points are enough; do not pad with weak points such as "it is green" or "it is found in chloroplasts" — these are not credited.
A mutant tobacco plant was found to contain more chlorophyll than normal tobacco plants.
An investigation was carried out to measure the rate of photosynthesis of normal and mutant tobacco plants at increasing light intensities. The rate of production of oxygen was used as a measure of the rate of photosynthesis.
Other variables were kept constant.
Fig. 9.1 shows the results of this investigation.
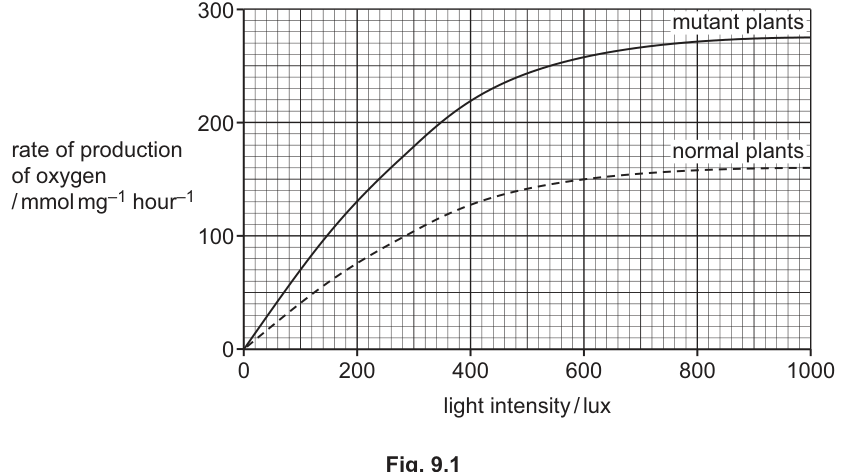
Answer
- In both normal and mutant plants the rate of oxygen production increases with light intensity and then levels off (reaches a plateau).
- The rate of oxygen production is higher in the mutant plants than in the normal plants at every light intensity above ~50 lux.
- At 1000 lux, mutant plants reach a plateau of approximately 280 mmol mg⁻¹ hour⁻¹, while normal plants plateau at approximately 165 mmol mg⁻¹ hour⁻¹ — the mutant rate is roughly 115 mmol mg⁻¹ hour⁻¹ higher (about 1.7× the normal rate).
Both rates rise then level off; the mutant rate is consistently higher than the normal rate (e.g. ~280 vs ~165 mmol mg⁻¹ hour⁻¹ at 1000 lux).
Background Concept
The rate of the light-dependent stage of photosynthesis depends on light intensity until some other factor (usually CO₂ concentration or temperature) becomes limiting. On a graph of photosynthetic rate against light intensity the curve therefore rises (light is limiting) and then flattens (light is saturating and another factor is limiting). The height of the plateau reflects the activity of the dark stage (Calvin cycle) and the capacity of the electron transport chain.
The rate of oxygen production is a direct measure of the rate of the light-dependent stage, because the O₂ released by photolysis of water at photosystem II is stoichiometric with the electrons entering the electron transport chain.
Understanding the Question
The stem describes an investigation in which normal and mutant tobacco plants (mutants have more chlorophyll b) had their rate of O₂ production measured across a range of light intensities, with other variables held constant. Part (b)(i) asks the candidate to describe what the graph shows — meaning the trend, the comparison between the two curves, and at least one numerical comparison taken from the figure. The mark scheme awards 1 mark for the shared shape (rise then plateau), 1 mark for the comparison (mutant > normal), and 1 mark for a paired data quote.
Approach
Read the axes first, then describe the shape common to both curves, then state the difference, then quote a paired value to support the difference. The "describe" command word requires trends, not explanations — explanations of why belong in (b)(ii).
Step-by-Step Reasoning
- Shared shape (1 mark): Both curves start at the origin (no light → no O₂), rise steeply at low light intensities, and then level off at higher light intensities. This is the classic light-saturation curve: at low light, light is the limiting factor, so the rate increases linearly; at higher intensities some other variable (CO₂, temperature) becomes limiting, and the rate plateaus.
- Comparison (1 mark): Throughout the range where light is non-zero, the mutant curve lies above the normal curve. This means the mutant has a higher rate of photosynthesis at any given light intensity. The mutant also plateaus at a higher absolute rate, so the difference is preserved (and slightly magnified) at saturating light.
- Comparative data quote (1 mark): The mark scheme requires a paired value at the same light intensity. Reading the graph at 1000 lux (the right-hand edge), the mutant curve plateaus at approximately 280 mmol mg⁻¹ hour⁻¹ and the normal curve at approximately 165 mmol mg⁻¹ hour⁻¹. Either the absolute difference (~115 mmol mg⁻¹ hour⁻¹) or a ratio (mutant ≈ 1.7× normal) is acceptable. A second example: at 400 lux, the mutant is approximately 200 mmol mg⁻¹ hour⁻¹ and the normal is approximately 110 mmol mg⁻¹ hour⁻¹.
The three points together — shape, comparison, data quote — earn all 3 marks.
Key Takeaways
- A "describe the graph" question always needs three ingredients: trend in each line, comparison between the lines, and a numerical quote.
- "Increases then levels off" identifies a light-saturation response — light is the limiting factor on the rising part, another variable on the plateau.
- The plateau height depends on the dark (light-independent) stage and the chloroplast's capacity, not directly on the amount of pigment — although more pigment can raise the curve on the rising part too.
Common Mistakes
- Describing only one of the two curves and ignoring the other.
- Saying "the rate increases" without mentioning the plateau — this loses the most easily earned mark.
- Offering an explanation (e.g. "because there is more chlorophyll b") in a "describe" question. The mark scheme wants observation, not causation here.
- Quoting a value without units, or quoting values that are not at the same light intensity (the comparison must be paired).
Things to Be Careful About
- Read both axes carefully: x is light intensity in lux; y is rate in mmol mg⁻¹ hour⁻¹. Units must appear in the data quote.
- The two curves are very close at the lowest light intensities, so the comparison "the mutant is always higher" is more accurate for light intensities above about 50 lux.
- Significant figures: two or three significant figures are appropriate when reading off a printed graph.
It was observed that the mutant tobacco plants had a faster growth rate than the normal tobacco plants.
Suggest explanations for this observation.
Answer
- The mutant plants contain more chlorophyll b, so they absorb more light energy (and a wider range of wavelengths).
- The light-dependent stage therefore proceeds faster, producing more ATP and more reduced NADP.
- More ATP and reduced NADP drive more turns of the Calvin cycle per unit time, producing more triose phosphate (TP).
- More TP means more hexose is formed, providing more substrate for:
- respiration, releasing more ATP to fuel growth;
- the synthesis of amino acids, proteins, lipids, cellulose and starch needed to build new cells and tissues.
- More raw material and more energy together support the faster growth rate observed in the mutant plants.
More chlorophyll b → absorbs more light → faster light-dependent stage → more ATP and reduced NADP → more TP from the Calvin cycle → more hexose for respiration and biosynthesis → more energy and biomass for growth.
Background Concept
The two stages of photosynthesis are linked by the products of the light-dependent stage:
- The light-dependent stage (on the thylakoid membranes) uses light energy to photolyse water (releasing O₂) and to generate ATP and reduced NADP.
- The light-independent stage / Calvin cycle (in the stroma) uses ATP and reduced NADP to reduce CO₂, first to triose phosphate (TP), then to hexose sugars and to RuBP (which is regenerated).
- The hexose produced is the raw material for almost every other organic molecule in the plant: through respiration it provides ATP; through biosynthetic pathways it is converted into amino acids, lipids, cellulose, starch and many other compounds.
Chlorophyll b, as an accessory pigment, broadens the wavelengths of light that can be captured. More chlorophyll b means more total light energy absorbed per unit time, which means a faster rate of the light-dependent stage, which means more ATP and reduced NADP are produced per unit time.
Understanding the Question
The stem has established that mutant tobacco plants have more chlorophyll b and grow faster than normal plants. Part (b)(ii) asks the candidate to suggest explanations for the faster growth. The mark scheme allows any four of eight creditable points, which together form a single logical chain from the extra pigment to the observed phenotype.
Approach
Build the answer as a stepwise causal chain. Each step is one mark, and a well-constructed chain will hit four or five marks almost automatically. Start with the pigment → light-absorption link (the question's premise), then move into the light-dependent stage, then into the Calvin cycle, then into the fates of the hexose produced.
Step-by-Step Reasoning
- Step 1 — "absorbs more light": The mutant has more chlorophyll b, an accessory pigment. More pigment molecules → more total light energy captured per unit time. This is the starting point of the chain.
- Step 2 — "faster rate of photosynthesis / light-dependent stage": The captured energy drives the light-dependent stage, so a higher rate of light capture gives a faster light-dependent stage. This is the visible result on Fig. 9.1 (mutant curve higher than normal curve).
- Step 3 — "more ATP and reduced NADP produced": Photophosphorylation and the reduction of NADP⁺ at photosystem I both depend on the light energy delivered to the reaction centres; more captured energy means more ATP and more reduced NADP per unit time. These two products are the bridge between the two stages.
- Step 4 — "more turns of the Calvin cycle": The Calvin cycle requires ATP (for the reduction of GP to TP) and reduced NADP (as the reducing agent); the rate of the cycle is therefore limited by the supply of these two molecules. More ATP and reduced NADP allow more CO₂ to be fixed per unit time.
- Step 5 — "more triose phosphate (TP) produced": TP is the immediate three-carbon product of the Calvin cycle. More CO₂ fixed per unit time means more TP produced per unit time.
- Step 6 — "more hexose for respiration": TP is the substrate for hexose synthesis (two TP → one hexose, e.g. glucose or fructose). More TP → more hexose. Some of this hexose enters glycolysis, the link reaction, the Krebs cycle and oxidative phosphorylation, releasing ATP that powers cell division and growth.
- Step 7 — "more energy for growth": ATP from respiration of the extra hexose fuels the active processes of growth — cell division, active loading of the phloem, synthesis of new macromolecules.
- Step 8 — "more synthesis of amino acids / proteins / lipids / cellulose / starch": Hexose is also a precursor for biosynthesis. Amino acids are made from intermediates of glycolysis and the Krebs cycle combined with nitrogen from the soil; cellulose and starch are polymers of glucose; lipids are built from acetyl-CoA. A larger hexose pool therefore supports faster synthesis of the structural and functional components of new cells and tissues.
Any four of these eight steps will earn full marks, but a complete chain (steps 1 → 3 → 4 → 5 → 7, for example) is the strongest answer and easiest to write under exam pressure.
Key Takeaways
- A "suggest" question with a multi-part mark scheme is usually best answered as a chain — every link is a mark.
- The two stages of photosynthesis are linked specifically by ATP and reduced NADP; these are the two molecules whose increased supply drives a faster Calvin cycle.
- Hexose produced in photosynthesis is not just an energy store; it is the carbon skeleton for almost every other class of biological molecule a plant makes.
- Linking a phenotype (faster growth) back to a pigment (more chlorophyll b) is a typical CIE question structure: the chain is photosynthesis → biosynthesis → growth.
Common Mistakes
- Stopping at "more photosynthesis happens, so the plant grows faster" — this loses most of the marks because it skips the intermediate biochemistry.
- Saying "more glucose is made so the plant has more energy" without distinguishing between glucose as a respiratory substrate (which yields ATP) and glucose as a carbon skeleton (which yields biomass). CIE marks are awarded for both ideas, separately.
- Forgetting to mention ATP and reduced NADP by name — these are the precise terms the mark scheme credits.
- Confusing triose phosphate (TP, a 3-carbon sugar) with hexose (a 6-carbon sugar) or with RuBP. The chain should be GP → TP → hexose → other molecules.
- Saying "the mutant grows faster because it has more chlorophyll" without explaining the role of the extra chlorophyll b in extending the wavelength range or capturing more light.
Things to Be Careful About
- "Suggest" is a softer command word than "explain", but the mark scheme here still requires precise biological terms (ATP, reduced NADP, TP, hexose). Vague answers such as "more energy is produced" do not earn the same marks.
- The maximum mark is 4 even though 8 points are listed — the mark scheme says "any four from". A candidate who lists all 8 should still cap at 4, and an examiner will simply pick the strongest 4.
- Do not claim chlorophyll b is itself used in biosynthesis; it is a pigment, not a substrate.
- "Growth" requires both energy (ATP) and materials (biosynthesis); an answer that mentions only one of the two is incomplete.
Fig. 10.1 shows chemoreceptor cells in a taste bud. Two of the chemoreceptor cells have formed synapses with sensory neurone dendrites.
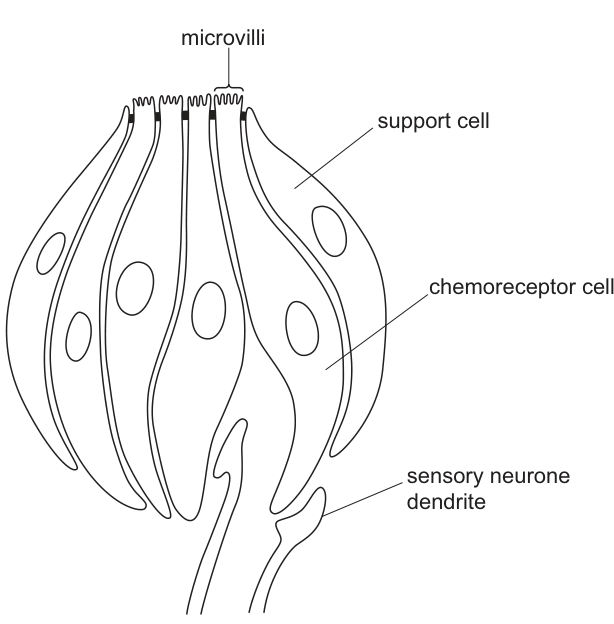
Describe how the contact of sodium ions with the microvilli of the chemoreceptor cell can lead to the release of a neurotransmitter by the cell.
Answer
- ions enter the chemoreceptor cell through (ligand-gated) channels in the microvillar membrane, by facilitated diffusion
- This depolarises the cell surface membrane, generating a receptor potential
- (If threshold is reached,) voltage-gated channels open and ions enter the cell
- Vesicles containing neurotransmitter move to, fuse with the cell surface membrane, and release the neurotransmitter by exocytosis into the synaptic cleft
Neurotransmitter is released by exocytosis following Na+ entry (via channels), depolarisation and Ca2+ entry into the chemoreceptor cell.
Background Concept
Taste buds are the sensory organs for taste. Each taste bud contains several chemoreceptor cells (the actual sensory cells) and support cells that provide structural and metabolic support. The chemoreceptor cells have microvilli at their apical surface, projecting into a taste pore, which greatly increases the surface area available for contact with chemicals dissolved in saliva.
Chemoreceptor cells are non-neuronal receptor cells. They transduce a chemical stimulus into an electrical signal and pass this signal to a sensory neurone via a synapse at the base of the cell. This is the general pattern for sensory transduction by non-neuronal receptors (e.g. taste, smell, some touch/pain receptors).
The mechanism of signal transmission in the chemoreceptor cell follows a standard sequence:
- Stimulus → ion entry through channels (often ligand-gated)
- Depolarisation of the cell surface membrane
- Generation of a graded receptor potential
- If threshold is reached, voltage-gated channels open
- entry triggers vesicle fusion with the membrane
- Neurotransmitter is released by exocytosis into the synaptic cleft
- Neurotransmitter binds to receptors on the post-synaptic sensory neurone
This is essentially the same as synaptic transmission in reverse: depolarisation → entry → exocytosis.
Understanding the Question
The question (with Fig. 10.1) shows a taste bud with chemoreceptor cells, two of which form synapses with sensory neurone dendrites at the base. The question asks how the contact of ions with the microvilli can lead to the release of a neurotransmitter. The command word is "describe" (4 marks), so we need a clear, sequential account of the events. The mark scheme offers 7 possible points; we need 4 of them.
The scenario is: ions in the saliva contact the microvilli at the top of the chemoreceptor cell. We need to trace events from this initial contact to the release of neurotransmitter at the synapse with the sensory neurone at the base of the cell.
Approach
The answer should follow the chain of cellular events:
- entry (through channels / by facilitated diffusion)
- Membrane depolarisation / receptor potential
- entry (through voltage-gated channels)
- Vesicle fusion and exocytosis of neurotransmitter
These 4 points cover the entire chain from stimulus to neurotransmitter release.
Step-by-Step Reasoning
Step 1: enters the cell
ions dissolved in the saliva contact the microvilli of the chemoreceptor cell. They enter the cell through protein channels in the microvillar membrane (the channels may be ligand-gated, opening in response to binding, or they may simply be open). Because the ions move down their electrochemical gradient through a protein channel, this is facilitated diffusion.
Step 2: Depolarisation and receptor potential
The influx of positive ions makes the inside of the cell less negative relative to the outside. This depolarises the cell surface membrane. The change in membrane potential is graded (proportional to the strength of the stimulus) and is called a receptor potential. If this receptor potential is large enough to reach threshold at the base of the cell, it triggers the next stage.
Step 3: entry
At the synaptic region at the base of the cell, the depolarisation causes voltage-gated channels to open. ions flow into the cell from the extracellular fluid, down their steep electrochemical gradient. (The resting concentration is much higher outside than inside.)
Step 4: Neurotransmitter release by exocytosis
The rise in intracellular concentration causes vesicles containing neurotransmitter to move towards the cell surface membrane at the synapse. The vesicles fuse with the membrane, and the neurotransmitter is released into the synaptic cleft by exocytosis. The neurotransmitter then diffuses across the cleft and binds to receptors on the sensory neurone dendrite, propagating the signal to the central nervous system.
Key Takeaways
- The general chain of events: stimulus → ion entry → depolarisation → entry → exocytosis
- Chemoreceptor cells are non-neuronal; they communicate with sensory neurones via synapses, not by direct electrical continuity
- The -triggered exocytosis mechanism is used at most chemical synapses and at the synaptic output of sensory receptor cells
- "Receptor potential" (graded) is distinct from "action potential" (all-or-nothing); receptor cells generate receptor potentials, which then trigger events at their synaptic terminal
Common Mistakes
- Saying enters by "diffusion" alone — must say "through channels" or "by facilitated diffusion" to earn the mark
- Confusing the chemoreceptor cell with a neurone (the chemoreceptor generates a receptor potential, not an action potential)
- Forgetting the role of ions in triggering exocytosis
- Saying "vesicles release neurotransmitter" without specifying fusion with the membrane or using the term "exocytosis"
- Saying the neurotransmitter "diffuses out of the cell" (it must be by exocytosis, not simple diffusion)
- Describing the events in a neurone instead of in a chemoreceptor cell
Things to Be Careful About
- Use "facilitated diffusion" or "through channels" for ion movement through protein channels
- "Receptor potential" is the correct term for the depolarisation in a receptor cell
- "Exocytosis" or "vesicles fuse with the cell surface membrane" is required for the release step
- The chemoreceptor cell synapses with a sensory neurone (not a motor neurone or another chemoreceptor)
- entry, not , drives the depolarisation here
Some of the neurotransmitters in the brain are produced through a series of reactions (reaction pathway) from a chemical called DOPA.
DOPA is also involved in other reaction pathways. For example, in the skin and eyes, DOPA is part of a different reaction pathway that depends on the TYR gene.
Describe and explain the phenotypic consequences for the skin and eyes of a person who is homozygous for a mutated, non-functional allele of the TYR gene.
Answer
- Tyrosinase is non-functional / not produced, so tyrosine cannot be converted to DOPA (or dopaquinone)
- No melanin is produced
- The person has albinism: pale skin / white hair, and poor vision (e.g. red or pink irises, light-sensitive eyes, jerky eye movements)
Albinism: pale skin, white hair, and poor vision (e.g. red/pink irises, light sensitivity, jerky eye movements) due to non-functional tyrosinase and no melanin.
Background Concept
The TYR gene codes for the enzyme tyrosinase. Tyrosinase is essential for the synthesis of melanin, the dark pigment found in skin, hair, and the iris of the eye. The pathway is:
Tyrosinase actually catalyses two consecutive steps: the conversion of tyrosine to DOPA, and the conversion of DOPA to dopaquinone. Without functional tyrosinase, the pathway is blocked and no melanin can be produced.
Melanin has several important functions:
- Colours the skin and hair
- Colours the iris of the eye and absorbs excess light inside the eye
- Protects the skin from UV radiation
- Darkens the skin in response to sunlight (a tanning response)
The TYR gene is a CIE Biology example used to illustrate the gene → protein (enzyme) → phenotype relationship. Other examples include HBB (sickle cell anaemia), F8 (haemophilia), and HTT (Huntington's disease). The condition caused by TYR mutation is albinism, which is recessive (heterozygotes are usually unaffected because one functional copy of the gene produces enough tyrosinase).
Understanding the Question
The question tells us that DOPA is used in different reaction pathways: in the brain, DOPA is part of a pathway leading to neurotransmitters; in the skin and eyes, DOPA is part of a pathway that depends on the TYR gene. We are asked to "describe and explain" the phenotypic consequences for the skin and eyes of a person who is homozygous for a non-functional TYR allele.
The command word "describe and explain" means we need to:
- Describe the phenotype (what the person looks like, what they can/can't see)
- Explain the biochemical mechanism (why this phenotype occurs)
3 marks are available, with 5 possible points to choose from in the mark scheme.
Approach
The answer should follow the chain:
Gene → Enzyme → Pathway block → No melanin → Phenotype
Specifically:
- Non-functional TYR gene → no functional tyrosinase
- Tyrosine not converted to DOPA (or DOPA not converted further)
- No melanin produced
- Skin: albino (pale skin, white hair)
- Eyes: poor vision (red/pink irises, light sensitivity, jerky movements)
Step-by-Step Reasoning
Step 1: Gene to enzyme
The TYR gene codes for the enzyme tyrosinase. A person who is homozygous for a non-functional (mutated) allele has no functional TYR gene product. As a result, no functional tyrosinase is produced in any of their cells. (The condition is recessive: heterozygotes have one functional allele and produce enough tyrosinase to make melanin normally.)
Step 2: Enzyme to pathway
Tyrosinase catalyses the first two steps of melanin synthesis: the conversion of tyrosine to DOPA, and the conversion of DOPA to dopaquinone. Without functional tyrosinase, neither step can occur, and the entire downstream melanin pathway is blocked.
Step 3: No melanin
Because the pathway is blocked, no melanin is produced. The person cannot synthesise melanin in any tissue that depends on this pathway — including the skin, hair follicles, and the iris of the eye.
Step 4: Skin phenotype — albinism
Without melanin, the consequences in the skin and hair are:
- The skin is very pale (no pigment to colour it)
- The hair is white (no pigment)
- The person is described as an albino
- (The skin is also more susceptible to UV damage and skin cancer, though this isn't required by the mark scheme.)
Step 5: Eye phenotype
Without melanin in the iris, several visual problems occur:
- The iris appears red or pink because the lack of pigment allows light to pass through and reflect off the blood at the back of the eye
- The person is more sensitive to bright light (photophobia) because melanin normally absorbs excess light inside the eye
- The person may have jerky eye movements (nystagmus) and reduced visual acuity
These constitute "poor vision" in the wording of the mark scheme.
Key Takeaways
- A single gene can affect multiple tissues if the enzyme it codes for is used in those tissues
- A non-functional enzyme blocks a metabolic pathway, leading to absence of the product
- TYR mutation is recessive — albinism appears only in homozygotes
- The same lack of melanin produces both the skin signs (pale skin, white hair) and the eye signs (red/pink irises, light sensitivity)
- This is a classic gene → enzyme → phenotype chain (one gene, one enzyme, multiple phenotypic effects)
Common Mistakes
- Saying "DOPA is not produced" — DOPA can be obtained from the diet; the issue is its conversion further along the pathway
- Confusing "no tyrosinase" with "no DOPA"
- Forgetting the eye effects — the question specifically asks about both skin and eyes
- Saying "no pigment" without specifying melanin
- Saying the person has normal vision — the eyes are clearly affected
- Describing the skin effects without explaining the biochemical mechanism (or vice versa)
- Not naming the condition (albinism / albino)
Things to Be Careful About
- The TYR gene affects both skin and eyes; both must be addressed
- The phenotype is albinism (pale skin, white hair, and visual problems)
- The mechanism is the absence of melanin due to non-functional tyrosinase
- "Homozygous" means two non-functional alleles; heterozygotes are usually unaffected (autosomal recessive inheritance)
- The mark scheme accepts either "no pigment / pale skin / white hair" OR the word "albino" as the skin description
- The mark scheme accepts either "red/pink eyes / light-sensitive / jerky eye movements" OR the words "poor vision" as the eye description