Biology 9700/53 — October/November 2024
Cambridge A-Level · Planning, Analysis and Evaluation · worked solutions for every part, with the mark scheme
Topics Analysis, Conclusions and Evaluation · Planning
Algae are a diverse group of photosynthetic eukaryotes in the kingdom Protoctista.
Rhodomonas salina and Skeletonema costatum are two species of alga that live in seawater.
Fig. 1.1 shows a scanning electron micrograph of R. salina, which is a unicellular organism. R. salina is red in colour.
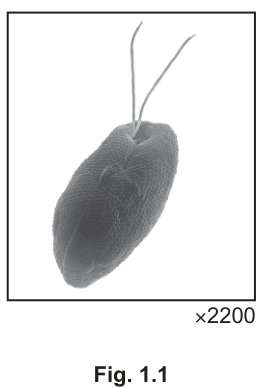
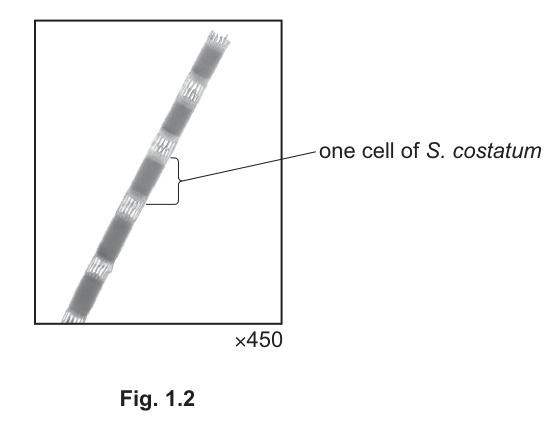
Fig. 1.2 shows a scanning electron micrograph of S. costatum, which is also a unicellular organism. The individual cells can group together in a chain. S. costatum is yellow-brown in colour.
A student prepared extracts of the photosynthetic pigments from R. salina and S. costatum. The student carried out chromatography to identify and compare the pigments in the two species.
The chromatograms are shown in Fig. 1.3.
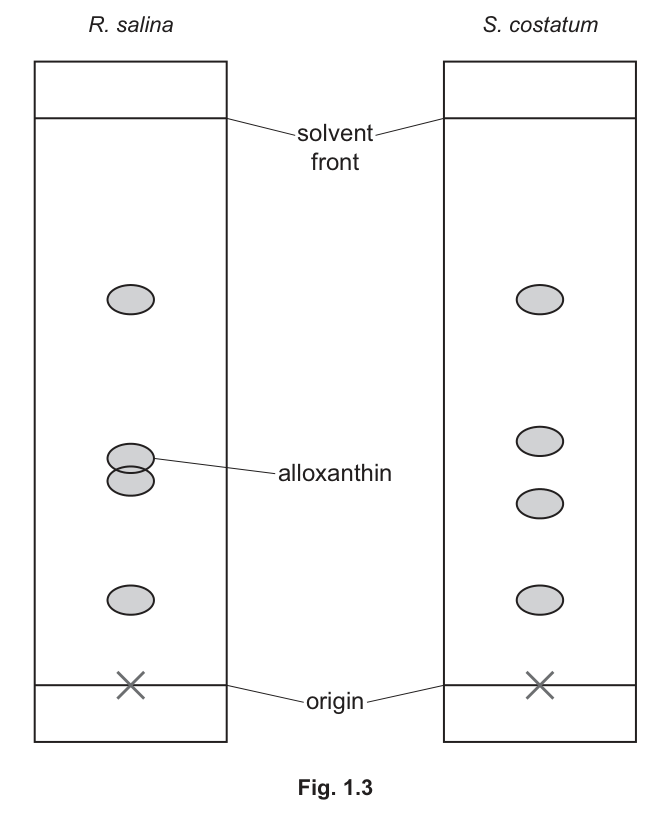
Use Fig. 1.3 to calculate the value of alloxanthin from R. salina.
of alloxanthin = ______
Answer
of alloxanthin = 0.40
0.40
Background Concept
Paper chromatography separates a mixture of pigments based on their relative solubilities in a solvent (the mobile phase) and their attraction to the chromatography paper (the stationary phase). Each pigment migrates a characteristic distance along the paper depending on these properties. The Rf value (retention factor) is defined as the ratio of the distance travelled by the pigment to the distance travelled by the solvent front:
Rf values are dimensionless (no units) and always lie between 0 and 1. They are characteristic of a particular pigment under a given set of conditions (solvent, paper type, temperature), so they can be used to identify unknown pigments by comparison with standards run under the same conditions.
Understanding the Question
The student has performed paper chromatography on pigment extracts from R. salina and S. costatum. Fig. 1.3 shows the resulting chromatograms, with the origin (where the extract was spotted) marked with an X at the bottom and the solvent front (the furthest point reached by the solvent) marked at the top. The alloxanthin spot in the R. salina chromatogram is labelled, and its position must be used to calculate the Rf value.
Approach
Apply the Rf formula by reading the position of the alloxanthin spot and the position of the solvent front, both measured from the origin (not from the top of the chromatogram).
Step-by-Step Reasoning
- The origin is at the bottom of the chromatogram, marked with an X.
- The solvent front is at the top of the chromatogram, marked with a horizontal line.
- The alloxanthin spot lies at approximately 40% of the distance from the origin to the solvent front.
- Therefore Rf = 0.40.
The mark scheme accepts 0.40 as the answer.
Key Takeaways
- Rf values are ratios, so they are dimensionless numbers between 0 and 1.
- The Rf value is independent of the absolute distance travelled; only the ratio matters.
- Rf values identify unknown pigments only when compared with standards run under identical conditions.
Common Mistakes
- Putting the distance from the spot to the solvent front (instead of from the origin to the spot) in the numerator.
- Adding units to the answer (the Rf value has no units).
- Reading the chromatogram incorrectly, e.g. measuring from the wrong reference point or misjudging the spot's vertical position.
Things to Be Careful About
- Always measure from the origin to the centre of the spot, not to the edge of the spot.
- The Rf value depends on the solvent system used; values from different experiments are only comparable if the same conditions were used.
Table 1.1 shows the values of some photosynthetic pigments.
Table 1.1
| photosynthetic pigment | value |
|---|---|
| -carotene | 0.94 |
| chlorophyll a | 0.68 |
| chlorophyll b | 0.54 |
| chlorophyll c | 0.15 |
| diadinoxanthin | 0.32 |
| fucoxanthin | 0.43 |
| phycocyanin | 0.35 |
R. salina lacks two photosynthetic pigments that are present in S. costatum.
Use Fig. 1.3 and Table 1.1 to identify the two photosynthetic pigments that are present in only S. costatum.
Answer
- Fucoxanthin
- Diadinoxanthin
Fucoxanthin and diadinoxanthin
Background Concept
Paper chromatography separates a mixture of pigments based on their relative solubilities. Each pigment has a characteristic Rf value under a given set of conditions. By comparing the Rf values of unknown spots with a table of known Rf values, the pigments can be identified. Different algal species contain different combinations of photosynthetic pigments, which determines the wavelengths of light they can absorb for photosynthesis.
Understanding the Question
The chromatograms in Fig. 1.3 show 4 spots for R. salina and 6 spots for S. costatum. The question states that R. salina lacks 2 pigments present in S. costatum. The task is to identify these 2 missing pigments using the Rf values in Table 1.1.
Approach
Compare the Rf values of the spots in both chromatograms with the Rf values in Table 1.1. Identify which pigments from Table 1.1 are present in both species and which are present only in S. costatum.
Step-by-Step Reasoning
The chromatogram of S. costatum shows 6 spots, two more than the 4 spots in R. salina. The 2 extra spots in S. costatum correspond to the 2 pigments present only in S. costatum.
Using Table 1.1:
- Fucoxanthin has an Rf of 0.43
- Diadinoxanthin has an Rf of 0.32
These two pigments are not present in R. salina. The mark scheme awards both fucoxanthin and diadinoxanthin as the answers.
Fucoxanthin is the brown pigment characteristic of diatoms (which S. costatum is), giving them their yellow-brown colour. Diadinoxanthin is a carotenoid that also contributes to the colour of diatoms and plays a role in photoprotection.
Key Takeaways
- Chromatography can identify pigments based on their characteristic Rf values.
- The pigments in an organism determine the wavelengths of light it can absorb for photosynthesis.
- S. costatum (a diatom) contains the brown pigment fucoxanthin, which gives it its yellow-brown colour and allows it to harvest green light effectively.
Common Mistakes
- Including chlorophyll c (which is also in S. costatum) as one of the missing pigments, when actually R. salina lacks exactly 2 of the pigments seen in S. costatum.
- Confusing the Rf values of similar pigments, e.g. chlorophyll a (0.68) vs chlorophyll b (0.54).
- Listing a pigment that is present in R. salina (e.g. β-carotene, phycocyanin, chlorophyll a) as one of the missing pigments.
Things to Be Careful About
- The Rf value depends on the specific conditions, so direct comparison with Table 1.1 assumes the same conditions were used.
- Some pigments have similar Rf values, which can make identification difficult.
- The presence of a pigment is indicated by a distinct spot, not by colour alone.
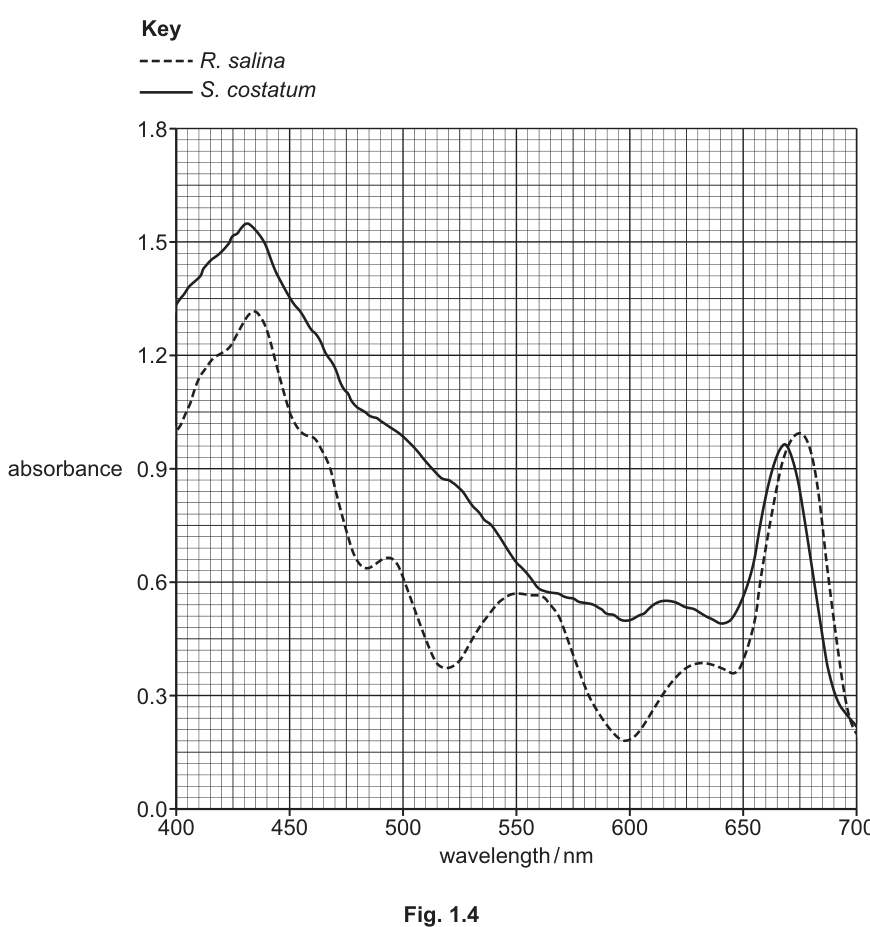
The extract of the photosynthetic pigments from each of the two species was used to obtain absorption spectra as shown in Fig. 1.4.
The student planned to investigate the effect of light wavelength on the rate of photosynthesis in R. salina and S. costatum.
The student planned to determine the rate of photosynthesis in the two species when they were exposed to three different colours of light:
- blue light, peak wavelength of
- green light, peak wavelength of
- red light, peak wavelength of .
Use Fig. 1.4 to compare the expected rates of photosynthesis for the two species in blue, green and red light.
blue light ....................................................................................................................................
green light .................................................................................................................................
red light .....................................................................................................................................
Answer
Blue light (455 nm): S. costatum (will have a) greater (rate of photosynthesis) than R. salina.
Green light (550 nm): S. costatum (will have a) slightly greater (rate of photosynthesis) than R. salina.
Red light (670 nm): S. costatum (will have) the same/similar (rate of photosynthesis as) R. salina.
Blue: S. costatum greater than R. salina; Green: S. costatum slightly greater than R. salina; Red: S. costatum the same/similar to R. salina
Background Concept
The rate of photosynthesis is proportional to the amount of light absorbed by the photosynthetic pigments (other factors being equal). The absorption spectrum of a pigment extract shows which wavelengths of light are most strongly absorbed. By comparing the absorbance values at specific wavelengths, the relative rates of photosynthesis at those wavelengths can be predicted.
Chlorophyll a, the main photosynthetic pigment, absorbs strongly in the blue (~430 nm) and red (~670 nm) regions of the spectrum but poorly in the green region. Accessory pigments (such as carotenoids) extend the range of wavelengths that can be used for photosynthesis. Diatoms like S. costatum contain fucoxanthin, which absorbs in the green-yellow region (around 500-550 nm), giving them a brown colour and allowing them to use green light for photosynthesis.
Understanding the Question
Fig. 1.4 shows the absorption spectra of pigment extracts from R. salina (dashed line) and S. costatum (solid line). The student plans to expose the algae to three colours of light: blue (455 nm), green (550 nm), and red (670 nm). The question asks for a comparison of the expected rates of photosynthesis in each colour of light for the two species.
Approach
Read the absorbance values from Fig. 1.4 at the three specified wavelengths for both species. Compare the values to determine which species will have a higher rate of photosynthesis in each colour of light.
Step-by-Step Reasoning
At 455 nm (blue light):
- S. costatum has higher absorbance (~1.4) than R. salina (~1.2)
- Therefore, S. costatum will have a greater rate of photosynthesis than R. salina in blue light.
At 550 nm (green light):
- S. costatum has higher absorbance (~0.7) than R. salina (~0.55)
- The difference is smaller than in blue light.
- S. costatum will have a slightly greater rate of photosynthesis than R. salina in green light.
At 670 nm (red light):
- Both species have similar high absorbance (~0.95-1.0)
- The rates of photosynthesis for the two species will be similar/the same in red light.
Key Takeaways
- The rate of photosynthesis is related to the absorbance of light by photosynthetic pigments.
- The absorption spectrum differs between species depending on their pigment composition.
- S. costatum generally absorbs more light than R. salina due to its additional pigments (fucoxanthin and diadinoxanthin).
- Red light around 670 nm is efficiently absorbed by chlorophyll a in both species.
- Accessory pigments (e.g. fucoxanthin in diatoms) extend the range of usable wavelengths.
Common Mistakes
- Confusing absorbance with absorption — they are related but not the same.
- Not specifying which species has a higher/lower rate, only stating the absorbance values.
- Saying S. costatum will have a higher rate in red light when actually they are similar.
- Not specifying the wavelength or light colour in the answer.
Things to Be Careful About
- The rate of photosynthesis is not the same as absorbance; however, in this question the comparison is being made.
- Different pigments have different absorption peaks, so the species' overall absorption spectrum is a combination of all their pigments.
- Even when absorbance is the same, the efficiency of energy transfer to the reaction centres can differ.
- The y-axis is absorbance, which is a logarithmic measure of how much light is absorbed.
In the investigation, the student used three different filters, blue, green and red, to expose the two species to the three different colours of light.
The student immobilised the algae in sodium alginate to form two sets of algal beads, one set for R. salina and one set for S. costatum.
The algal beads were the same size. Photosynthesis of the algae is not affected when they are immobilised in the beads.
The student placed the algal beads in small bottles for the experiment as shown in Fig. 1.5.
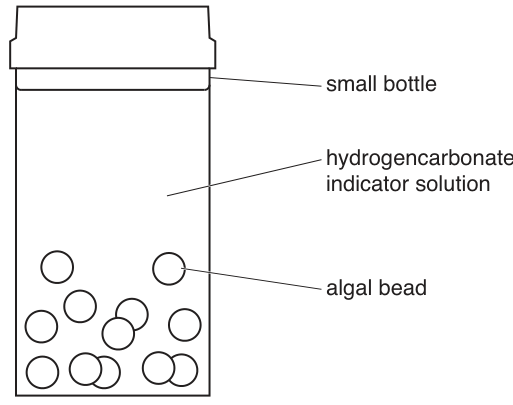
The student used hydrogencarbonate indicator solution to estimate the rate of photosynthesis when the algal beads were exposed to each colour of light. The indicator solution changes colour with pH as shown in Table 1.2.
Table 1.2
| colour of indicator solution | pH | concentration | rate of photosynthesis |
|---|---|---|---|
| yellow | 7.6 | increasing concentration | |
| yellow-orange | 7.8 | ||
| orange | 8.0 | ||
| orange-red | 8.2 | ||
| red | 8.4 | atmospheric concentration (0.04%) | increasing rate |
| red-magenta | 8.6 | ||
| magenta | 8.8 | ||
| magenta-purple | 9.0 | decreasing concentration | |
| purple | 9.2 |
The student used pH change as an indirect measure of the rate of photosynthesis. A greater decrease in concentration indicates a higher rate of photosynthesis.
For each bottle tested, the student:
- added algal beads to a small bottle containing indicator solution
- removed a sample of the indicator solution from the small bottle after some time
- used a colorimeter to measure the absorbance of the sample of the indicator solution.
The student used a calibration curve to estimate the pH of the samples of the indicator solution.
Suggest one reason why using algal beads, instead of placing the algal cells directly into the indicator solution in the bottles, improves the validity of the investigation.
Answer
Any one from:
- the absorbance (measured with the colorimeter) of the indicator solution is not affected by the algae;
- the indicator solution can be separated from the algal beads;
- (more accurate) standardisation of the mass/volume of algae is possible.
Absorbance of indicator not affected by algae / indicator can be separated from beads / standardisation of algae mass/volume
Background Concept
Validity in an experiment refers to whether the experiment measures what it is intended to measure. Confounding variables are factors that could affect the dependent variable but are not the independent variable. Controlling confounding variables improves the validity of the experiment.
In a colorimetry experiment, the absorbance of a solution is measured by passing light through the solution and detecting how much light is transmitted. Any particles suspended in the solution (e.g. algal cells) would scatter light and interfere with the measurement, making the reading inaccurate.
Understanding the Question
The student immobilises the algae in sodium alginate beads to form algal beads. The investigation uses a colorimeter to measure the absorbance of the indicator solution. The question asks for a reason why using algal beads (rather than free algal cells) improves the validity of the investigation.
Approach
Think about what could go wrong if free algal cells were placed in the indicator solution. How would this affect the measurement of absorbance or pH? How does using beads solve this problem?
Step-by-Step Reasoning
If free algal cells were placed directly in the indicator solution, they would:
- Affect the colour/absorbance of the solution, making the colorimeter reading inaccurate (the colorimeter would measure the absorbance of both the indicator and the algae, not just the indicator).
- Be difficult to separate from the indicator solution for measurement.
- Be difficult to standardise in terms of mass/volume.
Using algal beads solves these problems:
- The indicator solution can be separated from the algal beads before measuring absorbance, so the colorimeter reading reflects only the indicator.
- The absorbance of the algae themselves does not affect the measurement.
- The mass/volume of algae can be standardised more easily by counting beads of similar size.
Any one of these three reasons is acceptable according to the mark scheme.
Key Takeaways
- Immobilisation of cells/algae in beads is a common technique to separate biological material from the surrounding solution.
- Standardisation of the mass/volume of the biological material improves experimental validity.
- Using a colorimeter requires a clear solution; suspended particles would interfere with the measurement.
- Confounding variables must be controlled to ensure validity.
Common Mistakes
- Not linking the answer to validity — just saying beads are easier to use.
- Stating that beads are safer — this is not relevant to validity.
- Not specifying that the indicator solution can be separated from the beads.
- Vague answers like "it makes the experiment more accurate" without specifying how.
Things to Be Careful About
- The question is about validity, not safety or ease of use.
- The answer should specifically address how the use of beads improves the measurement.
- Any one of the three reasons in the mark scheme is acceptable.
Identify the two independent variables and the dependent variable in this investigation.
independent variable 1 ......................................................................................................
independent variable 2 ......................................................................................................
dependent variable ............................................................................................................
Answer
Independent variable 1: species (of alga)
Independent variable 2: wavelength/colour (of light)
Dependent variable: absorbance (or pH) of (the indicator) solution
IV1: species of alga; IV2: wavelength/colour of light; DV: absorbance/pH of solution
Background Concept
Variables in an experiment are classified as:
- Independent variable: what is deliberately changed by the experimenter.
- Dependent variable: what is measured.
- Controlled variables: factors kept constant to ensure a fair test.
In some experiments there are two independent variables (a factorial design). The dependent variable is the measurement used to assess the effect of the independent variables.
Understanding the Question
The student is investigating the effect of light wavelength on the rate of photosynthesis in two species of alga. The student uses three colours of light (blue, green, red) and two species of alga (R. salina, S. costatum). The dependent variable is the rate of photosynthesis, which is measured indirectly using the colorimeter and hydrogencarbonate indicator.
Approach
Identify what the experimenter is changing (independent variables) and what is being measured (dependent variable). In this experiment, two things are being changed (species and light colour), so there are two independent variables.
Step-by-Step Reasoning
- Independent variable 1: Species of alga (R. salina or S. costatum)
- Independent variable 2: Wavelength/colour of light (blue, green or red)
- Dependent variable: Absorbance (or pH) of the indicator solution
The rate of photosynthesis is measured indirectly by measuring the absorbance of the indicator solution using a colorimeter, then using a calibration curve to estimate the pH. The pH change indicates the rate of CO2 uptake by the algae (and hence the rate of photosynthesis).
Key Takeaways
- When two factors are varied, there are two independent variables (factorial design).
- The dependent variable is the measurement used to assess the effect of the independent variables.
- The rate of photosynthesis is measured indirectly in this experiment, using the indicator solution.
- Identifying variables is a key step in planning an experiment.
Common Mistakes
- Confusing the independent and dependent variables.
- Listing the controlled variables (e.g. temperature, distance from light) as independent variables.
- Saying the dependent variable is the rate of photosynthesis directly, when it is actually absorbance/pH.
- Only listing one independent variable when there are two.
Things to Be Careful About
- The dependent variable is what is measured, not what is calculated.
- Both species of alga and all three colours of light must be mentioned in the independent variables.
- Controlled variables are not the same as independent variables.
In addition to the colour filters, algal beads, small bottles, indicator solution and a colorimeter, the student had access to standard laboratory equipment.
The student carried out the investigation in a temperature-controlled room.
Describe a method the student could use to collect sufficient data so that the rates of photosynthesis of both species of alga in the three colours of light can be compared.
The description of your method should be set out in a logical way and be detailed enough for another person to follow.
You should not include a risk assessment or details of how to prepare the algal beads.
Method
- Set up 6 experimental small bottles: 3 for R. salina and 3 for S. costatum (one for each colour of light). Set up 3 control bottles with the same volume of indicator and the same number of glass or plastic beads (no algae) in place of the algal beads, one for each colour of light.
- Add a stated number (e.g. 10) of algal beads and a stated volume (e.g. 10 cm³) of red hydrogencarbonate indicator solution (pH 8.4) to each experimental bottle; add the same volume of indicator and the same number of glass/plastic beads to each control bottle.
- Place each bottle the same stated distance (e.g. 10 cm) from a lamp fitted with the appropriate coloured filter (blue, green or red).
- Carry out the experiment in a darkened room so that only the filtered light reaches the bottles.
- Leave for the same stated time period (e.g. 30 minutes).
- Take a sample of indicator solution from each bottle using a pipette and transfer it to a cuvette.
- Calibrate the colorimeter using a sample of fresh red indicator solution (pH 8.4) and use the same coloured filter in the colorimeter as was used to expose that bottle.
- Measure the absorbance of each sample and use a calibration curve to estimate the pH.
- Repeat each condition (species × colour combination) at least 3 times and calculate a mean pH for each.
See method above
Background Concept
A well-designed experiment controls all variables except the independent variable(s), uses appropriate controls, takes reliable measurements, and includes replication to allow statistical analysis. For colorimeter measurements, calibration is essential to convert absorbance readings to meaningful values (such as pH).
In this investigation, the rate of photosynthesis is measured indirectly using hydrogencarbonate indicator solution. The indicator changes colour with pH: a more alkaline (higher pH) solution indicates a lower CO₂ concentration, which indicates a higher rate of photosynthesis. A colorimeter is used to measure the absorbance of the indicator, which is then converted to pH using a calibration curve.
Understanding the Question
The student needs to describe a method to collect sufficient data to compare the rates of photosynthesis of both species of alga in three colours of light. The description should be detailed enough for someone else to follow and should be set out logically. The student has access to standard laboratory equipment and a temperature-controlled room.
Approach
Plan a method that includes:
- Setup (using filters, appropriate controls, standardising variables)
- Procedure (exposure to light, sampling)
- Measurement (colorimeter calibration, absorbance measurement)
- Replication (multiple measurements, calculating means)
Step-by-Step Reasoning
1. Setup of bottles and controls:
- 6 experimental bottles: 3 for R. salina and 3 for S. costatum (one for each colour of light)
- 3 control bottles: with the same volume of indicator and the same number of glass/plastic beads (no algae) in place of the algal beads
- Controls account for any changes in indicator colour not due to algal photosynthesis (e.g. due to the light or temperature alone).
2. Standardisation of variables:
- Same number/mass/volume of algal beads in each bottle
- Same volume/concentration of indicator solution in each bottle
- Start with red indicator (pH 8.4) so any change can be detected in either direction
- Same distance from the lamp to each bottle
- Same colour filter used for the same colour of light
3. Exposure to light:
- A lamp fitted with a coloured filter provides the coloured light (blue, green or red)
- The bottles are placed the same distance from the lamp
- The experiment is carried out in a darkened room to ensure that only the filtered light reaches the bottles
4. Sampling:
- After a set time, a sample of the indicator solution is removed from each bottle using a pipette
- The sample is transferred to a cuvette for colorimeter measurement
5. Colorimeter measurement:
- The colorimeter is calibrated with fresh red indicator (pH 8.4)
- The same coloured filter is used in the colorimeter as was used to expose that bottle (to account for any colour-specific absorbance by the indicator)
- The absorbance is measured and converted to pH using a calibration curve
6. Replication:
- Each condition (species × colour combination) is repeated at least 3 times
- A mean pH is calculated for each condition
- This allows for the calculation of standard deviation and the use of statistical tests (e.g. t-test)
Key Takeaways
- Use of controls (with non-algal beads) helps to account for any changes not due to algal photosynthesis.
- Standardisation of variables (number of beads, volume of indicator, distance from light, time) ensures a fair test.
- Replication and calculation of a mean improves reliability.
- The same coloured filter should be used in the colorimeter as was used to expose the bottle, to account for any colour-specific absorbance by the indicator.
- A darkened room ensures that only the filtered light reaches the bottles.
- The method should be set out in a logical order and be detailed enough for another person to follow.
Common Mistakes
- Not including a control.
- Not standardising the variables (e.g. using different numbers of beads).
- Not mentioning calibration of the colorimeter.
- Not mentioning replication and calculation of a mean.
- Not mentioning the darkened room.
- Using a different coloured filter in the colorimeter than was used to expose the bottle.
- Not starting with the same initial colour of indicator.
- Not including a time period for the experiment.
- Including a risk assessment or details of how to prepare the algal beads (the question says not to include these).
Things to Be Careful About
- The question asks for a method to collect data, not to analyse it.
- The method should be set out in a logical order.
- The description should be detailed enough for another person to follow.
- Use of "stated" values (e.g. a stated number, volume, distance, time) is preferred over no values, as it shows the student has thought about the practical details.
Identify a hazard in this investigation and state a risk associated with the hazard and state one precaution that the student should take.
Answer
| Hazard | Risk | Precaution |
|---|---|---|
| algae / beads | irritant / allergy | gloves / mask / goggles / PPE |
| hydrogencarbonate indicator (solution) | irritant / allergy | gloves / mask / goggles / PPE |
| heat from light source | burns | do not touch bulb / turn off lamp before handling |
Hazard: algae/beads or indicator; Risk: irritant/allergy; Precaution: wear PPE (gloves/mask/goggles)
Background Concept
Hazard identification is a key part of laboratory safety. A hazard is something with the potential to cause harm. The risk is the likelihood and severity of the harm. Precautions are measures taken to reduce the risk.
In any practical investigation, the student should be able to identify:
- A hazard (something with the potential to cause harm)
- The risk associated with the hazard (the harm that could occur)
- A precaution to reduce the risk (a safety measure)
Understanding the Question
The question asks for a hazard, its associated risk, and a precaution. The student should identify one specific hazard in the investigation, state a risk associated with it, and suggest a precaution.
Approach
Think about the materials and equipment used in the investigation: algae, algal beads, hydrogencarbonate indicator, colorimeter, light source, filters. Identify a hazard and the corresponding risk and precaution.
Step-by-Step Reasoning
Possible answers:
- Algae or hydrogencarbonate indicator: hazard (irritant/allergy), risk (skin or eye irritation), precaution (wear gloves/mask/goggles).
- Light source: hazard (heat), risk (burns), precaution (do not touch the bulb, turn off the lamp before handling).
The mark scheme accepts any of these combinations. The student only needs to provide one hazard, one risk, and one precaution.
Key Takeaways
- Hazards can be chemical (irritants, allergens), physical (heat, sharp objects), or biological (microorganisms).
- Risks should be specifically related to the hazard.
- Precautions should be practical and relevant to the experiment.
- All three components (hazard, risk, precaution) must be included in the answer.
Common Mistakes
- Listing a hazard without a corresponding risk or precaution.
- Stating a generic precaution (e.g. "be careful") that is not specific.
- Confusing the hazard and the risk.
- Not including all three components in the answer.
Things to Be Careful About
- The answer must include all three components: hazard, risk, and precaution.
- The precaution should be practical and appropriate for the laboratory setting.
- The risk should be specifically related to the hazard.
For each colour of light, the student carried out a statistical test to compare the pH of the samples taken from the small bottles that contained R. salina and S. costatum.
The student decided that a -test was the most appropriate test to use for these data.
Answer
Any one from:
- comparing the means of two (sets of data);
- (the data are) continuous;
- (the data are from populations that are) normally distributed;
- (the) standard deviations (of the two groups) are approximately the same.
Comparing means of two sets / continuous data / normally distributed / similar standard deviations
Background Concept
A t-test is a statistical test used to determine whether the means of two groups are significantly different from each other. It is appropriate when:
- The data are continuous (not categorical)
- The data are (approximately) normally distributed
- The two groups have approximately equal variances (standard deviations)
- The samples are independent
The t-test calculates a t-statistic, which is compared to a critical value at a chosen significance level (usually 0.05). If the t-statistic exceeds the critical value, the null hypothesis (that there is no significant difference between the means) is rejected.
Understanding the Question
The student used a t-test to compare the pH of samples from bottles containing R. salina and S. costatum for each colour of light. The question asks for a reason why a t-test was the most appropriate test for these data.
Approach
Think about the characteristics of the data:
- Two groups are being compared (R. salina and S. costatum).
- The data are continuous (pH).
- The data should be normally distributed and have similar standard deviations.
Step-by-Step Reasoning
The t-test is appropriate because:
- The means of two groups (R. salina and S. costatum) are being compared.
- The data are continuous (pH values).
- The data are likely normally distributed (typical for biological measurements).
- The standard deviations of the two groups are likely similar.
Any one of these reasons is acceptable according to the mark scheme.
Key Takeaways
- A t-test is used to compare two means.
- The data should be continuous and approximately normally distributed.
- The t-test assumes the variances of the two groups are similar.
- Choosing the correct statistical test depends on the characteristics of the data.
Common Mistakes
- Confusing the t-test with other statistical tests (e.g. chi-squared, correlation).
- Not linking the choice of test to the characteristics of the data.
- Stating that the t-test is appropriate because the data are categorical (pH is continuous, not categorical).
- Stating that the t-test is appropriate because there are two groups — while this is part of the reason, the data type matters too.
Things to Be Careful About
- The t-test compares means, not medians or modes.
- The t-test is for continuous data, not categorical data.
- The t-test assumes normality and equal variances.
- Other tests (e.g. Mann-Whitney U test) can be used for non-normal data.
Answer
There is no (significant) difference in the pH of the indicator samples (taken from the small bottles) between R. salina and S. costatum.
There is no (significant) difference in the pH of the indicator samples between R. salina and S. costatum.
Background Concept
The null hypothesis is a statement that there is no significant difference between the groups being compared. It is the hypothesis that the statistical test (e.g. t-test) is designed to test. The alternative hypothesis is that there is a significant difference.
The null hypothesis is accepted if the test statistic does not exceed the critical value (i.e. the observed difference is not statistically significant). It is rejected if the test statistic exceeds the critical value (i.e. the observed difference is statistically significant).
Understanding the Question
The student is using a t-test to compare the pH of samples from bottles containing R. salina and S. costatum. The question asks for the null hypothesis for this test.
Approach
State the null hypothesis in terms of the variables being compared. The null hypothesis should state that there is no significant difference between the means of the two groups.
Step-by-Step Reasoning
The null hypothesis is:
"There is no (significant) difference in the pH of the indicator samples taken from the small bottles between R. salina and S. costatum."
This is the standard form of a null hypothesis for a t-test comparing two groups. It specifies:
- The variable being compared (pH of the indicator samples)
- The two groups being compared (R. salina and S. costatum)
- The expected outcome (no significant difference)
The word "significant" is often included to emphasise that the null hypothesis refers to statistical significance, not just any difference.
Key Takeaways
- The null hypothesis states that there is no significant difference between the groups being compared.
- The null hypothesis is what the statistical test is designed to test.
- The alternative hypothesis is accepted if the null hypothesis is rejected.
- The null hypothesis should be specific to the variables and groups being compared.
Common Mistakes
- Stating the alternative hypothesis instead of the null hypothesis (e.g. "There is a significant difference...").
- Not specifying the variable (pH) being compared.
- Not specifying the two groups (R. salina and S. costatum).
- Using vague language (e.g. "no difference" without specifying what is being compared).
Things to Be Careful About
- The null hypothesis should be specific to the variables and groups being compared.
- The null hypothesis should be testable using the statistical test.
- The null hypothesis refers to the population means, not just the sample means.
A group of ecologists investigated the biodiversity of two peat bog ecosystems, A and B.
Peat bogs are wetland ecosystems that often contain rare species.
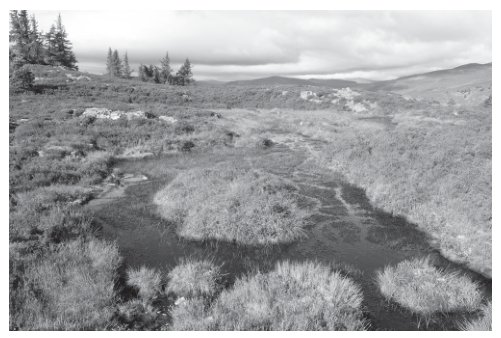
Fig. 2.1 shows an example of a peat bog.
The ecologists sampled the plant species in peat bog A and peat bog B.
The ecologists decided to use two suitable indices of biodiversity:
- Simpson’s index of diversity
- Shannon diversity index.
The ecologists had read that the two indices can lead to different conclusions.
The Shannon diversity index gives values in the range 1.5–3.5, where 1.5 is low biodiversity and 3.5 is high biodiversity.
The results are shown in Table 2.1.
Table 2.1
| peat bog A | peat bog B | ||
|---|---|---|---|
| species | number of individuals | species | number of individuals |
| L | 34 | L | 30 |
| M | 10 | M | 15 |
| N | 11 | N | 18 |
| O | 15 | O | 24 |
| P | 8 | P | 16 |
| Q | 7 | Q | 8 |
| R | 4 | R | 20 |
| S | 1 | S | 4 |
| T | 3 | T | 0 |
| U | 3 | U | 0 |
| V | 2 | V | 0 |
| W | 1 | W | 0 |
| Simpson’s index () = | 0.82 | Simpson’s index () = | 0.85 |
| Shannon index = | 2.03 | Shannon index = | 1.96 |
The ecologists concluded that one index indicated peat bog A had more biodiversity, but the other index indicated peat bog B had more biodiversity.
Suggest how the differences in the data in the two samples, shown in Table 2.1, may have led to the different conclusions.
Answer
- Peat bog A has more species (12 species vs 8) and a higher Shannon index, so the Shannon index suggests A is more biodiverse. [1]
- Peat bog B has a smaller range of species abundances (less dominance) and a higher Simpson's index, so Simpson's index suggests B is more biodiverse. [1]
A higher species richness (12 vs 8) supports Shannon's higher value for A; B's more even abundances (less dominance) support Simpson's higher value for B.
Background Concept
Two widely used indices of biodiversity weight species importance differently:
- Shannon diversity index (): largely driven by species richness (the number of different species) and the relative contribution of rarer species. Adding a new rare species pushes up noticeably.
- Simpson's index of diversity (): dominated by evenness — how equally abundant the species are. A community with one very dominant species and many rare species has a low , because the dominant species' term is large.
When two communities have different species numbers and different evenness, the two indices can point in opposite directions, and this is exactly what Table 2.1 shows.
Understanding the Question
We are given results for two peat bogs:
- Peat bog A: 12 species, total 99 individuals, Shannon = 2.03, Simpson's = 0.82.
- Peat bog B: 8 species, total 135 individuals, Shannon = 1.96, Simpson's = 0.85.
The question asks us to suggest how the differences in the data caused the indices to disagree. We must point to features in the data (not just state which index is larger) and link them to the emphasis of each index.
Approach
- Compare species richness: A (12) > B (8) — this should favour A under Shannon.
- Compare the spread/dominance of abundances: in A, species L has 34 of 99 (≈34%) — strong dominance; in B the largest count is 30 of 135 (≈22%) — more even, favouring B under Simpson's.
- Combine these into two creditable points, one per index, with the data justification.
Step-by-Step Reasoning
Marking point 1 — why Shannon ranks A higher:
- Peat bog A has more species (12) than peat bog B (8). Four of the species in A (T, U, V, W) are absent from B.
- The Shannon index is sensitive to the addition of rare species, so the extra rare species in A raise above B's value (2.03 > 1.96). Hence Shannon's index indicates A is more biodiverse.
Marking point 2 — why Simpson's ranks B higher:
- Peat bog B has a smaller range of species abundances and a higher total number of individuals (135 vs 99), so its community is more even. No single species dominates as strongly as L does in A.
- Simpson's index is heavily influenced by evenness (the dominant species' squared proportion), so the more even community in B yields a higher (0.85 > 0.82). Hence Simpson's index indicates B is more biodiverse.
The fallback mark (1 mark only) is awarded if a candidate simply says A has more species and B has a smaller range of abundances, without linking either to a specific index.
Key Takeaways
- Shannon's index is richness-sensitive; Simpson's index is evenness-sensitive.
- When one community is richer but less even than another, the two indices can legitimately disagree.
- Always state what feature of the data (numbers of species, total individuals, dominance) drives each index's conclusion.
Common Mistakes
- Stating only the index values without explaining why the data produced them.
- Confusing which index is influenced by which feature (e.g. claiming Shannon depends on evenness).
- Saying A has "more individuals" — A actually has fewer total individuals; what matters is the spread.
- Failing to compare like with like (must name both bog A and bog B in each point).
Things to Be Careful About
- The two marks require two distinct points: one for the Shannon conclusion, one for the Simpson's conclusion.
- Use the exact terms "species richness / number of species" for Shannon, and "species evenness / range of species abundances" for Simpson's — these are what the mark scheme credits.
The ecologists sampled the invertebrate species in peat bogs A and B and calculated invertebrate biodiversity using Simpson’s index of diversity.
The ecologists sampled invertebrate species in peat bog A:
- between 13:00 and 16:00 on three different days within a 30-day period
- at 10 random sites along the edge of a path in the peat bog
- by sampling the invertebrates within a quadrat placed at each site
- by using an identification key to identify the species
- by counting the number of individuals of each species.
Describe how this sampling method could be improved to make sure the results are more representative of all invertebrates in the whole of peat bog A.
Answer
Any three from:
- Sample at different times of the year (not only over one month). [1]
- Sample at night or at different times of day (not only 13:00–16:00). [1]
- Sample at sites other than along the path (e.g. away from the path / in the centre of the bog). [1]
- Use another named technique to sample invertebrates, e.g. sweep netting or pitfall traps. [1]
- Use an expert, an identification app or a guidebook (instead of only an identification key). [1]
Three specific improvements to the sampling method are: vary time of year, vary time of day/night, and sample away from the path.
Background Concept
A sampling method is representative only if it captures the full range of habitats, seasons, weather conditions and behaviours present in the ecosystem. Common sources of bias include:
- Temporal bias — sampling only one season, or only daytime, misses species that are active in other seasons or at night (e.g. many invertebrates are nocturnal or only emerge as adults briefly).
- Spatial bias — sampling only one microhabitat (such as path edges) under-represents species that live elsewhere (e.g. in open water, deep moss, or the bog centre).
- Methodological bias — a single technique (quadrat) only catches invertebrates present in/on the surface vegetation; many species live in soil, water, on other organisms or fly above the quadrat.
- Identification bias — keys rely on the user; small or juvenile specimens may be misidentified or ignored.
Understanding the Question
The candidate must read the sampling protocol in (b)(i) and pick out specific weaknesses that limit how representative the data are of the whole peat bog A. Each weakness must be paired with a concrete improvement that addresses it.
Approach
For each dimension (time of year, time of day, location, technique, identification), ask: "Is the current method restricted in this dimension? If so, what should change?" Pick the three strongest, most biologically specific improvements.
Step-by-Step Reasoning
- Time of year — sampling was only over a 30-day period. Many invertebrates have life cycles tied to season, so this misses species that emerge at other times. Improvement: sample in different seasons / months across the year.
- Time of day — sampling was 13:00–16:00 only. Many invertebrates (e.g. ground beetles, moths, many flies) are nocturnal or crepuscular. Improvement: sample at night / at multiple times of day.
- Location — only "along the edge of a path". Path edges are disturbed habitats and may not be representative of the bog as a whole. Improvement: sample at sites away from the path, e.g. random coordinates across the bog.
- Technique — only a 1 m² quadrat. A quadrat samples surface vegetation; many invertebrates (flying, aquatic, soil-dwelling) are missed. Improvement: combine with another technique such as sweep netting, pitfall traps, kick sampling or a light trap.
- Identification — an identification key requires accurate morphological matching; juveniles, damaged specimens or cryptic species may be wrongly identified or skipped. Improvement: consult an expert taxonomist, use a verified identification app, or use a comprehensive guidebook.
Any three of these are credited (1 mark each).
Key Takeaways
- "Representative sampling" means covering the full range of times, places, and methods that the organisms occupy.
- Always pair an improvement with the specific bias it addresses — vague answers like "improve accuracy" do not score.
- A combination of techniques is almost always more representative than a single technique.
Common Mistakes
- Vague answers: "sample more", "take more readings" — not specific to the protocol.
- Suggesting improvements that contradict the protocol (e.g. "use a smaller quadrat") without justifying the bias.
- Naming a technique but not saying what it adds (e.g. "use a net" — what will it catch that the quadrat missed?).
- Confusing replication (more quadrats) with representativeness (different times / places / methods).
Things to Be Careful About
- "Three from five" — choose the three most biologically specific improvements rather than spending time on weaker ones.
- Use precise ecological language: "time of year", "time of day/night", "sites away from the path".
- Each improvement must be a change to the current method, not a restatement of it.
Table 2.2 shows the results of the invertebrate sampling in peat bog A.
The formula for Simpson’s index of diversity () is:
= number of individuals of each species present in the sample
= total number of all individuals of all species present in the sample
Complete Table 2.2 and use the formula provided to calculate Simpson’s index of diversity.
Table 2.2
| species | |||
|---|---|---|---|
| Chartoscirta cocksii | 11 | 0.071 | 0.005 |
| Eristalis cryptarum | 72 | 0.462 | 0.213 |
| Glyphesis cottonae | 8 | 0.051 | 0.003 |
| Glyphesis servulus | 6 | 0.038 | 0.001 |
| Loxocera nigrifrons | 29 | 0.186 | 0.035 |
| Stenus argus | 10 | 0.064 | 0.004 |
| Trechus rivularis | 7 | 0.045 | 0.002 |
| Tipula limbata | 13 | ......... | ......... |
| ......... |
Simpson’s index of diversity () = ______
Working
Total number of individuals:
For Tipula limbata ():
Sum of all :
Simpson's index of diversity:
Answer
| species | |||
|---|---|---|---|
| Tipula limbata | 13 | 0.083 | 0.007 |
Simpson's index of diversity,
0.730
Background Concept
Simpson's index of diversity, , measures the probability that two individuals drawn at random from a sample belong to different species. It is given by:
where is the number of individuals of one species and is the total across all species. Each is the probability that two randomly chosen individuals are both that species; summing across species and subtracting from 1 gives the probability the two individuals are of different species.
ranges from 0 (a monoculture — all individuals the same species) to 1 (a perfectly even community with very many species). The closer to 1, the higher the diversity.
Understanding the Question
The table gives and the pre-completed and for the first seven species. We must:
- Calculate and for the missing row (Tipula limbata, ).
- Sum all eight values.
- Apply .
The marks are: 1 mark for the missing row, 1 mark for the sum, 1 mark for .
Approach
- First compute by adding the eight values.
- Then for Tipula limbata and square it.
- Add the new to the existing sum to get the total.
- Subtract from 1 to obtain .
Step-by-Step Reasoning
Step 1 — Total :
Step 2 — Missing row for Tipula limbata:
(rounded to 3 d.p. to match the rest of the table)
Step 3 — Sum of all :
Step 4 — Simpson's index:
Key Takeaways
- is the probability of drawing two different species at random — high means high diversity.
- The largest single contribution comes from the most abundant species; here that is Eristalis cryptarum (0.213), which is why is held down below 1.
- Always state to the same precision as the values in the table (3 d.p.).
Common Mistakes
- Forgetting to convert to a proportion before squaring.
- Rounding to 2 d.p. and then squaring — propagates the error into and the final .
- Adding the values instead of the values.
- Computing as 0.73 (loses the trailing zero and the 3-d.p. format).
- Using the wrong (e.g. forgetting one of the species).
Things to Be Careful About
- Match the decimal places used in the question (3 d.p.).
- is a dimensionless number — do not write a unit.
- If your answer differs slightly (e.g. 0.729), check rounding of — using 0.0833 throughout gives 0.7297 ≈ 0.730, matching the mark scheme.
The ecologists calculated a value of 0.710 for peat bog B.
Use your value of from (b)(ii) to compare the biodiversity of peat bog A and peat bog B.
Answer
Peat bog A has slightly higher biodiversity than peat bog B (since ).
Peat bog A has slightly higher biodiversity than peat bog B.
Background Concept
Simpson's index of diversity is interpreted directly: a higher means a higher probability that two randomly chosen individuals belong to different species, i.e. a more diverse community. Comparing two values from the same index, calculated the same way, tells us which community is more diverse.
Understanding the Question
We have:
- (from part (b)(ii))
- (given in the question)
The question asks us to compare the biodiversity of the two peat bogs using these two values. One mark is awarded for correctly identifying which is higher.
Approach
Since both values are calculated using the same formula on data collected the same way, they can be compared directly. Identify which is larger and state which bog has higher invertebrate biodiversity.
Step-by-Step Reasoning
, so peat bog A has the higher and therefore slightly higher invertebrate biodiversity than peat bog B. The difference is small (0.020), so the wording "slightly higher" is appropriate — the mark scheme explicitly allows this.
Key Takeaways
- When indices are calculated identically, higher = higher diversity.
- "Slightly higher" is a fair description when the difference between the two values is small.
Common Mistakes
- Saying B has higher diversity because its is "lower" — confusing the wording.
- Comparing the plant biodiversity (from Table 2.1) instead of the invertebrate biodiversity (Table 2.2).
- Inventing a percentage difference rather than a direct comparison — not required.
Things to Be Careful About
- Use the value calculated in (b)(ii), not the one in Table 2.1 — the question is about invertebrate biodiversity.
- The mark scheme allows either direction provided the comparison is correctly argued; here A > B is correct.