Biology 9700/51 — October/November 2024
Cambridge A-Level · Planning, Analysis and Evaluation · worked solutions for every part, with the mark scheme
Topics Analysis, Conclusions and Evaluation
Algae are a diverse group of photosynthetic eukaryotes in the kingdom Protoctista.
Rhodomonas salina and Skeletonema costatum are two species of alga that live in seawater.
Fig. 1.1 shows a scanning electron micrograph of R. salina, which is a unicellular organism. R. salina is red in colour.
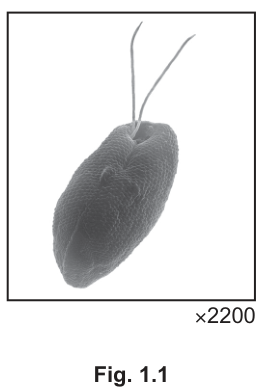
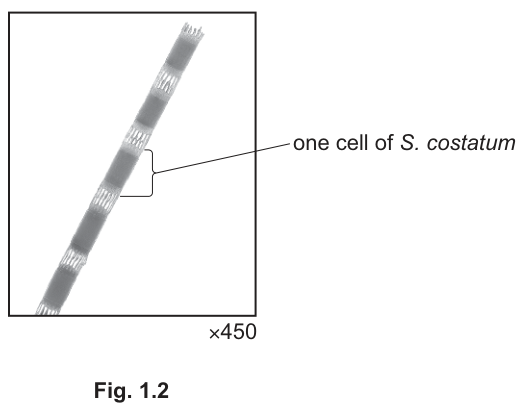
Fig. 1.2 shows a scanning electron micrograph of S. costatum, which is also a unicellular organism. The individual cells can group together in a chain. S. costatum is yellow-brown in colour.
A student prepared extracts of the photosynthetic pigments from R. salina and S. costatum. The student carried out chromatography to identify and compare the pigments in the two species.
The chromatograms are shown in Fig. 1.3.
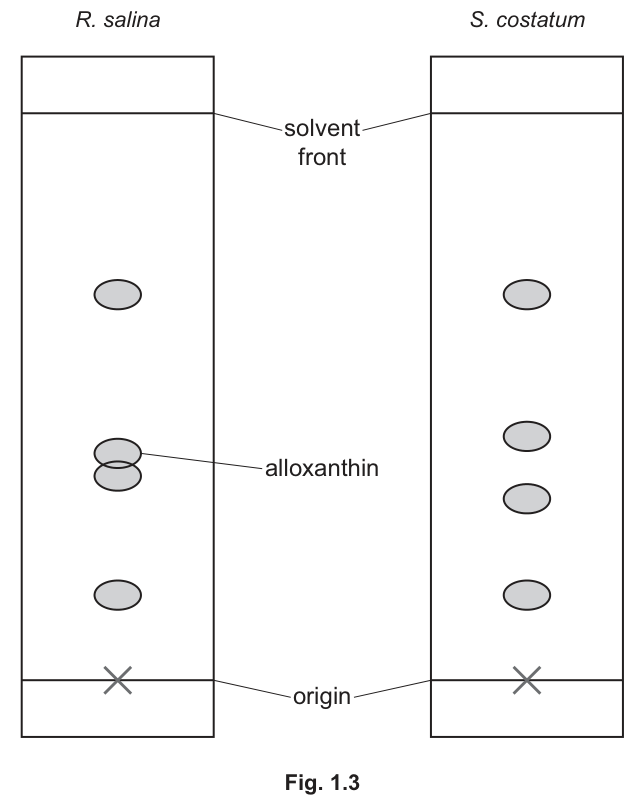
Use Fig. 1.3 to calculate the value of alloxanthin from R. salina.
of alloxanthin = ______
No worked solution for this part yet — the official mark scheme is linked at the top of the page.
Table 1.1 shows the values of some photosynthetic pigments.
Table 1.1
| photosynthetic pigment | value |
|---|---|
| -carotene | 0.94 |
| chlorophyll a | 0.68 |
| chlorophyll b | 0.54 |
| chlorophyll c | 0.15 |
| diadinoxanthin | 0.32 |
| fucoxanthin | 0.43 |
| phycocyanin | 0.35 |
R. salina lacks two photosynthetic pigments that are present in S. costatum.
Use Fig. 1.3 and Table 1.1 to identify the two photosynthetic pigments that are present in only S. costatum.
No worked solution for this part yet — the official mark scheme is linked at the top of the page.
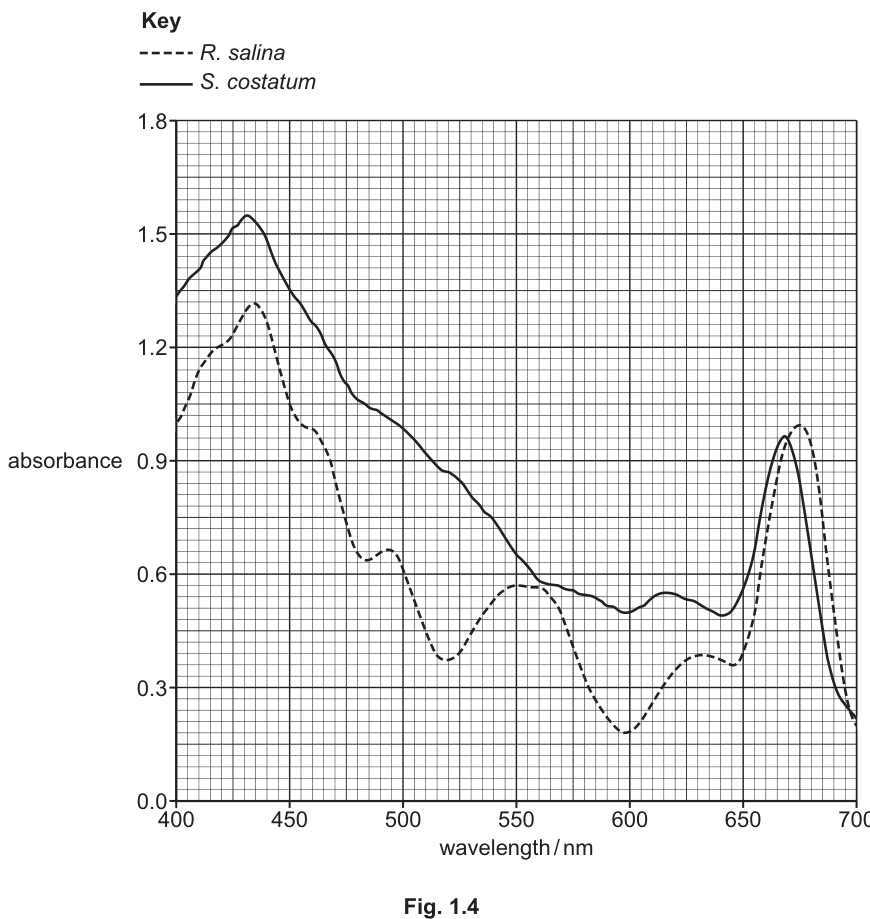
The extract of the photosynthetic pigments from each of the two species was used to obtain absorption spectra as shown in Fig. 1.4.
The student planned to investigate the effect of light wavelength on the rate of photosynthesis in R. salina and S. costatum.
The student planned to determine the rate of photosynthesis in the two species when they were exposed to three different colours of light:
- blue light, peak wavelength of
- green light, peak wavelength of
- red light, peak wavelength of .
Use Fig. 1.4 to compare the expected rates of photosynthesis for the two species in blue, green and red light.
blue light ______
green light ______
red light ______
No worked solution for this part yet — the official mark scheme is linked at the top of the page.
In the investigation, the student used three different filters, blue, green and red, to expose the two species to the three different colours of light.
The student immobilised the algae in sodium alginate to form two sets of algal beads, one set for R. salina and one set for S. costatum.
The algal beads were the same size. Photosynthesis of the algae is not affected when they are immobilised in the beads.
The student placed the algal beads in small bottles for the experiment as shown in Fig. 1.5.
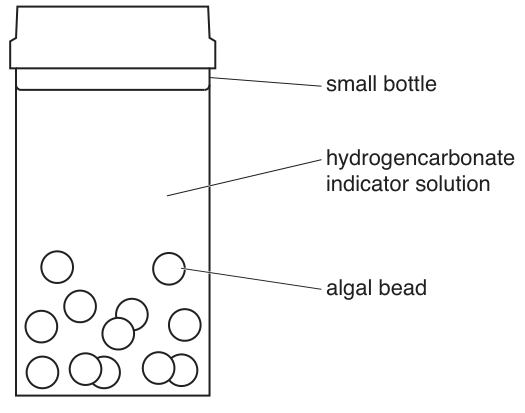
The student used hydrogencarbonate indicator solution to estimate the rate of photosynthesis when the algal beads were exposed to each colour of light. The indicator solution changes colour with pH as shown in Table 1.2.
Table 1.2
| colour of indicator solution | pH | concentration | rate of photosynthesis |
|---|---|---|---|
| yellow | 7.6 | increasing concentration (up arrow) | |
| yellow-orange | 7.8 | ||
| orange | 8.0 | ||
| orange-red | 8.2 | ||
| red | 8.4 | atmospheric concentration (0.04%) | |
| red-magenta | 8.6 | increasing rate (down arrow) | |
| magenta | 8.8 | ||
| magenta-purple | 9.0 | decreasing concentration (down arrow) | |
| purple | 9.2 |
The student used pH change as an indirect measure of the rate of photosynthesis. A greater decrease in concentration indicates a higher rate of photosynthesis.
For each bottle tested, the student:
- added algal beads to a small bottle containing indicator solution
- removed a sample of the indicator solution from the small bottle after some time
- used a colorimeter to measure the absorbance of the sample of the indicator solution.
The student used a calibration curve to estimate the pH of the samples of the indicator solution.
Suggest one reason why using algal beads, instead of placing the algal cells directly into the indicator solution in the bottles, improves the validity of the investigation.
No worked solution for this part yet — the official mark scheme is linked at the top of the page.
Identify the two independent variables and the dependent variable in this investigation.
independent variable 1 ______
independent variable 2 ______
dependent variable ______
No worked solution for this part yet — the official mark scheme is linked at the top of the page.
In addition to the colour filters, algal beads, small bottles, indicator solution and a colorimeter, the student had access to standard laboratory equipment.
The student carried out the investigation in a temperature-controlled room.
Describe a method the student could use to collect sufficient data so that the rates of photosynthesis of both species of alga in the three colours of light can be compared.
The description of your method should be set out in a logical way and be detailed enough for another person to follow.
You should not include a risk assessment or details of how to prepare the algal beads.
No worked solution for this part yet — the official mark scheme is linked at the top of the page.
Identify a hazard in this investigation and state a risk associated with the hazard and state one precaution that the student should take.
No worked solution for this part yet — the official mark scheme is linked at the top of the page.
For each colour of light, the student carried out a statistical test to compare the pH of the samples taken from the small bottles that contained R. salina and S. costatum.
The student decided that a -test was the most appropriate test to use for these data.
No worked solution for this part yet — the official mark scheme is linked at the top of the page.
No worked solution for this part yet — the official mark scheme is linked at the top of the page.
A group of ecologists investigated the biodiversity of two peat bog ecosystems, A and B.
Peat bogs are wetland ecosystems that often contain rare species.
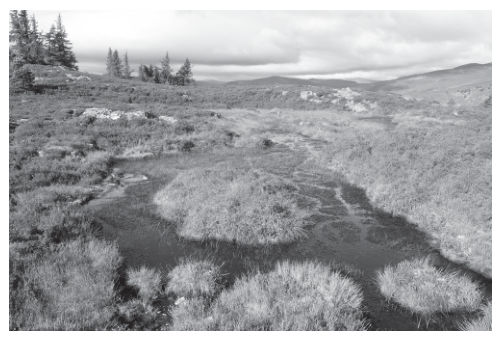
Fig. 2.1 shows an example of a peat bog.
The ecologists sampled the plant species in peat bog A and peat bog B.
The ecologists decided to use two suitable indices of biodiversity:
- Simpson’s index of diversity
- Shannon diversity index.
The ecologists had read that the two indices can lead to different conclusions.
The Shannon diversity index gives values in the range 1.5–3.5, where 1.5 is low biodiversity and 3.5 is high biodiversity.
The results are shown in Table 2.1.
Table 2.1
| peat bog A | peat bog B | ||
|---|---|---|---|
| species | number of individuals | species | number of individuals |
| L | 34 | L | 30 |
| M | 10 | M | 15 |
| N | 11 | N | 18 |
| O | 15 | O | 24 |
| P | 8 | P | 16 |
| Q | 7 | Q | 8 |
| R | 4 | R | 20 |
| S | 1 | S | 4 |
| T | 3 | T | 0 |
| U | 3 | U | 0 |
| V | 2 | V | 0 |
| W | 1 | W | 0 |
| Simpson’s index () = | 0.82 | Simpson’s index () = | 0.85 |
| Shannon index = | 2.03 | Shannon index = | 1.96 |
The ecologists concluded that one index indicated peat bog A had more biodiversity, but the other index indicated peat bog B had more biodiversity.
Suggest how the differences in the data in the two samples, shown in Table 2.1, may have led to the different conclusions.
Answer
Peat bog A has a higher number of species (12 vs 8 in peat bog B) and so has a higher Shannon index.
Peat bog B has a smaller range of species abundance (a more even distribution of individuals across species) and so has a higher Simpson's index.
A has more species → higher Shannon; B has more even species abundance → higher Simpson's.
Background Concept
Biodiversity is a measure of the variety of life in an ecosystem and can be quantified in several ways. Two indices commonly used by ecologists are:
- Simpson's index of diversity (): heavily influenced by the most abundant (dominant) species. It rewards evenness — when individuals are spread more evenly across species, rises.
- Shannon diversity index (): more sensitive to species richness — adding a rare species increases noticeably, even when the dominant species are unchanged.
Because the two indices emphasise different features of a community, the same pair of sites can produce opposite rankings under the two indices.
Understanding the Question
The ecologists sampled plants in peat bogs A and B. Table 2.1 shows:
- Peat bog A: 12 species, 99 individuals, ,
- Peat bog B: 8 species, 135 individuals, ,
Shannon says A is more biodiverse (2.03 > 1.96), but Simpson's says B is more biodiverse (0.85 > 0.82). The question asks how the data differences in Table 2.1 might explain this conflict.
Approach
Identify the data feature that each index emphasises, then pull the relevant numbers from Table 2.1 to show that the data support the index-specific feature for the index-specific site:
- Shannon ↔ species richness (number of species)
- Simpson's ↔ evenness / range of species abundances
Step-by-Step Reasoning
-
Shannon is higher for A because A has more species. A has 12 species, B has only 8. The Shannon index counts each species (including rare ones such as the singletons S, T, U, V, W in A), so the four extra species in A push up.
-
Simpson's index is higher for B because B is more even. Look at the spread of individual counts:
- A: 34, 10, 11, 15, 8, 7, 4, 1, 3, 3, 2, 1 — the dominant species L (34) accounts for over a third of the 99 individuals, and several species drop to 1.
- B: 30, 15, 18, 24, 16, 8, 20, 4 — the largest count (30) is roughly a fifth of the 135 individuals, and no species has only 1 individual.
Simpson's index rewards this narrower range of species abundances in B.
-
The underlying tension is therefore richness (favours A, picked up by Shannon) versus evenness (favours B, picked up by Simpson's). The data — 12 vs 8 species, plus the more even spread of counts in B — produce the disagreement.
Key Takeaways
- The Shannon index is more sensitive to species richness (number of species).
- Simpson's index is more sensitive to species evenness (how evenly individuals are spread across species).
- The two indices can rank the same pair of communities differently when one site has more species but less even abundance than the other.
Common Mistakes
- Vague answers such as "the indices measure different things" — the candidate must point to the specific data (number of species, range of abundance) that drives each index.
- Saying "A has more individuals so B is more biodiverse" — total abundance does not by itself determine evenness; it is the relative spread that matters.
- Quoting only one of the two indices and forgetting to compare it with the other.
Things to Be Careful About
- Use the exact numbers from Table 2.1: 12 vs 8 species; 99 vs 135 individuals.
- Tie each observation directly to the relevant index: Shannon ↔ species richness; Simpson's ↔ evenness / range of species abundance.
- The mark scheme allows "ORA" (the reverse argument) — B has fewer species; A has a wider range of species abundance. Either framing is acceptable, but both points must be made to score 2 marks.
The ecologists sampled the invertebrate species in peat bogs A and B and calculated invertebrate biodiversity using Simpson’s index of diversity.
The ecologists sampled invertebrate species in peat bog A:
- between 13:00 and 16:00 on three different days within a 30-day period
- at 10 random sites along the edge of a path in the peat bog
- by sampling the invertebrates within a quadrat placed at each site
- by using an identification key to identify the species
- by counting the number of individuals of each species.
Describe how this sampling method could be improved to make sure the results are more representative of all invertebrates in the whole of peat bog A.
Answer
Any three from:
- sample at different times of year (not only within one 30-day period);
- sample at night / at different times of day (not only between 13:00 and 16:00);
- sample at sites other than along the path (e.g., in the centre of the bog);
- use another named technique (e.g., pitfall traps, sweep netting, Tullgren funnel, light trap);
- use an expert / identification app / guidebook (instead of an identification key).
Any three of: (1) different times of year; (2) different times of day / night; (3) sites away from the path edge; (4) another named technique; (5) expert / app / guidebook.
Background Concept
A sampling method is "representative" of a whole habitat when it captures the same range of species and relative abundances you would find if you sampled everywhere and at all times. To check representativeness, an ecologist asks:
- Does the sample cover enough of the habitat's area?
- Does it cover enough of the year / day (some species are seasonal or nocturnal)?
- Does it catch the right kinds of organisms (different sampling methods target different groups)?
- Are the identifications reliable?
For invertebrates in peat bogs the fauna is often seasonal and includes many nocturnal or soil-/litter-dwelling species, so a single daytime path-edge quadrat will miss a large fraction of the community.
Understanding the Question
The ecologists' original method was:
- 13:00–16:00, three days within a 30-day period
- 10 random sites along the edge of a path in the peat bog
- quadrats at each site
- identification key used to identify species
- individuals counted
The question asks how to improve this so the results are more representative of all invertebrates in the whole of peat bog A.
Approach
Take each parameter of the original design in turn, ask which kinds of invertebrates it excludes, and propose a specific change that brings those excluded groups into the sample.
Step-by-Step Reasoning
- Time of year — sampling only within one 30-day window misses species whose adults are active in other seasons. Sampling at different times of year (e.g., spring, summer, autumn) captures the seasonal turnover of the invertebrate community.
- Time of day — 13:00–16:00 misses nocturnal invertebrates. Sampling at night, or at additional times of day, catches species active after dark.
- Spatial coverage — sampling only along the path edge excludes invertebrates that live away from the path (in the bog interior, in moss hummocks, in standing water). Sampling at sites throughout the bog, not just the path edge, gives a more representative picture.
- Sampling technique — a ground quadrat catches surface-active invertebrates but may miss those in soil, leaf litter, vegetation, or water. Using another technique such as pitfall traps, sweep netting, a Tullgren funnel or a light trap captures additional groups.
- Identification accuracy — an identification key is limited by what the user can resolve. Using an expert, an identification app, or a more detailed guidebook reduces misidentification and improves the chance of correctly distinguishing similar species.
Any three of these earn full marks.
Key Takeaways
- "More representative" means covering more of the spatial, temporal and methodological dimensions of the habitat.
- Each parameter of an existing sampling design is a candidate for an improvement.
- A strong suggestion pairs a specific change (e.g., "use pitfall traps") with the limitation it fixes (e.g., "the quadrat misses ground-dwelling invertebrates").
Common Mistakes
- Vague answers such as "sample more" or "do it more carefully" — these do not name a specific change.
- "Repeat the experiment" — repeating without changing anything does not improve representativeness.
- "Use better equipment" without naming the equipment or the limitation it addresses.
Things to Be Careful About
- The mark scheme requires a specific change (named technique, named time period, named site location).
- "Sample at sites other than along the path" — the path edge may be unrepresentative because trampling, light and human disturbance change the community. Sites away from the edge sample the bog proper.
- "Use an identification app" counts as a named alternative to the identification key.
Table 2.2 shows the results of the invertebrate sampling in peat bog A.
The formula for Simpson’s index of diversity () is:
= number of individuals of each species present in the sample
= total number of all individuals of all species present in the sample
Complete Table 2.2 and use the formula provided to calculate Simpson’s index of diversity.
Table 2.2
| species | |||
|---|---|---|---|
| Chartoscirta cocksii | 11 | 0.071 | 0.005 |
| Eristalis cryptarum | 72 | 0.462 | 0.213 |
| Glyphesis cottonae | 8 | 0.051 | 0.003 |
| Glyphesis servulus | 6 | 0.038 | 0.001 |
| Loxocera nigrifrons | 29 | 0.186 | 0.035 |
| Stenus argus | 10 | 0.064 | 0.004 |
| Trechus rivularis | 7 | 0.045 | 0.002 |
| Tipula limbata | 13 | ______ | ______ |
| ______ |
Simpson’s index of diversity () = ______
Working
Total individuals:
For Tipula limbata:
Sum of values from Table 2.2:
Simpson's index:
Answer
Simpson's index of diversity () = 0.730
D = 0.730
Background Concept
Simpson's index of diversity measures the probability that two individuals chosen at random from a sample belong to different species. It is calculated as
where is the number of individuals of one species and is the total number of individuals of all species. As approaches 1, biodiversity is high; as approaches 0, a single species dominates the sample.
Understanding the Question
Table 2.2 gives the species, the number of individuals () for seven of the eight invertebrate species, and the values of and for those seven species. The task is to fill in and for Tipula limbata, sum the column, and compute .
Approach
- Calculate by adding all the values.
- For Tipula limbata, compute to three decimal places, then square it to three decimal places.
- Add the new value to the existing column to obtain .
- Apply .
Step-by-Step Reasoning
- Total individuals:
- For Tipula limbata ():
- Sum of the column (with the new value for Tipula limbata):
- Simpson's index:
Key Takeaways
- Always find first; every other calculation depends on it.
- Round consistently to the precision of the table (three decimal places) so the sum and agree with the mark scheme.
- The dominant species (Eristalis cryptarum with 72/156 ≈ 46% of all individuals) is the largest single term in the sum (0.213); recognising which species dominates the community is a useful cross-check.
Common Mistakes
- Rounding 13/156 to 0.08 (two decimal places) and squaring to 0.006 instead of 0.083 → 0.007.
- Forgetting to square the Tipula limbata proportion before adding to the column.
- Subtracting the column total from the wrong value (e.g., writing instead of ).
Things to Be Careful About
- Three-decimal-place rounding throughout is consistent with the other values in the table and earns the mark.
- The final answer () has three decimal places to match the precision of the data.
- The mark scheme credits the Tipula limbata row, the column sum, and as three separate marks, so showing the working at each stage is essential.
The ecologists calculated a value of 0.710 for peat bog B.
Use your value of from (b)(ii) to compare the biodiversity of peat bog A and peat bog B.
Answer
Peat bog A has a slightly higher invertebrate biodiversity than peat bog B ( vs ).
Peat bog A has a slightly higher biodiversity than peat bog B (D = 0.730 vs 0.710).
Background Concept
Simpson's index of diversity () increases as a community becomes more diverse. Two sites with similar values have similar levels of biodiversity; a site with a higher has higher biodiversity. Because has no fixed upper bound in everyday interpretation (it approaches 1), the absolute size of the difference matters: small differences indicate only modestly different communities, while large differences indicate clearly different ones.
Understanding the Question
Part (b)(ii) calculated for peat bog A. The question states that for peat bog B. The task is to compare the invertebrate biodiversity of the two sites.
Approach
Compare the two values directly. The site with the higher is the more biodiverse.
Step-by-Step Reasoning
, so peat bog A has a higher invertebrate biodiversity than peat bog B. The difference is small (only 0.020), so the comparison should be qualified with "slightly".
Key Takeaways
- A direct comparison of values is enough to rank two sites in biodiversity.
- The size of the difference matters when drawing conclusions — 0.020 is a small difference, so the claim should be cautious.
Common Mistakes
- Saying "peat bog B has higher biodiversity" by misreading (which is false).
- Saying "the two sites have the same biodiversity" because the values look similar — they are not equal.
- Stating a large difference ("peat bog A is much more biodiverse") when the gap is only 0.020.
Things to Be Careful About
- The mark scheme credits either direction (A higher or B higher) provided it matches the correct numerical comparison.
- Always quote the two values in the comparison so the reader can verify the ranking.
- Note that the difference between the two invertebrate values (0.020) is much smaller than the difference between the two plant values (0.03), even though both have the same order of magnitude — they are simply different communities.