Biology 9700/43 — October/November 2024
Cambridge A-Level · A Level Structured Questions · worked solutions for every part, with the mark scheme
Topics Control and Coordination · Homeostasis · Inheritance · Classification, Biodiversity and Conservation · Energy and Respiration · Photosynthesis · +2 more
Different species of animal have neurones with different characteristics.
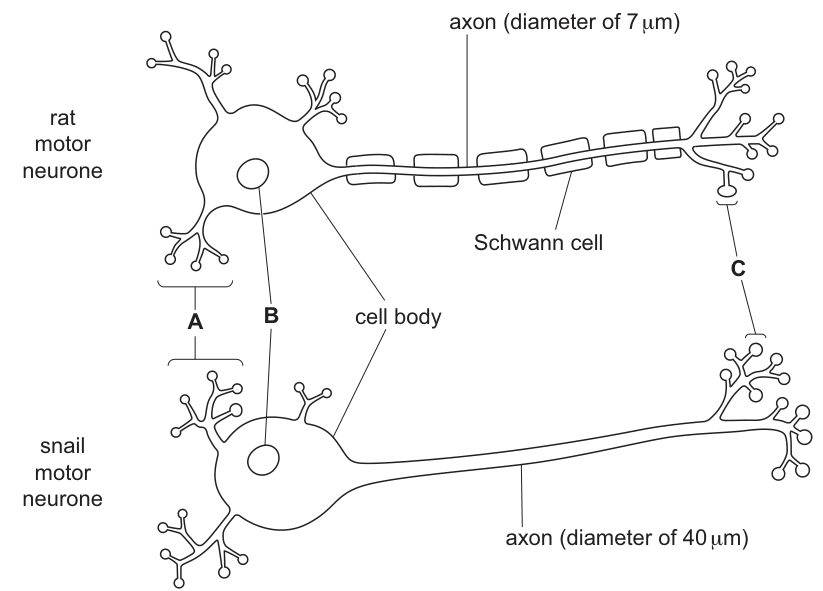
Fig. 1.1 is a diagram of a motor neurone of a rat and a motor neurone of a snail.
Answer
A = dendrites
B = nucleus
C = synaptic knob(s)
A = dendrite(s); B = nucleus; C = synaptic knob(s)
Background Concept
A motor neurone has a characteristic anatomy that reflects its function in carrying action potentials from the central nervous system to an effector (muscle or gland). The three regions most commonly labelled on a diagram of a motor neurone are:
- Dendrites — short, branched cytoplasmic extensions emerging from the cell body that receive impulses from other neurones.
- Cell body (perikaryon) — contains the nucleus, Nissl bodies (rough ER) and other organelles; it is the metabolic centre of the cell.
- Axon terminals / synaptic knobs — the fine, branched endings of the axon that release neurotransmitter into the synaptic cleft at a synapse or neuromuscular junction.
Understanding the Question
The question asks for the names of three labelled regions on Fig. 1.1, which shows a rat motor neurone. The labels A, B and C are clearly indicated on the diagram.
Approach
Read each label on the diagram and match it to the standard motor-neurone structure. The key is to use the precise CIE terminology expected by the mark scheme (e.g. "dendrite(s)", not "branch", and "synaptic knob(s)", not "end of axon").
Step-by-Step Reasoning
- A points to the branched projections at the left end of the cell body — these are the dendrites that receive input from other neurones.
- B points inside the cell body, where the large round organelle is — this is the nucleus.
- C points to the bulbous endings at the far right of the axon — these are the synaptic knobs (axon terminals) that release neurotransmitter onto the next cell.
Key Takeaways
- The three named parts each have distinct roles: dendrites (input), nucleus (control of cell activities), and synaptic knobs (output).
- The mark scheme requires the exact word "synaptic knob" (or "axon terminal"); "end of axon" or "terminal button" is not credited.
Common Mistakes
- Writing "cell body" for B instead of "nucleus" — B specifically points inside the soma to the nucleus, not the whole soma.
- Writing "end of axon" or "terminal" for C — CIE expects "synaptic knob(s)" or "axon terminal(s)".
- Confusing dendrites with the axon — dendrites are the short branched structures on the cell body, not the long fibre.
Things to Be Careful About
Use the plural form "dendrites" (or "dendrite(s)") because multiple branches are shown; the same applies to "synaptic knobs". Make sure not to write "dendron", which refers to the whole dendritic tree, not the individual branches.
The rat motor neurone has an impulse transmission speed of . The snail motor neurone has an impulse transmission speed of .
Explain why the rat motor neurone has a faster impulse transmission speed than the snail motor neurone.
Answer
- The rat motor neurone is myelinated (has a myelin sheath / Schwann cells).
- The action potential is propagated by saltatory conduction — it jumps from one node of Ranvier to the next, so depolarisation only occurs at the nodes and is much faster than continuous conduction along an unmyelinated axon.
Rat neurone is myelinated → action potential jumps between nodes of Ranvier (saltatory conduction), giving a faster conduction speed than the unmyelinated snail neurone.
Background Concept
In vertebrates, many axons are wrapped in a myelin sheath formed by Schwann cells (in the peripheral nervous system). Between adjacent Schwann cells are small unmyelinated gaps called nodes of Ranvier. Myelin is an electrical insulator, so voltage-gated Na⁺ channels are concentrated at the nodes. As a result, the action potential cannot be regenerated beneath the myelin; instead it "jumps" from node to node — this is called saltatory conduction (from the Latin saltare, "to leap").
Invertebrates such as snails generally have unmyelinated axons. Action potentials travel continuously along the whole length of the membrane. To compensate, invertebrates can have very large-diameter axons (the snail axon in Fig. 1.1 is 40 µm compared with the rat's 7 µm), because a larger diameter lowers the internal longitudinal resistance and speeds up passive (electrotonic) spread of the depolarisation between active regions.
Understanding the Question
The question gives the conduction speeds (50 m s⁻¹ for rat, 8 m s⁻¹ for snail) and asks for a biological explanation of the difference using Fig. 1.1. The figure shows that the rat axon is myelinated while the snail axon is unmyelinated.
Approach
The mark scheme allocates two marks:
- State the structural difference (myelin / Schwann cells on the rat axon).
- Explain the consequence — saltatory conduction, with the impulse jumping between nodes of Ranvier.
Both points must be present for full marks; stating "the rat is myelinated" alone is only one mark.
Step-by-Step Reasoning
- From Fig. 1.1, the rat motor neurone has Schwann cells wrapping the axon — it is a myelinated axon. The snail motor neurone has no myelin.
- In a myelinated axon, the myelin insulates the axolemma except at the nodes of Ranvier, where Na⁺ channels are densely packed.
- The action potential is regenerated only at the nodes; between nodes the depolarisation spreads passively (electrotonically) very quickly. The action potential therefore jumps from node to node (saltatory conduction), dramatically increasing the conduction velocity compared with continuous conduction in an unmyelinated axon.
Key Takeaways
- Myelination + saltatory conduction is the principal mechanism that allows vertebrates to conduct impulses at high speed without requiring very large axon diameters.
- The marks require BOTH the structural feature (myelin / Schwann cells) AND the mechanism (saltatory conduction / jumping between nodes).
Common Mistakes
- Stating only "the rat axon has myelin" without describing what this allows — you only earn the first mark.
- Writing "the impulse travels faster through myelin" — myelin is an insulator; the impulse does not travel through it, it jumps between the gaps.
- Confusing saltatory conduction with continuous conduction (the latter is what occurs in unmyelinated axons like the snail's).
Things to Be Careful About
- Acceptable wording per the mark scheme: "myelin sheath / Schwann cell / myelinated axon" for the structure, and "(impulse) jumps / leaps from (one) node of Ranvier to (the next / another)" for the mechanism.
- Note that a large axon diameter (snail = 40 µm, rat = 7 µm) also increases speed, but the mark scheme does not credit this for this question — the credited explanation concerns myelination and saltatory conduction.
Fig. 1.2 shows an action potential in a rat neurone and Fig. 1.3 shows an action potential in a snail neurone.
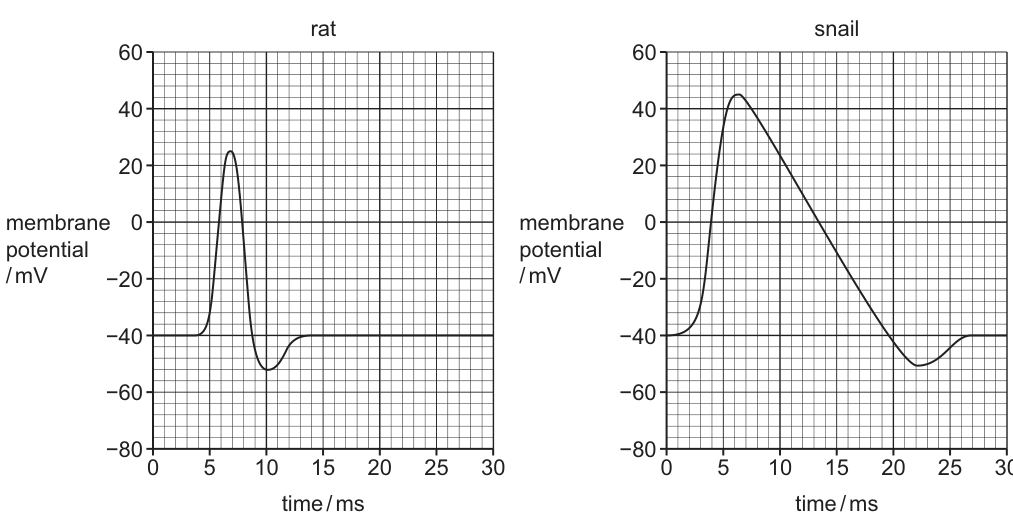
Contrast the two action potentials shown in Fig. 1.2 and Fig. 1.3.
Answer
Contrasts (snail Fig. 1.3 compared with rat Fig. 1.2):
- Greater depolarisation in the snail: the peak of the snail action potential reaches about +45 mV, whereas the rat only reaches about +25 mV (a difference of ~20 mV). The membrane potential of the snail therefore becomes more positive.
- Slower action potential in the snail: the snail action potential takes about 27 ms to return to resting potential, whereas the rat returns by about 13 ms — the snail action potential lasts roughly twice as long.
- Longer hyperpolarisation in the snail: the snail hyperpolarises to about −50 mV and stays below resting potential for several milliseconds, whereas the rat hyperpolarises only briefly to about −55 mV before quickly returning to resting potential.
- Longer refractory period in the snail (consequence of the longer action potential and longer hyperpolarisation).
Snail action potential has a higher peak (+45 mV vs +25 mV), a longer duration (returns to rest by ~27 ms vs ~13 ms), and a longer hyperpolarisation and refractory period than the rat action potential.
Background Concept
An action potential is a rapid, transient change in membrane potential that propagates along an axon. Its key phases are:
- Resting potential — typically about −70 mV (here the graphs start at about −40 mV, slightly depolarised).
- Depolarisation — voltage-gated Na⁺ channels open, Na⁺ flows in, the membrane potential rises to a positive value.
- Repolarisation — voltage-gated K⁺ channels open, K⁺ flows out, the membrane potential falls back towards the resting value.
- Hyperpolarisation — K⁺ channels are slow to close, so the membrane potential briefly becomes more negative than the resting potential.
- Return to resting potential — the Na⁺/K⁺ pump and ion channels restore the original ion distribution.
The refractory period is the time during which a second action potential cannot easily be triggered (absolute refractory: none; relative refractory: needs a larger-than-normal stimulus). Its duration is set largely by the length of the action potential itself.
Understanding the Question
The question shows two action potential traces (Fig. 1.2 = rat, Fig. 1.3 = snail) on the same axes and asks you to contrast them — i.e. to state the differences. The marks are awarded for differences attributable to the snail compared with the rat. Three marks are available, so up to three distinct contrasts are needed.
Reading from the graphs:
| Feature | Rat (Fig. 1.2) | Snail (Fig. 1.3) |
|---|---|---|
| Resting potential | ~−40 mV | ~−40 mV |
| Peak | ~+25 mV | ~+45 mV |
| Time of peak | ~7 ms | ~6 ms |
| Hyperpolarisation dip | ~−55 mV at ~10 ms | ~−50 mV at ~22 ms |
| Return to rest | ~13 ms | ~27 ms |
Approach
Read the graphs systematically — peak (amplitude), duration, hyperpolarisation depth/length — and convert each observation into a contrast statement that the mark scheme will credit. The mark scheme lists the snail's differences, so expressing the answer as "snail … whereas rat …" is safe.
Step-by-Step Reasoning
- Peak amplitude: the snail peak (
+45 mV) is markedly higher than the rat peak (+25 mV). → snail has greater depolarisation / a higher peak. - Duration of the action potential: the rat action potential is over by ~13 ms, the snail action potential is only just complete by ~27 ms. → snail action potential is slower / takes longer / takes more time.
- Hyperpolarisation: the rat dips to ~−55 mV briefly, whereas the snail dips only to ~−50 mV but stays below resting potential for many more milliseconds. → snail has a longer hyperpolarisation (and the dip is shallower but more prolonged).
- Refractory period: a longer action potential and longer hyperpolarisation imply a longer (absolute/relative) refractory period in the snail.
Key Takeaways
- "Contrast" questions require specific, paired statements (snail …, rat …), not vague generalities.
- Reading a graph carefully for both amplitude AND timing is essential — many candidates only comment on one of the two.
- The refractory period is linked to the duration of the action potential; mentioning it shows understanding of the physiology, not just graph-reading.
Common Mistakes
- Only describing the rat or only describing the snail — a contrast must compare both.
- Vague statements like "the snail is slower" without saying what is slower (action potential / repolarisation / return to resting potential).
- Saying "the snail has a smaller hyperpolarisation" because −50 mV is shallower than the rat's −55 mV — the mark scheme credits the longer hyperpolarisation, which is what the snail shows in time, not in depth.
- Forgetting units (mV and ms) — the mark scheme expects quantitative descriptions.
Things to Be Careful About
- The peak of an action potential is set by the Na⁺ equilibrium potential and the density of voltage-gated Na⁺ channels; the snail's higher peak suggests a larger Na⁺ influx per channel or denser channel packing.
- The longer duration in the snail is due to slower channel kinetics (K⁺ channels close more slowly) — this is also why the hyperpolarisation is more prolonged and the refractory period is longer.
- A "longer refractory period" limits the maximum frequency of impulses, which has functional consequences for how rapidly a snail neurone can fire.
The leaves of many plants have stomata that show a regular daily rhythm of opening and closing over a period of 24 hours.
Explain why it is important for plants to open and close their stomata in a daily rhythm.
Answer
- Stomata open during the day / in the light so that carbon dioxide can diffuse into the leaf for photosynthesis (the light-independent stage / Calvin cycle).
- Stomata close during the night / in the dark to reduce water loss by transpiration.
Stomata open in the day so CO2 enters for photosynthesis; close at night to reduce water loss by transpiration.
Background Concept
Stomata are small pores in the leaf epidermis, each bordered by two guard cells. They are the main route for gas exchange between the mesophyll of the leaf and the atmosphere, and they are also the main route by which water vapour leaves the plant (transpiration). This dual function sets up a fundamental trade-off: a plant must take in carbon dioxide for photosynthesis but cannot afford to lose excessive water.
A daily rhythm of stomatal opening and closing is the plant's solution to this trade-off. During daylight, when light energy is available to drive the light-dependent reactions of photosynthesis, the stomata open to allow entry. At night, when no light is available for photosynthesis anyway, the stomata close to conserve water.
Understanding the Question
The stem tells you that stomata show a regular 24-hour rhythm of opening and closing. Part (a) asks WHY this rhythm is important — what biological purpose does it serve? The command word is 'explain', which means you must give reasons, not just describe what happens. Three marks are available, so you need to make three clear, distinct points.
Approach
Think about what each phase (open vs closed) achieves, then link each to the specific biological process it serves. Day-opening → uptake → photosynthesis. Night-closing → reduced water loss → conservation. The whole rhythm is the resolution of the carbon-gain vs water-conservation conflict.
Step-by-Step Reasoning
- Stomata open in the day / in the light. This allows to diffuse into the leaf down its concentration gradient from the atmosphere to the moist cell walls of the mesophyll.
- The is required as the raw material for the light-independent stage of photosynthesis (the Calvin cycle), where it is fixed by the enzyme rubisco onto the five-carbon acceptor RuBP. Without the Calvin cycle cannot operate, regardless of how much light is present.
- Stomata close at night / in the dark. With no light, the light-dependent reactions cannot generate the ATP and reduced NADP needed by the Calvin cycle, so further uptake would not be used in photosynthesis.
- Closure also prevents water vapour inside the leaf from diffusing out into the drier atmosphere, reducing transpiration and helping the plant conserve water.
The daily rhythm therefore reconciles two conflicting demands: gaining carbon for photosynthesis while minimising dehydration of the plant.
Key Takeaways
- Stomatal opening is essential for the diffusion of into the leaf for photosynthesis.
- Stomatal closure is the main short-term control over water loss by transpiration.
- The daily rhythm reflects the fundamental trade-off between carbon gain and water conservation.
- Stomata can also close during the day under stress (e.g. drought, mediated by abscisic acid), but the regular daily rhythm matches the day/night cycle.
Common Mistakes
- Saying only 'gas exchange' without specifying what gas () or what for (photosynthesis, light-independent stage, or Calvin cycle). The mark scheme requires this link.
- Saying stomata close at night 'because there is no photosynthesis' without then explaining the benefit (reduces water loss by transpiration). Both halves of the linked pair are needed for full marks.
- Saying stomata close to 'stop photosynthesis' — this is wrong; closure removes the substrate (), it does not stop photosynthesis directly. Respiration continues regardless.
Things to Be Careful About
- Use precise terms: 'transpiration' (not 'evaporation'), 'Calvin cycle' or 'light-independent stage', 'carbon dioxide' (not 'air' or 'oxygen').
- Both day and night phases must be addressed; three marks cannot be earned by talking only about one phase.
- Three distinct points are needed; the day-opening and photosynthesis-link should be presented as separate marking points (the day-opening on its own does not earn a mark for photosynthesis).
Fig. 2.1 shows the results of an experiment to monitor this rhythm over three days and nights for the plant Arabidopsis thaliana. The percentage of open stomata is shown. Each day consisted of 14 hours of light (white bar) and each night consisted of 10 hours of darkness (black bar).
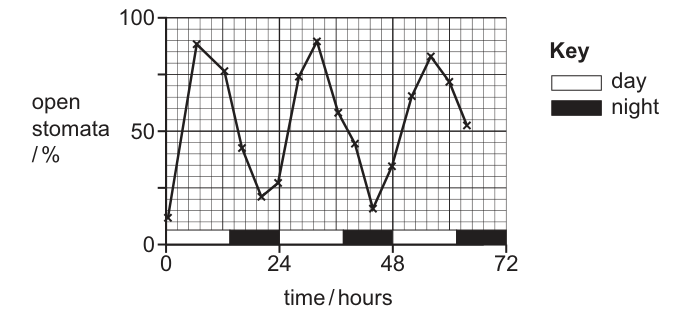
Fig. 2.1 shows that the percentage of open stomata increases in the first seven hours of the experiment. Describe the sequence of changes that occurs in the guard cells that leads to the stomata opening.
Answer
- Light activates a proton pump in the plasma membrane of the guard cell; hydrogen ions () are actively transported out of the cell, using energy from ATP, so the inside of the cell becomes more negative (and the concentration inside falls).
- Voltage-gated channel proteins open; ions move into the cell by facilitated diffusion, down their electrochemical gradient.
- ions also move into the guard cell.
- The accumulation of and inside the cell lowers the water potential of the guard cell.
- Water enters the guard cell by osmosis, down the water potential gradient.
- The guard cell becomes turgid / swells / increases in volume.
- The inner wall of the guard cell (bordering the pore) is thicker than the outer wall, so as the cell swells it cannot elongate uniformly — it bends / curves outward, pulling the two inner walls apart and opening the pore between them.
Proton pump uses ATP to export H+; K+ (and Cl-) enter; water potential falls; water enters by osmosis; guard cells swell; inner wall is thicker so cells curve outward, opening the pore.
Background Concept
Stomatal opening is a textbook example of how plants convert a metabolic signal (light) into a mechanical movement (pore opening). The mechanism uses a chemiosmotic principle familiar from ATP synthesis in mitochondria and the chloroplast: a proton pump uses energy (ATP) to pump across a membrane, creating an electrochemical gradient that drives secondary transport and ultimately water entry.
Guard cells have one defining structural feature: an asymmetric cell wall. The wall on the side facing the pore (the inner wall) is thicker and less elastic than the wall on the outside (the outer wall). When the guard cell swells, this asymmetry converts uniform turgor pressure into a curving motion that opens the pore.
Understanding the Question
Part (b) asks you to describe the SEQUENCE of changes in the guard cell that opens the stomatal pore. The question is in the context of the first seven hours of the experiment in Fig. 2.1, when the percentage of open stomata is increasing — i.e. during the day phase. You need to describe the opening mechanism, not the closing mechanism.
The command word is 'describe', but six marks across a multi-step mechanism means you must give a sequence with specific named events in the right causal order, not just an overview.
Approach
Work through the causal chain from trigger to outcome: Light → proton pump → leaves → membrane hyperpolarises → channels open → enters → enters → solute concentration up → water potential down → water enters by osmosis → cell becomes turgid → asymmetric wall bends the cell → pore opens.
Six marks are available; the mark scheme lists eight possible points. Cover the chain thoroughly so that any six of the eight points are clearly stated.
Step-by-Step Reasoning
Step 1 — Light activation of the proton pump.
When the guard cell receives light, a proton pump in its plasma membrane is activated. The pump uses metabolic energy (ATP from respiration) to actively transport hydrogen ions () out of the cell.
Step 2 — The inside becomes more negative.
The loss of positive charge from the cell makes the inside of the guard cell more negative relative to the outside (the membrane hyperpolarises). This creates an electrical gradient across the membrane.
Step 3 — channel proteins open.
The change in membrane potential opens voltage-gated potassium ion () channel proteins in the plasma membrane.
Step 4 — ions move in.
ions diffuse into the guard cell down their electrochemical gradient (the electrical gradient pulling positive ions in, plus the concentration gradient also pulling them in). This is FACILITATED DIFFUSION through the channel protein, NOT active transport.
Step 5 — ions also enter.
Anions such as chloride () move into the cell alongside , helping to balance the positive charge and maintain electroneutrality.
Step 6 — Water potential falls.
With and accumulating inside the guard cell, the solute concentration rises and the water potential () of the cell falls (becomes more negative).
Step 7 — Water enters by osmosis.
Water diffuses into the guard cell by osmosis, down the water potential gradient (from the higher outside the cell to the lower inside).
Step 8 — Cells swell and become turgid.
The water entry increases the volume of the guard cells, raising their turgor pressure.
Step 9 — The pore opens due to wall asymmetry.
Because the inner wall of each guard cell (the wall bordering the pore) is thicker and less elastic than the outer wall, the cells cannot expand uniformly. The thinner outer wall expands more readily, so the cell bows outward, pulling the two inner walls apart and opening the pore between them.
Key Takeaways
- Stomatal opening is driven by active proton pumping using ATP — this is the only energy-requiring step.
- entry is by FACILITATED DIFFUSION (down the electrochemical gradient), not active transport — the proton pump creates the gradient, but itself moves passively.
- The conversion of cell swelling to pore opening depends on the asymmetric thickening of the inner wall.
- Full mechanism: out → in → falls → water in → turgor → bow outward → pore opens.
Common Mistakes
- Saying is 'actively transported' into the cell. INCORRECT. The proton pump is the active step; moves by facilitated diffusion down the electrochemical gradient created by the pump.
- Forgetting ATP/energy requirement. The proton pump requires ATP from respiration.
- Saying 'water is actively absorbed'. Water enters by osmosis, never by active transport (no water pumps exist).
- Reversing which wall is thicker. The INNER wall (facing the pore) is thicker, not the outer wall. Getting this wrong undermines the entire mechanical explanation of pore opening.
- Saying the cells 'expand uniformly' or 'grow'. They swell, but asymmetrically; this asymmetry is the whole point of how turgor becomes pore opening.
- Treating as essential. The mark scheme accepts entry alone (with or without ) for the ion movement step, but mentioning as an additional contributor is fine.
Things to Be Careful About
- The order of events matters; the proton pump MUST come before entry.
- Use precise terms: 'proton pump' or ' actively transported out', 'facilitated diffusion', 'water potential', 'osmosis', 'turgid'.
- The mechanism is conceptually similar to chemiosmosis in mitochondria, but the outcome here is water entry and turgor-driven pore opening, not ATP synthesis.
- Don't confuse opening (blue light → in) with closing (ABA → → out).
The experiment was repeated with A. thaliana plants that were left in darkness from 14 to 96 hours. The results are shown in Fig. 2.2.
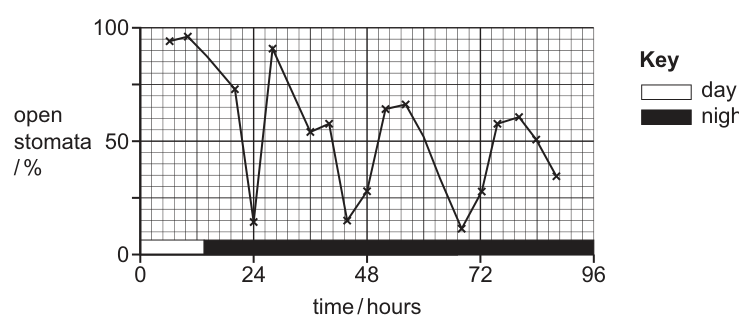
With reference to Fig. 2.1, explain what Fig. 2.2 shows about the role of genes and the role of the environment in controlling the rhythm of stomatal opening and closing in A. thaliana.
Answer
- In Fig. 2.2 the rhythm of stomatal opening and closing continues in continuous darkness, even though there is no light/dark cycle. This shows that genes control the basic 24-hour rhythm (an endogenous circadian rhythm).
- However, the peaks in Fig. 2.2 are lower than those in Fig. 2.1 and decrease further with each successive cycle. Light (the environment) is therefore needed to achieve the full peak percentage of stomatal opening seen under a normal day/night cycle.
Genes provide the basic 24-hour rhythm (it persists in darkness); light (the environment) is needed to maintain the full peak percentage of stomatal opening.
Background Concept
Many biological processes show circadian rhythms — approximately 24-hour cycles that persist even when external time cues are removed. Familiar examples include the sleep-wake cycle in humans, leaf movements in bean plants, and (here) the daily opening and closing of stomata.
The key question in studying any circadian rhythm is: what drives it — the environment (an external cycle of light and dark acting as a trigger) or an internal molecular clock (genes encoding oscillator proteins)? The answer is usually both: genes encode the basic oscillator, and environmental cues (called zeitgebers, 'time-givers') entrain the clock and amplify its output.
Understanding the Question
You are given two figures comparing two experimental conditions for Arabidopsis thaliana stomata:
- Fig. 2.1: Normal 14 h light / 10 h dark cycle. Peaks of stomatal opening reach ~85–90% during each day; troughs reach ~10–20% during each night.
- Fig. 2.2: 14 h of light, then continuous darkness for the rest of the experiment. Despite no light cue, the stomata continue to oscillate, but the peaks are lower (~60–70% initially) and decrease further over time.
Part (c) asks you to use these two figures to draw conclusions about the roles of GENES and the ENVIRONMENT in controlling the rhythm.
Approach
Look at what is the SAME and what is DIFFERENT between the two figures. The SAME thing (continued rhythmic oscillation) suggests genetic control. The DIFFERENT thing (lower peak amplitude in continuous darkness) suggests environmental modulation. Together they support a model in which genes provide the basic rhythm but the environment (light) is needed to achieve full expression.
Step-by-Step Reasoning
Observation 1: The rhythm continues in continuous darkness.
In Fig. 2.2 the regular ups and downs of stomatal opening continue, with a period of approximately 24 hours, even though there is no light/dark cycle to provide a timing cue. This means the plant must have an INTERNAL clock generating the rhythm — that clock is encoded by GENES. Genes therefore play a role in controlling the rhythm.
Observation 2: The peaks are lower without light.
Comparing Fig. 2.1 (normal day/night cycle) and Fig. 2.2 (continuous darkness), the percentage of open stomata at the peaks in Fig. 2.2 is lower than in Fig. 2.1, and the peaks decrease further with each successive cycle. Light (an environmental cue) is therefore required to achieve the FULL peak percentage of stomatal opening seen under normal conditions.
Conclusion: The basic 24-hour rhythm is genetically programmed (it persists in darkness), but light from the environment is needed to maintain the full amplitude of stomatal opening. The rhythm is a true circadian rhythm.
Key Takeaways
- Circadian rhythms are endogenous — generated by an internal genetic clock.
- Environmental cues (light/dark cycles) entrain and amplify circadian rhythms but do not initiate them.
- Removing the environmental cue (light) does not stop the rhythm, but its amplitude damps over time.
- This experimental design — keeping the organism in constant conditions and observing whether the rhythm persists — is the classic test for whether a rhythm is circadian (endogenous) or simply driven by the environment.
Common Mistakes
- Saying only 'genes control the rhythm' without pointing to the evidence in Fig. 2.2 — the persistent oscillation in continuous darkness.
- Saying only 'light controls the rhythm' — this ignores the fact that the rhythm continues without light.
- Confusing 'genes turn on at certain times' with the idea of a continuous molecular oscillator — the rhythm is generated by feedback loops in gene expression (e.g. the TOC1, CCA1 and LHY genes in Arabidopsis).
- Failing to compare the two figures specifically — the question says 'with reference to Fig. 2.1', so the comparison must be explicit.
Things to Be Careful About
- Both observations (the continued rhythm AND the lower peaks) must be made for full marks.
- The two marks are awarded separately: one for the role of light, one for the role of genes.
- Do not say 'the rhythm is controlled by genes ONLY' — the figure clearly shows the amplitude is reduced in darkness, indicating a role for the environment too.
- The technical term for an endogenous rhythm of approximately 24 hours is 'circadian' (from Latin circa + diem, 'about a day'). This is the classic answer to the question of whether such rhythms are genetic or environmental.
During aerobic respiration, cells respire substrates such as glucose to produce ATP.
Some events that occur during aerobic respiration are:
• The respiratory substrate breaks down into smaller and smaller molecules. These series of reactions are described as catabolism.
• Coenzymes take part in various reactions. In some reactions, coenzymes are reduced or oxidised.
• Carbon dioxide is released.
Aerobic respiration occurs in four successive stages: glycolysis (G), link reaction (LR), Krebs cycle (KC) and oxidative phosphorylation (OP).
Complete Table 3.1 to show which events occur in each stage of aerobic respiration. Use a tick (✓) to show that the event does occur or a cross (✗) to show that the event does not occur.
Table 3.1
| event | stage G | stage LR | stage KC | stage OP |
|---|---|---|---|---|
| catabolism | ||||
| coenzyme is reduced or oxidised | ||||
| a coenzyme forms a covalent bond with a respiratory intermediate | ||||
| carbon dioxide is released |
Answer
| event | G | LR | KC | OP |
|---|---|---|---|---|
| catabolism | ✓ | ✓ | ✓ | ✗ |
| coenzyme is reduced or oxidised | ✓ | ✓ | ✓ | ✓ |
| a coenzyme forms a covalent bond with a respiratory intermediate | ✗ | ✓ | ✗ | ✗ |
| carbon dioxide is released | ✗ | ✓ | ✓ | ✗ |
Table completed as shown in working.
Background Concept
Aerobic respiration occurs in four successive stages: glycolysis (G), link reaction (LR), Krebs cycle (KC) and oxidative phosphorylation (OP). The first three stages progressively break down the respiratory substrate into smaller and smaller molecules — this is catabolism. The fourth stage (oxidative phosphorylation) does not break the substrate down further; it uses the products of the earlier stages (the reduced coenzymes) to generate ATP.
In glycolysis, glucose (6C) is split into two molecules of pyruvate (3C). NAD⁺ is reduced to NADH. No carbon dioxide is released and no covalent bond is formed with a coenzyme.
In the link reaction, pyruvate enters the mitochondrial matrix and is decarboxylated (CO₂ is released) and dehydrogenated (NAD⁺ is reduced). The remaining 2-carbon acetyl group is then joined to coenzyme A by a covalent bond, forming acetyl coenzyme A. Coenzyme A is itself a coenzyme, and the bond it forms with the acetyl group is the covalent bond with a respiratory intermediate.
In the Krebs cycle, the acetyl group from acetyl coenzyme A is added to oxaloacetate (4C) to form citrate (6C). Over subsequent steps, the 6-carbon molecule is progressively decarboxylated (CO₂ released twice per acetyl group) and dehydrogenated (NAD⁺ and FAD reduced). The coenzymes here are reduced, but they do not form covalent bonds with intermediates within the cycle itself.
In oxidative phosphorylation, the reduced NAD and reduced FAD from the earlier stages donate their electrons to the electron transport chain in the inner mitochondrial membrane. As the electrons pass along the chain, the energy released pumps protons into the intermembrane space. The protons then flow back through ATP synthase, driving the synthesis of ATP. At the end of the chain, the electrons combine with oxygen and protons to form water. The coenzymes NADH and FADH₂ are oxidised back to NAD⁺ and FAD. No further catabolism occurs, and no CO₂ is released.
Understanding the Question
The question provides a partially completed table and asks the candidate to mark each of four events (catabolism, coenzyme reduction/oxidation, covalent bond formation between a coenzyme and a respiratory intermediate, and release of CO₂) with a tick (✓) or a cross (✗) in each of the four columns (G, LR, KC, OP). The candidate must decide for each of the 16 cells whether the event occurs in that stage.
Approach
For each event, work systematically through the four stages and recall what actually happens in each. The marks reward secure knowledge of where each event happens, and especially the unique features that distinguish the stages from one another.
Step-by-Step Reasoning
Row 1 — catabolism
- Glycolysis: glucose (6C) is broken down into two pyruvates (3C) — catabolism occurs. ✓
- Link reaction: pyruvate (3C) is broken down into an acetyl group (2C) and CO₂ — catabolism occurs. ✓
- Krebs cycle: the 2C acetyl group is fully oxidised to 2 CO₂ — catabolism occurs. ✓
- Oxidative phosphorylation: the substrate is no longer being broken down; instead, energy is harvested from reduced coenzymes and an electrochemical gradient is established. ✗
Row 2 — coenzyme is reduced or oxidised
- Glycolysis: NAD⁺ → NADH (reduction). ✓
- Link reaction: NAD⁺ → NADH (reduction). ✓
- Krebs cycle: NAD⁺ → NADH (×3 per acetyl group) and FAD → FADH₂ (reduction). ✓
- Oxidative phosphorylation: NADH → NAD⁺ and FADH₂ → FAD as their electrons pass to oxygen (oxidation). ✓
Row 3 — a coenzyme forms a covalent bond with a respiratory intermediate
- Glycolysis: although NAD⁺ is reduced, no covalent bond is formed between NAD⁺ and an intermediate. ✗
- Link reaction: coenzyme A forms a covalent bond with the acetyl group, producing acetyl coenzyme A. ✓
- Krebs cycle: coenzymes are reduced but they do not form covalent bonds with intermediates in the cycle. ✗
- Oxidative phosphorylation: no respiratory intermediate is involved in covalent bonding with a coenzyme. ✗
Row 4 — carbon dioxide is released
- Glycolysis: no decarboxylation occurs. ✗
- Link reaction: one CO₂ per pyruvate is released during decarboxylation. ✓
- Krebs cycle: two CO₂ per acetyl group are released (one at the isocitrate → α-ketoglutarate step and one at the α-ketoglutarate → succinyl-CoA step). ✓
- Oxidative phosphorylation: no CO₂ is produced. ✗
Key Takeaways
- Catabolism is a feature of the first three stages (G, LR, KC) only; oxidative phosphorylation is the energy-harvesting stage.
- Coenzymes are reduced in G, LR and KC and oxidised in OP — so redox activity occurs in all four stages.
- The link reaction is uniquely identified by the covalent bond between coenzyme A and the acetyl group.
- CO₂ release identifies the two decarboxylation stages (LR and KC).
Common Mistakes
- Putting a tick in the OP column for catabolism. The substrate is already fully broken down before oxidative phosphorylation, so further chemical breakdown does not occur.
- Putting a cross in the OP column for coenzyme redox. Although OP does not reduce coenzymes, it does oxidise them as the electrons are passed to oxygen.
- Ticking catabolism in OP because "energy is being released". Catabolism means a chemical breakdown into smaller molecules, not just energy release.
- Ticking the covalent-bond row for the Krebs cycle because "coenzyme A is involved". Coenzyme A is involved in the Krebs cycle (it carries the acetyl group in) but does not form a new covalent bond with an intermediate within the cycle itself.
- Ticking CO₂ release in glycolysis. Some textbooks mention the loss of a carbon-containing fragment when 6C glucose is split into two 3C sugars, but this is not a decarboxylation step and the cell does not release free CO₂ during glycolysis.
Things to Be Careful About
- The question uses the word "coenzyme" broadly. Coenzyme A is a coenzyme, so the link reaction event is a covalent bond between a coenzyme (CoA) and a respiratory intermediate (acetyl group).
- "Reduced or oxidised" covers both directions. OP must still be ticked for redox because coenzymes are oxidised there.
- The mark scheme uses ✓ and ✗ (not "yes" or "no") — write the symbols clearly.
- For each cell, write one symbol only; do not leave any cell blank.
A new hand-held technological device shows the main type of respiratory substrate being used in the cells of a person.
The device consists of a carbon dioxide sensor and air-flow meter. The person inhales through the device for a fixed time and then exhales into it.
The device calculates the respiratory quotient (RQ) value to show whether the cells are mainly respiring carbohydrates or lipids.
Explain how the device calculates the RQ value and how this shows whether the cells are mainly respiring carbohydrates or lipids.
Answer
- (RQ =) ;
- the air-flow meter measures the volume of O₂ inhaled (over the fixed time) ;
- the CO₂ sensor measures the volume of CO₂ exhaled (over the fixed time) ;
- for respiration of carbohydrate, RQ = 1 ;
- for respiration of lipid, RQ = 0.7 ;
- so a value close to 1 indicates mainly carbohydrate respiration, and a value close to 0.7 indicates mainly lipid respiration.
RQ = CO₂ exhaled / O₂ inhaled; carbohydrate RQ = 1, lipid RQ = 0.7.
Background Concept
The respiratory quotient (RQ) is the ratio of carbon dioxide produced to oxygen consumed during respiration. It is given by:
The RQ value depends on the type of substrate being respired because the substrates contain different proportions of carbon, hydrogen and oxygen, and the energy is released by oxidising them in different ways.
For carbohydrate (using glucose as an example, C₆H₁₂O₆), the equation is:
So 6 molecules of CO₂ are released for every 6 molecules of O₂ consumed, giving RQ = 6/6 = 1.0.
For a typical lipid (using the palmitic acid moiety of tripalmitin, C₅₁H₉₈O₆, as an example), the equation is approximately:
So 102 molecules of CO₂ are released for every 145 molecules of O₂ consumed, giving RQ = 102/145 ≈ 0.7.
The reason lipids have a lower RQ than carbohydrates is that they contain many more hydrogen atoms and far fewer oxygen atoms per carbon. The extra hydrogen atoms need to be oxidised by oxygen from the air, so proportionally more O₂ is consumed. The carbons that are oxidised are also more reduced to begin with, so the ratio of CO₂ released to O₂ consumed is lower.
Understanding the Question
A small hand-held device is described. It has two sensors: a carbon dioxide sensor and an air-flow meter. The person inhales through the device for a fixed time, then exhales into it. The question asks the candidate to:
- Explain how the device uses these two measurements to calculate RQ.
- Explain how the calculated RQ value allows the device to decide whether the person is respiring mainly carbohydrates or mainly lipids.
Approach
Begin with the formula for RQ. Then explain what each of the two sensors measures. Finally, state the characteristic RQ values for carbohydrate and lipid respiration and explain how the calculated value points to one substrate or the other.
Step-by-Step Reasoning
-
The RQ is defined as the volume of CO₂ produced divided by the volume of O₂ consumed. In this device the volumes are taken over the same fixed time interval, so the ratio of the two readings is the RQ.
-
The air-flow meter measures the volume (or rate) of air moving through the device. Because the person inhales through it, this gives the volume of O₂ inhaled (atmospheric air is ~21% O₂).
-
The CO₂ sensor measures the volume (or concentration) of CO₂ in the exhaled air, giving the volume of CO₂ exhaled over the fixed time.
-
The device then computes the ratio:
-
For respiration of carbohydrate the RQ = 1.0, because equal volumes of CO₂ and O₂ are exchanged.
-
For respiration of lipid the RQ = 0.7, because more O₂ is consumed than CO₂ is released.
-
Therefore an RQ close to 1 indicates mainly carbohydrate respiration, while an RQ close to 0.7 indicates mainly lipid respiration. A person on a mixed diet typically has an RQ around 0.85.
Key Takeaways
- RQ is the ratio CO₂ produced : O₂ consumed.
- Carbohydrate RQ = 1.0, lipid RQ = 0.7.
- The device uses the CO₂ sensor to measure CO₂ exhaled and the air-flow meter to measure O₂ inhaled, and then calculates the ratio.
- The numerical RQ value identifies the dominant substrate being respired.
Common Mistakes
- Writing the ratio the wrong way round (O₂ / CO₂ instead of CO₂ / O₂).
- Stating that the CO₂ sensor measures O₂, or the air-flow meter measures CO₂.
- Saying that "carbohydrate has a higher RQ than lipid" without giving actual numerical values.
- Forgetting to mention that the two measurements must be taken over the same fixed time so that they can be compared directly.
- Failing to make the link between the numerical RQ and the substrate identity.
Things to Be Careful About
- The RQ is dimensionless (it is a ratio), so no unit is needed in the answer.
- A typical mixed diet gives an intermediate RQ of about 0.85.
- The RQ of protein is about 0.9, but protein is rarely the main respiratory substrate in healthy people and the question only asks about carbohydrate and lipid.
- The question mentions the device has both a CO₂ sensor and an air-flow meter — both must be explained in the answer.
State the difference in the relative energy values of carbohydrates and lipids as respiratory substrates, and explain the reasons for the difference.
Answer
- Lipid has a higher energy value per gram than carbohydrate (lipid 37–40 kJ g⁻¹, carbohydrate 15–17 kJ g⁻¹) ;
- lipid molecules contain more hydrogen atoms / more C–H bonds per gram than carbohydrate molecules ;
- more C–H bonds per gram means more reduced NAD (and FAD) is produced during respiration of each gram of lipid ;
- more reduced coenzymes means more electrons pass along the electron transport chain, so a larger proton gradient forms across the inner mitochondrial membrane / more protons flow through ATP synthase ;
- therefore more ATP is made per gram of lipid than per gram of carbohydrate.
Lipid has a higher energy value per gram than carbohydrate (~39 kJ g⁻¹ vs ~16 kJ g⁻¹) because lipids contain more C–H bonds, which yield more reduced coenzymes, a larger proton gradient, and so more ATP per gram.
Background Concept
Different respiratory substrates release different amounts of energy per gram when they are fully oxidised. Approximate values are:
- Carbohydrate: 15–17 kJ g⁻¹ (often quoted as ~16 kJ g⁻¹)
- Lipid: 37–40 kJ g⁻¹ (often quoted as ~39 kJ g⁻¹)
- Protein: ~17 kJ g⁻¹
Lipids therefore have about twice the energy density of carbohydrates. The reason lies in molecular structure and in how that structure is exploited by the aerobic respiration pathway.
Lipid molecules (typically triglycerides built from long-chain fatty acids such as palmitic or stearic acid) consist mostly of long hydrocarbon chains — strings of CH₂ and terminal CH₃ groups. They are therefore very rich in C–H bonds and very poor in oxygen. Carbohydrate molecules (such as glucose, C₆H₁₂O₆) are already heavily oxidised; their carbons carry many OH groups and one of them is part of a C=O. The C–H bonds in glucose are far fewer per gram than in a typical lipid.
During aerobic respiration, the C–H bonds of the substrate are progressively broken (dehydrogenation). The hydrogens removed are taken up by the coenzymes NAD⁺ and FAD, reducing them to NADH and FADH₂. These reduced coenzymes then donate their electrons to the electron transport chain in the inner mitochondrial membrane. As the electrons flow from one carrier to the next, the energy released is used to pump protons (H⁺) from the matrix into the intermembrane space. The resulting electrochemical gradient (proton motive force) drives protons back into the matrix through ATP synthase, and this flow is coupled to the phosphorylation of ADP to ATP.
The more C–H bonds a substrate has per gram, the more reduced coenzymes are produced per gram, the larger the proton gradient that can be established, the more protons flow through ATP synthase, and the more ATP is made per gram.
Understanding the Question
The question asks for two things in a single answer:
- The difference in the relative energy values of carbohydrates and lipids as respiratory substrates (the "what").
- The reason for the difference (the "why").
The candidate must therefore state the numerical difference and then explain the chain of events from molecular structure through to ATP yield.
Approach
Begin with the energy values. Then identify the structural reason (more C–H bonds in lipids) and trace the biochemical consequences step by step: more C–H bonds → more reduced NAD/FAD → more electrons in the electron transport chain → larger proton gradient / more protons through ATP synthase → more ATP per gram.
Step-by-Step Reasoning
-
Lipid has a higher energy value per gram than carbohydrate. Typical values are 37–40 kJ g⁻¹ for lipid and 15–17 kJ g⁻¹ for carbohydrate, so a gram of lipid releases roughly twice as much energy as a gram of carbohydrate.
-
The reason is structural. Lipid molecules (long hydrocarbon chains) contain many more C–H bonds per gram than carbohydrate molecules. The C–H bond is the energy-rich bond that is broken during dehydrogenation in respiration.
-
During respiration, the hydrogens removed from these C–H bonds are accepted by the coenzymes NAD⁺ and FAD, producing more reduced NAD and more reduced FAD per gram of lipid than per gram of carbohydrate.
-
The reduced coenzymes donate their electrons to the electron transport chain. More electrons from more reduced coenzymes mean more electron flow along the chain.
-
The energy released by this electron flow pumps more protons into the intermembrane space, building a larger proton gradient / proton motive force across the inner mitochondrial membrane.
-
More protons then flow back into the matrix through ATP synthase per gram of lipid, driving the synthesis of more ATP per gram.
-
The net result is that lipid releases roughly twice as much energy per gram as carbohydrate, because the same gram of lipid contains more C–H bonds and therefore yields more reduced coenzymes, a larger proton gradient and more ATP.
Key Takeaways
- Lipid has a higher energy value per gram than carbohydrate (~39 vs ~16 kJ g⁻¹).
- The difference is due to lipid's higher C–H bond content per gram.
- More C–H bonds → more reduced NAD/FAD → larger proton gradient → more ATP per gram.
- The energy is released through the electron transport chain and chemiosmosis.
Common Mistakes
- Stating only "lipid has more energy" without giving numerical values or units.
- Saying "lipid has more bonds" without specifying C–H bonds, or saying "more hydrogen atoms" without linking these to the dehydrogenation reactions.
- Failing to link the structural difference to the biochemical outcome (reduced coenzymes, proton gradient, ATP).
- Saying "lipid has more energy because it is more reduced" — this is a circular argument unless the meaning of "more reduced" (more C–H bonds) is explained.
- Omitting ATP synthase, the inner mitochondrial membrane, or the proton gradient from the chain of reasoning.
Things to Be Careful About
- Use the units kJ g⁻¹ (not kcal g⁻¹) and quote both ranges (15–17 and 37–40) to match the mark scheme.
- The chain of reasoning must include all four steps: C–H bonds, reduced coenzymes, proton gradient, ATP. A single step will not earn all three marks.
- Energy value is conventionally expressed per gram in this context, not per mole.
- The mark scheme accepts either direction of statement — "lipid has higher energy" or "carbohydrate has lower energy".
The leaves of Mimosa pudica plants are made of a number of structures known as pinnae. The pinnae fold when the leaf is touched. This closes the leaf.
Fig. 4.1 shows an open leaf of M. pudica before it is touched. Fig. 4.2 shows the same leaf that has closed after being touched.
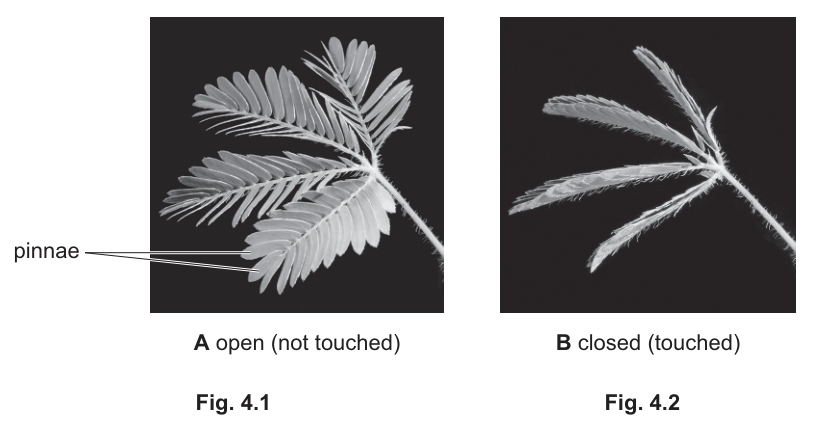
A touch stimulus to an M. pudica leaf causes an action potential to be generated.
The action potential results in changes in cells, which cause the leaf to close.
Fig. 4.3 shows the mechanism in M. pudica cells that causes the leaf to close.

The leaves of M. pudica and the leaves of Venus fly traps move in response to touch stimuli, but the mechanisms that cause the responses are different.
Describe the differences between the mechanism shown in Fig. 4.3 and the mechanism that causes the closure of the modified leaves in Venus fly traps.
Answer
Differences in the Venus fly trap (compared with the Fig. 4.3 mechanism in M. pudica):
- Two (sensory) hairs must be touched (rather than a single touch stimulus on a pinna).
- Protons leave the hinge cells (rather than being pumped into extensor cells).
- ions move into the hinge cells.
- Water moves into the hinge cells by osmosis (rather than out).
- The hinge cells become turgid / swell / increase in volume (rather than becoming flaccid), so the leaves close.
See working.
Background Concept
Many plant movements are caused by reversible changes in the turgor of specialised "motor" cells rather than by growth. A change in the solute concentration inside a motor cell alters its water potential, so water moves in or out by osmosis, and the cell either swells and becomes turgid or shrinks and becomes flaccid. Because the motor cells are attached to other, non-moving tissues, the swelling or shrinking of one side of the structure produces a bending movement. The Venus fly trap (Dionaea muscipula) and the sensitive plant (Mimosa pudica) both use this principle, but they do so with opposite ion fluxes and opposite turgor changes.
In M. pudica, Fig. 4.3 shows: touch → action potential → protons () pumped INTO extensor cells → and move out of the cells → water leaves by osmosis → cells become flaccid → the pinna folds up. So the moving side is on the lower surface of the pulvinus and the leaf closes because the lower side shrinks.
In the Venus fly trap, the trigger is more specific (the trigger hairs must be touched twice within about 20 s) and the movement is faster. In the outer (hinge) cells of the trap, an action potential causes protons to LEAVE the cytoplasm (i.e. the proton gradient runs in the opposite direction from Mimosa). ions then enter the cells through voltage-gated channels. The increase in intracellular solute lowers the water potential, water enters by osmosis, and the hinge cells rapidly swell. Because the outer wall of these cells can stretch more than the inner wall, the trap snaps from open to closed.
Understanding the Question
Part (a) gives you Fig. 4.3, the Mimosa mechanism, and asks you to describe how the Venus fly trap mechanism DIFFERS. The mark scheme rewards the contrasting features of the Venus fly trap, so a good answer lists the points on which the two mechanisms are NOT the same: the trigger, the direction of proton movement, the role of , the direction of water movement, and the resulting turgor change.
Approach
Read Fig. 4.3 carefully: action potential → protons INTO extensor cells → / OUT → water OUT → cells flaccid. Then think about the Venus fly trap and identify each step where the fly trap does the OPPOSITE or has an extra step (the influx and the double-touch requirement). Pick the most distinctive three differences and write them precisely.
Step-by-Step Reasoning
- Trigger — Venus fly trap requires two hairs to be touched (mechanically) within a short time window to fire an action potential; Mimosa responds to a single touch on a pinna.
- Proton movement — In the fly trap, protons LEAVE the hinge cells (or enter the cell wall), opposite to the flux shown in Fig. 4.3 where protons are pumped INTO the extensor cells.
- Calcium — Voltage-gated channels open in the fly trap so ions move INTO the hinge cells; this step is not present in Mimosa.
- Water — The fly trap's hinge cells GAIN water by osmosis; in Mimosa the extensor cells LOSE water.
- Turgor — Hinge cells become TURGID / swell / increase in volume; in Mimosa the extensor cells become FLACCID.
Key Takeaways
- Both responses are rapid, non-growth, turgor-driven movements, but the ionic events run in opposite directions in the two species.
- The Venus fly trap has the extra step that allows its very fast snapping closure.
- Identifying the direction of proton and water movement is the key contrast with the Mimosa mechanism.
Common Mistakes
- Saying "the fly trap's cells lose water and become flaccid" — this is the Mimosa mechanism, not the fly trap's. The directions are reversed.
- Leaving out the specific role of in the fly trap; the mark scheme credits this as a discrete point.
- Vague wording such as "ions move" without naming the ions or stating the direction of movement.
Things to Be Careful About
- Use the exact cell names: extensor cells for Mimosa; hinge cells for Venus fly trap.
- The mark scheme asks for DIFFERENCES, so phrasing each point as a contrast (e.g. "water moves into the cells rather than out") makes the comparison unambiguous.
- "Become turgid" is the precise term; "swell" or "increase in volume" are accepted alternatives, but "expand" alone is weaker.
The rate of photosynthesis decreases by 40% when the leaves of M. pudica close.
Explain why the rate of photosynthesis decreases when the leaves of M. pudica close.
Answer
- Less / decreased surface area of the leaf is exposed.
- Less light is absorbed by, chloroplasts / thylakoid membranes / grana / pigments / chlorophyll / light-harvesting complexes / photosystems.
- Fewer stomata are exposed / available to the air.
- Less carbon dioxide enters / is absorbed.
See working.
Background Concept
The rate of photosynthesis is limited by whichever factor is in shortest supply at the time — typically light intensity, carbon dioxide concentration, or temperature. Anything that reduces the leaf's ability to capture light or to take up from the atmosphere will therefore lower the photosynthetic rate. In M. pudica, the pinnae fold together when touched, dramatically changing the geometry of the leaf as a light- and gas-exchange surface.
Understanding the Question
You are told that the rate of photosynthesis falls by 40% when the leaves of M. pudica close. The command word is "explain", so each point must say not only WHAT is reduced but WHY that reduction matters for photosynthesis. The mark scheme accepts any two of the four creditable ideas.
Approach
Think about what closes: the pinnae fold, so the leaf presents less of its lamina to the sky and to the surrounding air. From this observation, two things must logically be reduced: the light intercepted (because the surface area exposed to the sun is smaller) and the that can reach the mesophyll (because the closed pinnae hide most of the stomata from the atmosphere). Pick the two most biologically important factors and state them in the order the mark scheme lists.
Step-by-Step Reasoning
- Surface area — When the pinnae fold, the area of leaf tissue exposed to sunlight is reduced. This is a physical change directly visible in Figs. 4.1 and 4.2.
- Light absorption — With less surface area presented, less light is intercepted by chlorophyll and the other pigments in the thylakoid membranes, so the light-dependent stage proceeds more slowly.
- Stomatal exposure — The stomata are mainly on the abaxial (lower) surface of the pinnae; once the pinnae press together, most stomata are no longer in contact with the external air.
- uptake — With stomata hidden from the air, the diffusion of into the leaf is reduced, so the light-independent stage (Calvin cycle) is limited by substrate. This is the most important reason for a 40% drop, because the Calvin cycle is usually the rate-limiting step under normal light.
Key Takeaways
- A change in leaf shape can simultaneously reduce two limiting factors at once — light and — making the response quantitatively large.
- "Less surface area" alone is too vague; the mark scheme wants the consequence for either light absorption or entry.
- The drop is not caused by any change in the photosynthetic machinery itself; it is purely a physical restriction of inputs.
Common Mistakes
- Stating only "less light" without saying that this is because the surface area exposed has decreased.
- Saying "less " without referencing the stomata.
- Confusing the cause (leaf closure) with the consequence (reduced photosynthesis) and giving circular explanations.
Things to Be Careful About
- "Fewer stomata exposed" is more precise than "stomata close" — the stomata themselves do not necessarily close; they are simply covered by adjacent pinnae.
- Mention the pigment or photosystem when discussing light, not just "the leaf"; the mark scheme wants "chlorophyll / thylakoid membranes / grana / pigments / light-harvesting complexes / photosystems" or AW.
- Two clear, distinct points are enough; do not pad with a third weak point such as "less water" (water is not a photosynthetic substrate).
Plants can carry out cyclic photophosphorylation and non-cyclic photophosphorylation during the light-dependent stage of photosynthesis. These processes occur at the grana of chloroplasts.
Outline the similarities and differences between cyclic photophosphorylation and non-cyclic photophosphorylation.
Answer
Similarities:
- Both involve photoactivation of chlorophyll.
- In both, (energetic) electrons pass along / down an electron transport chain (ETC).
- In both, ATP is produced by chemiosmosis (protons re-entering the thylakoid via ATP synthase).
- In both, ATP is the product.
Differences:
| Feature | Cyclic | Non-cyclic |
|---|---|---|
| Photosystems used | PSI only | PSI and PSII |
| Photolysis / produced | no | yes |
| Reduced NADP produced | no | yes |
| Fate of electrons | electrons return to the same photosystem / PSI | electrons end up on NADP (and are replaced from water) |
See working.
Background Concept
The light-dependent stage of photosynthesis happens in the thylakoid membranes and comes in two forms. Non-cyclic photophosphorylation uses both photosystems (PSII then PSI) in series, with electrons flowing from water (the original electron donor, after photolysis) through PSII, the cytochrome chain, PSI and finally on to NADP, producing and reduced NADP as by-products and ATP as the main product. Cyclic photophosphorylation uses only PSI; the electron lost from PSI's reaction centre is recycled back to PSI via the cytochrome chain. No is evolved and no reduced NADP is made, but the cycle generates extra ATP — useful when the Calvin cycle is short of ATP relative to NADPH.
Both pathways share the core machinery: a light-harvesting complex, a reaction-centre chlorophyll that is photoactivated, an electron transport chain, proton pumping into the thylakoid lumen, an electrochemical gradient, and ATP synthase operating by chemiosmosis.
Understanding the Question
Part (c) has two halves. First the "similarities": points that are true of BOTH cyclic and non-cyclic photophosphorylation. Then the "differences": the points on which they diverge. The mark scheme allocates 6 marks and lists four similarity points and four difference points, of which any six overall are creditable. To score full marks, a strong candidate should give roughly two well-chosen similarities and four well-chosen differences (or any six that cover both halves of the question).
Approach
Mentally picture the Z-scheme for non-cyclic and the loop for cyclic. Identify the steps that are present in BOTH (photoactivation, ETC, chemiosmosis, ATP synthesis) and the steps that are unique to non-cyclic (photolysis, production, reduced NADP formation, two photosystems, electrons leaving the chain to NADP). Write a tight comparison; a table is a clean way to present the differences without wasting words.
Step-by-Step Reasoning
Similarities
- Photoactivation of chlorophyll — In both pathways, light energy absorbed by the antenna complex excites an electron in the reaction-centre chlorophyll of the photosystem.
- Electron transport chain — In both, the (energised) electron passes along a series of carriers in the thylakoid membrane, releasing energy that is used to pump protons across the membrane.
- Chemiosmosis — In both, the resulting proton gradient drives protons back through ATP synthase, generating ATP from ADP + .
- ATP produced — Both pathways yield ATP, the central purpose of the light-dependent stage.
Differences
5. Photosystems used — Non-cyclic uses BOTH PSII and PSI; cyclic uses ONLY PSI.
6. Photolysis and — Photolysis of water (and hence release) occurs ONLY in non-cyclic, which is why the original source of the electrons is water; cyclic has no external electron donor, so no photolysis and no .
7. Reduced NADP — Reduced NADP is produced ONLY in non-cyclic (when the electron from PSI reduces NADP); cyclic does not reduce NADP.
8. Fate of the electrons — In non-cyclic, the electrons end up on NADP and must be replaced (from water); in cyclic, the electrons return to the same photosystem (PSI), and the cycle repeats.
Key Takeaways
- Cyclic photophosphorylation is essentially PSI running a loop to make extra ATP; non-cyclic is the linear Z-scheme that makes ATP, reduced NADP and .
- The similarities are the core "photo-electro-chemical" machinery: light, electrons, ETC, chemiosmosis, ATP.
- The differences are dictated by whether the electron leaves the chain (non-cyclic → NADP) or returns to its origin (cyclic).
- The ORA convention in the mark scheme means a correct reverse statement is also credited; the points are not directionally biased.
Common Mistakes
- Saying "non-cyclic produces more ATP" without explanation; both pathways produce ATP, and the difference is whether reduced NADP and are also produced.
- Forgetting to mention photolysis in non-cyclic — this is the source of the that we breathe.
- Stating that electrons "go back to chlorophyll" without specifying the same photosystem (PSI), which is the precise claim credited.
- Writing the similarities and differences as a single undifferentiated list and losing the structure of the comparison.
Things to Be Careful About
- The mark scheme uses the word "photoactivation" (not "photoexcitation"); either is accepted in standard usage, but stick with the textbook term.
- "ORA" (or reverse argument) in the mark scheme means a correct statement in the opposite direction is also credited, so "photolysis occurs in non-cyclic only" and "photolysis does not occur in cyclic" are both acceptable.
- The question is about the light-DEPENDENT stage, so do not bring in the Calvin cycle unless asked.
Lunularia cruciata is a primitive plant. Its body consists of a flattened sheet of photosynthetic tissue called a thallus.
Fig. 5.1 shows L. cruciata with two different types of reproductive structure, labelled A and B, on its surface.
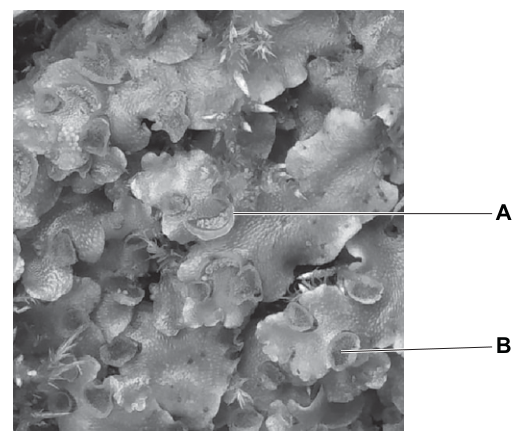
Structures A and B and the thallus of L. cruciata are haploid.
Explain what is meant by haploid.
Answer
A haploid nucleus/cell contains one (single) set of chromosomes, i.e. chromosomes, which is half the diploid number.
The chromosomes are not in homologous pairs — there is only one of each homologous pair — and so each chromosome differs from the others in size, shape and the genes (loci) it carries.
A haploid cell has one set of chromosomes (n), not arranged in homologous pairs; this is half the diploid number.
Background Concept
In sexually reproducing organisms, body (somatic) cells normally contain chromosomes in pairs — one member of each pair inherited from the mother, the other from the father. These pairs are called homologous pairs: the two chromosomes in a pair are the same size, carry the same genes at the same loci, and pair up during meiosis. A cell with this paired arrangement is diploid ().
A haploid cell contains only a single set of chromosomes — only one chromosome from each homologous pair. The haploid number is given the symbol . In animals, gametes are the only naturally haploid cells. In plants (and many algae and fungi) the situation is more complex because of alternation of generations: there is a multicellular haploid gametophyte generation and a multicellular diploid sporophyte generation, and meiosis occurs in the sporophyte to produce haploid spores.
- = haploid number
- = diploid number
- In a haploid set, the chromosomes are not in homologous pairs and each one is structurally and genetically distinct (different sizes, shapes, centromere positions, and genes/loci).
Understanding the Question
Part (a) tells you that the thallus of Lunularia cruciata and the reproductive structures A and B are haploid, and asks you to explain what haploid means. The command word is "explain", so a definition is required — but on a 2-mark question, you need to add a second qualifying point (e.g. about homologous pairs, or about the chromosome number) to earn both marks.
Approach
Recall the formal definition of haploid and add one further point — either that chromosomes are not in homologous pairs, or that the cell has half the diploid number of chromosomes. Either of these earns the second mark.
Step-by-Step Reasoning
- The simplest definition: a haploid cell has one (single) set of chromosomes. ✓ (mark 1)
- Reinforce with one further mark-worthy point: it has chromosomes, i.e. half the diploid number (). ✓ (mark 2 alternative)
- Other acceptable second points: chromosomes are not in homologous pairs / only one of each homologous pair is present; each chromosome is different in size, shape, gene loci.
Key Takeaways
- Haploid = one set of chromosomes (); diploid = two sets ().
- In a haploid cell the chromosomes are not paired homologously.
- Gametes are the classic example in animals; in plants the gametophyte generation is haploid.
Common Mistakes
- Writing only "it has half the chromosomes" without mentioning the set or the n symbol — "half" on its own is too vague.
- Saying haploid means "no chromosomes" (it means one set, not zero).
- Confusing haploid with haploid number: the haploid state refers to a cell having one set; the haploid number () is the count of chromosomes in that set.
Things to Be Careful About
On 2-mark "explain" questions, a one-line definition is rarely enough. Add a second supporting point (chromosome number, lack of homologues, or distinct chromosomes) to be safe.
Structure A contains pale discs of tissue, C, that can germinate into new L. cruciata. The new plants that develop from C are genetically identical to the parent plant in Fig. 5.1.
Structure B contains male sperm that are chemically attracted to swim to female eggs on a neighbouring parent plant. When the egg and sperm fuse, they form structure D. Structure D develops to produce spores that grow into new plants that are genetically different from the two parent plants.
Identify which of the structures A, B, C and D are:
associated with sexual reproduction ______
produced by mitosis ______
the site of meiosis ______
Each letter may be used once, more than once, or not at all.
Answer
- Associated with sexual reproduction: B and D
- Produced by mitosis: A and C (any two from A, B, C)
- Site of meiosis: D
Reasoning:
- A (gemma cup) and C (gemma discs) are part of the asexual reproductive cycle of the haploid gametophyte, so all the cells of A and C are produced by mitosis.
- B is the male reproductive structure producing sperm. Because the parent thallus is haploid, the sperm inside B are produced by mitosis (no meiosis is needed).
- D is the zygote, formed when a haploid sperm and a haploid egg fuse — so D is diploid. The diploid zygote is the structure in which meiosis occurs to produce haploid spores, hence D is the site of meiosis.
Sexual reproduction: B and D; produced by mitosis: A and C (any two from A, B, C); site of meiosis: D.
Background Concept
Lunularia cruciata is a liverwort (a bryophyte) and shows clear alternation of generations:
- The familiar flat green thallus is the gametophyte — it is haploid () and produces gametes.
- The gametophyte makes gametes (sperm in antheridia; eggs in archegonia) by mitosis, because the gametophyte is already haploid — meiosis is not required to halve the chromosome number when starting from a haploid cell.
- A sperm and an egg fuse to form a diploid zygote (). The zygote grows into the sporophyte, which remains attached to the gametophyte.
- Inside the sporophyte capsule, meiosis occurs to produce haploid spores. Each spore can germinate into a new gametophyte.
In addition, liverworts reproduce asexually using gemmae — small discs of haploid tissue inside crescent-shaped gemma cups on the thallus surface. When raindrops splash the gemmae out, each can grow into a new thallus that is genetically identical to the parent. All cells of a gemma and the gemma cup itself are produced by mitosis of the haploid gametophyte tissue.
Understanding the Question
You are given four labelled structures from L. cruciata and must assign each of three categories — sexual reproduction, mitosis, meiosis — to one or more of them. Each letter may be used once, more than once, or not at all, so a letter can sit in more than one category (e.g. B is associated with sexual reproduction and its sperm are produced by mitosis).
The structures in the question are:
- A = gemma cup (the crescent-shaped cup on the thallus)
- B = antheridium (the male reproductive structure producing sperm)
- C = gemmae (pale discs inside the gemma cup)
- D = zygote (formed by fusion of sperm and egg)
Approach
Work out, for each structure, two things: (1) is it part of the sexual or asexual cycle, and (2) is it haploid or diploid? Then ask: how was it formed (mitosis or meiosis) and where does meiosis happen?
Step-by-Step Reasoning
Sexual reproduction (B and D):
Sexual reproduction involves the fusion of male and female gametes. The male gametes (sperm) are made in structure B, and the product of sperm + egg fusion is the zygote D. Therefore B and D are both associated with sexual reproduction. A and C are part of asexual reproduction (vegetative propagation by gemmae) and so are not associated with sexual reproduction.
Produced by mitosis (any two of A, B, C):
Because the entire thallus is haploid ():
- The gemma cup (A) is a multicellular structure of the haploid gametophyte, so it was made by mitosis from existing thallus cells. ✓
- The antheridium (B) is also part of the haploid gametophyte, and the sperm it contains are produced by mitosis of haploid cells. ✓
- The gemmae (C) are clones of the parent, produced by mitosis inside the gemma cup. ✓
- The zygote D is formed by fertilisation (fusion of two gametes), not by mitosis.
Any two from A, B or C earn the mark. The most obviously correct pair is A and C (both clearly part of the asexual, vegetative pathway); B also works because sperm in a haploid organism are made by mitosis.
Site of meiosis (D):
The only diploid cell in the life cycle is the zygote D (and the sporophyte that grows from it). Meiosis must occur somewhere in the diploid phase to return the chromosome number to , producing haploid spores. Therefore D (the zygote / developing sporophyte) is the site where meiosis takes place. None of A, B or C is diploid, so meiosis cannot occur in any of them.
Key Takeaways
- In a haploid multicellular body, gametes are made by mitosis, not meiosis — meiosis is reserved for producing haploid spores from a diploid zygote/sporophyte.
- Asexual reproductive structures (gemmae, gemma cups) are clones produced by mitosis.
- The zygote is the only diploid stage in a bryophyte life cycle and is therefore where meiosis occurs.
- One structure can legitimately appear in more than one category (e.g. B is sexual and made by mitosis).
Common Mistakes
- Listing C as a site of meiosis because gemmae "grow into new plants". Gemmae are haploid and grow by mitosis; they are not the product of meiosis.
- Putting A under sexual reproduction. The gemma cup is purely asexual (vegetative propagation).
- Putting D under "produced by mitosis". The zygote is formed by fertilisation (gamete fusion), not by mitosis.
- Failing to recognise that, in a haploid organism, gametes are formed by mitosis, not meiosis.
Things to Be Careful About
The question allows each letter to be used more than once, so do not panic if a letter appears in two categories — that is intended. The key logical step is recognising that the thallus is haploid; everything derived from it by cell division (A, B, C and the sperm inside B) is the product of mitosis. Only D is diploid, and only D is the site of meiosis.
Fig. 5.2 shows a horse, Equus caballus. Horses are diploid animals that reproduce sexually. Male and female horses produce gametes, which fuse to form genetically different offspring.
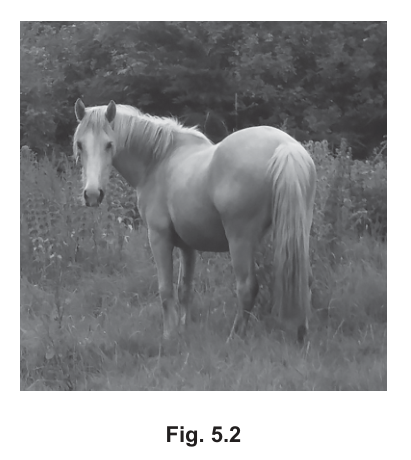
Explain the need for a reduction division during meiosis in the production of gametes in animals such as horses.
Answer
Meiosis halves the chromosome number, producing haploid gametes from a diploid parent. This is necessary for two main reasons:
- To maintain the (diploid) chromosome number from generation to generation. When two haploid gametes (one from each parent) fuse at fertilisation, the diploid number is restored. Without reduction division, every generation would receive double the chromosomes of its parents.
- To generate genetic variation in the gametes (and therefore in the offspring). Crossing over between non-sister chromatids of homologous chromosomes during prophase I, and the independent assortment of homologous pairs at metaphase I, shuffle alleles. Random fusion of gametes at fertilisation then adds further variation, so each offspring is genetically unique.
- If gametes were not reduced, the doubling of chromosome sets at fertilisation (polyploidy) would be lethal or would cause serious developmental abnormalities in the offspring.
Reduction division halves the chromosome number so the diploid number is maintained at fertilisation across generations, and it generates genetic variation in the gametes and offspring; without it, chromosome sets would double each generation and cause developmental problems.
Background Concept
Sexual reproduction in animals involves the fusion of two haploid gametes (a sperm and an egg) to form a diploid zygote. For this to work consistently, the gametes must carry half the chromosome number of the body (somatic) cells. Producing those gametes is the job of meiosis — a reduction division that takes a diploid cell () through one round of DNA replication followed by two divisions, giving four haploid () daughter cells.
Two important things happen during meiosis that are biologically significant:
- Reduction of chromosome number — homologous chromosomes are separated in meiosis I, so each daughter cell receives only one chromosome from each homologous pair.
- Generation of genetic variation — (i) crossing over between non-sister chromatids of homologous chromosomes during prophase I shuffles alleles between maternal and paternal chromatids, and (ii) the independent assortment of homologous chromosome pairs at metaphase I means that each gamete receives a different combination of maternal and paternal chromosomes. The random fusion of gametes at fertilisation adds a further layer of variation.
Understanding the Question
The question describes horses (Equus caballus) as diploid, sexually reproducing animals and asks you to explain the need for a reduction division during meiosis when producing their gametes. The mark scheme is "any three from" four possible points, so you need to give a clear, well-justified explanation rather than a single throwaway sentence.
Approach
Anchor your answer on the chromosome-number problem, then add the variation argument, and (if you have a third mark) mention the consequences of failing to reduce. Use precise terms: gametes, haploid, diploid, fertilisation, crossing over, independent assortment.
Step-by-Step Reasoning
Mark 1 — Maintaining chromosome number from generation to generation:
Gametes are made by meiosis, which halves the chromosome number, so each gamete is haploid. When two haploid gametes fuse at fertilisation, the resulting zygote (and the offspring that develops from it) is again diploid. This means the chromosome number of the species stays constant generation after generation. Without meiotic reduction, fertilisation would double the chromosome number each generation.
Mark 2 — Generating genetic variation in gametes (and therefore offspring):
Meiosis introduces variation in two ways. (i) Crossing over in prophase I exchanges segments between non-sister chromatids of homologous chromosomes, producing new combinations of alleles on each chromatid. (ii) Independent (random) assortment of homologous chromosome pairs at metaphase I produces different chromosome combinations in the gametes (where is the haploid number). Combined with the random fusion of gametes at fertilisation, this makes each offspring genetically unique — a major advantage in a changing environment and a substrate for natural selection.
Mark 3 (alternative) — Problems caused by extra sets of chromosomes:
If gametes were not reduced, fertilisation would add a complete extra set of chromosomes each generation (polyploidy). In mammals this is almost always lethal very early in development, and even small aneuploidies (e.g. an extra copy of chromosome 21 in humans) cause severe developmental disorders such as Down's syndrome. Hence reduction division is essential for normal, viable offspring.
Key Takeaways
- Meiosis halves the chromosome number, so fertilisation restores the diploid number and the species' chromosome complement is preserved from generation to generation.
- Meiosis is also the main source of genetic variation in sexually reproducing populations, via crossing over, independent assortment and random fertilisation.
- Without reduction division, chromosome sets would accumulate each generation; extra sets are usually incompatible with normal development.
Common Mistakes
- Saying meiosis "makes gametes" without mentioning the halving of the chromosome number — the reduction is the key point.
- Mentioning only variation and forgetting the chromosome-number argument (or vice versa).
- Confusing the sources of variation: crossing over, independent assortment and random fertilisation are the three; candidates often leave one out or muddle them.
- Saying meiosis "creates haploid cells" without explaining why the organism needs them to be haploid.
- Confusing the diploid number of the offspring with the haploid number of the gametes — and hence doubling chromosomes mentally each generation.
Things to Be Careful About
The command word is explain, not state. Each point must carry a reason, not just a fact: e.g. "meiosis halves the chromosome number so that fertilisation restores the diploid number and the chromosome complement stays constant from generation to generation". A list of bare facts rarely scores full marks on an "explain" question.
The mammalian kidney is responsible for:
• the excretion of urea
• osmoregulation (the homeostatic control of the water potential of the blood).
Answer
- Excess amino acids are deaminated (the amino group, , is removed).
- This occurs in the cells of the liver (hepatocytes).
Excess amino acids are deaminated in the liver to form urea.
Background Concept
Urea is the main nitrogenous excretory product in mammals. Proteins in the diet are digested into amino acids, but mammals cannot store excess amino acids. Any amino acid that is not needed for protein synthesis must be disposed of, and the first step in that disposal is deamination.
In deamination, the amino group () is removed from the amino acid. This occurs inside hepatocytes (liver cells) and produces ammonia (). Ammonia is highly toxic, so it is rapidly converted to urea via the ornithine (urea) cycle, also in the liver. The remaining keto acid can enter respiration to release energy, or be converted to carbohydrate or lipid.
The deamination reaction can be summarised as:
Urea is far less toxic than ammonia, so it can be transported safely in the blood to the kidneys for excretion.
Understanding the Question
This is a two-mark "outline" question, with command word demanding a brief description of how urea is made (the chemical process) and where in the body (the organ). The mark scheme separates these into two distinct ideas, so the answer should give both.
Approach
Recall the deamination reaction, name the substrate, and identify the organ. Two clear points cover both marks.
Step-by-Step Reasoning
- How is urea made? Amino acids (specifically the excess, those not required for protein synthesis) are deaminated, i.e. their amino group is removed. This is the first point on the mark scheme.
- Where does this occur? Deamination — and the subsequent conversion of the toxic ammonia to urea via the ornithine cycle — takes place in the liver. This is the second mark.
A complete answer therefore states both the process and the location.
Key Takeaways
- Urea is produced from the deamination of excess amino acids.
- Both deamination and the ornithine cycle occur in the liver.
- The non-nitrogenous remainder of the amino acid (keto acid) is respired or converted to carbohydrate/lipid.
Common Mistakes
- Saying "in the kidney" or "in the body" instead of "in the liver" — the mark scheme explicitly requires the liver.
- Saying "amino acids are converted to urea" without mentioning deamination or removal of the amino group — without that, the chemistry behind urea formation is missed.
- Confusing urea with uric acid (the nitrogenous waste of birds, reptiles and insects) or ammonia (the waste of bony fish and many aquatic invertebrates).
Things to Be Careful About
- "Outline" means a brief but specific description, not a single word.
- "Made" means synthesis, so the precursor (amino acids) and the chemical step (deamination) should both be clear.
- Don't confuse the liver's role in urea formation with its other roles (e.g. detoxification, bile production, glycogenesis).
Homeostatic control of the water potential of blood includes receptors, effectors and target cells.
Identify the names and locations of these components of homeostatic control in osmoregulation.
Answer
- Receptors: osmoreceptors in the hypothalamus of the brain.
- Effectors: the collecting duct (or distal convoluted tubule) of the nephron in the kidney.
- Target cells: the collecting duct cells (epithelial cells of the wall of the collecting duct), which respond to ADH.
Osmoreceptors in the hypothalamus; collecting duct as effector; collecting duct cells as target cells.
Background Concept
Osmoregulation is the homeostatic control of the water potential () of the blood. The system relies on the hormone antidiuretic hormone (ADH), which alters the permeability of the distal nephron to water so the kidney can either conserve water (when blood is falling) or excrete it (when blood is rising).
The homeostatic pathway has these components:
- Receptors detect the stimulus (a change in blood water potential).
- A co-ordination centre integrates the information.
- Effectors carry out the response (here, the kidney alters urine volume).
- Target cells for the chemical messenger (ADH) respond by changing their behaviour.
Understanding the Question
The question asks the candidate to name each of three components (receptors, effectors, target cells) of the homeostatic control of blood water potential and to identify the location of each. Three marks correspond to three named, located components.
Approach
Walk through the osmoregulation reflex arc and identify each component in turn. The trick is to keep "effector" and "target cell" distinct — the effector is the organ/tissue, the target cell is the cell within it that responds to the hormone.
Step-by-Step Reasoning
- Receptors: specialised osmoreceptors sit in the wall of the hypothalamus. They swell or shrink as blood changes, generating nerve impulses. (1 mark)
- Effector: the kidney is the effector organ. More precisely, the mark scheme allows collecting duct or distal convoluted tubule or nephron as the effector structure. ADH released from the posterior pituitary alters the permeability of these tubules. (1 mark)
- Target cells: the cells of the collecting duct wall are the targets for ADH. When ADH binds to receptors on their basolateral membrane, they insert aquaporins into their apical membrane, increasing water reabsorption. (1 mark)
Key Takeaways
- Osmoregulation uses a hormonal reflex with the hypothalamus as both receptor site and co-ordination centre.
- The effector is the kidney (specifically the collecting duct and DCT).
- The target cells for ADH are the collecting-duct epithelial cells, which change their water permeability via aquaporin insertion.
- This pathway operates by negative feedback: a fall in blood triggers water retention, which raises blood back to the norm.
Common Mistakes
- Writing "the kidney" without specifying the nephron/collecting duct/DCT — the mark scheme wants the precise structure.
- Confusing the effector with the target cell: the effector is the organ, the target cell is the cell within it that responds to the hormone.
- Placing the receptors in the "pituitary" or "medulla" — they are in the hypothalamus.
- Omitting ADH or forgetting that aquaporins are inserted into the collecting duct apical membrane in response to ADH.
Things to Be Careful About
- The hypothalamus contains the osmoreceptors and synthesises ADH (which is stored in the posterior pituitary). Many candidates mix the two up.
- "Target cell" terminology is precise: it refers to the cell with the receptor for the specific signal molecule (ADH in this case).
The glomerulus and Bowman’s capsule of the nephron are important in the formation of urine.
Outline the role of the glomerulus and Bowman’s capsule in the formation of urine.
Answer
- The glomerulus and Bowman's capsule carry out ultrafiltration, producing glomerular filtrate.
- Filtration is driven by the high hydrostatic (blood) pressure inside the glomerular capillaries.
- This pressure forces water and small solutes (e.g. urea, glucose, ions) out of the glomerulus and into the Bowman's capsule.
- Movement occurs through the three-layered filtration barrier: fenestrae in the capillary endothelium, the basement membrane, and slit pores / filtration slits between the podocytes of the Bowman's capsule.
Ultrafiltration: high blood pressure in the glomerulus forces water and small solutes through the fenestrated capillary endothelium, basement membrane and podocyte slit pores into Bowman's capsule to form glomerular filtrate.
Background Concept
Urine formation begins at the renal corpuscle — a glomerulus (a knot of fenestrated capillaries) sitting inside a Bowman's capsule (the cup-like blind end of the nephron). Together they carry out the first step of urine production: ultrafiltration.
Ultrafiltration is a pressure-driven process in which the blood is filtered under high hydrostatic pressure. The filtrate that enters the Bowman's capsule contains everything small enough to pass through the filtration barrier — water, glucose, urea, salts, amino acids, and small plasma proteins. Blood cells and large plasma proteins are retained in the blood.
The filtration barrier has three layers:
- Fenestrations (pores) in the endothelial cells of the glomerular capillaries.
- The basement membrane — a fused, negatively-charged layer that repels anionic plasma proteins.
- Filtration slits between the foot processes (pedicels) of the podocytes that wrap the capillaries.
Understanding the Question
The candidate is asked to outline the role of two named structures — the glomerulus and Bowman's capsule — in urine formation. Three marks are available, so the answer should cover the process (ultrafiltration), the driving force (high blood pressure), the direction of movement, and ideally the filtration barrier.
Approach
Describe the process as a chain: pressure source → movement → filter. Make sure to identify the structures (fenestrae, basement membrane, podocyte slit pores) by name because the mark scheme credits them.
Step-by-Step Reasoning
- What happens: ultrafiltration occurs, producing glomerular filtrate in the Bowman's capsule. (1 mark)
- Why it happens: the high hydrostatic (blood) pressure in the glomerular capillaries — much higher than in other capillary beds because the efferent arteriole is narrower than the afferent arteriole. (1 mark)
- What moves: this pressure forces water and small solutes (urea, glucose, salts, amino acids) out of the capillaries and into the Bowman's capsule. (1 mark)
- What it moves through: the fenestrae of the endothelium, the basement membrane and the slit pores / filtration slits between podocytes. The mark scheme credits any two of these three structures.
Key Takeaways
- The glomerulus and Bowman's capsule together form the renal corpuscle, the site of ultrafiltration.
- High hydrostatic pressure in the glomerulus is the driving force.
- The three-layered filtration barrier is a size- and charge-selective filter.
- Filtration produces glomerular filtrate, which is then modified (by selective reabsorption and secretion) as it passes through the rest of the nephron to become urine.
Common Mistakes
- Saying that ultrafiltration is driven by "osmosis" or "diffusion" — it is pressure-driven.
- Forgetting to name the barrier structures (fenestrae, basement membrane, slit pores) — the mark scheme explicitly credits these.
- Confusing the Bowman's capsule with the loop of Henle, distal convoluted tubule, or bladder — these have very different roles.
- Stating that "blood is filtered" without specifying what is filtered (small solutes and water) and what is retained (blood cells and large proteins).
Things to Be Careful About
- Ultrafiltration is non-selective with respect to small molecules; selectivity only comes later via reabsorption in the proximal tubule.
- The basement membrane is not just a passive sieve — its negative charge repels anionic plasma proteins, contributing to the selectivity of the barrier.
- Filtration involves movement from the blood into Bowman's capsule; candidates sometimes write the direction backwards.
Concentrated urine contains a high concentration of solutes and a small volume of water. Different species of mammals vary in their ability to produce urine with a high solute concentration.
Table 6.1 compares the ratio of the solute concentration of urine (U) to the solute concentration of blood plasma (P) in some mammal species. The habitats of the mammal species are also shown.
Table 6.1
| mammal species | maximum ratio of solute concentration of urine to solute concentration of blood plasma (U:P) | habitat |
|---|---|---|
| beaver | 1.7:1 | rivers and lakes |
| human | 4.5:1 | variable |
| camel | 8.0:1 | desert |
| rat | 9.0:1 | variable |
| kangaroo rat | 16.0:1 | desert |
With reference to Table 6.1, suggest what the different values of U:P show about the ability of these mammal species to tolerate a shortage of water in their environment.
Answer
- A higher U:P ratio means a mammal can tolerate a greater shortage of water in its environment.
- This is because a higher ratio means the kidney can reabsorb much more water from the filtrate, producing a small volume of highly concentrated urine (so less water is lost in excretion).
- Therefore species with a high U:P ratio (e.g. kangaroo rat, 16.0:1) are well adapted to dry (desert) environments, while species with a low ratio (e.g. beaver, 1.7:1) cannot tolerate water shortage and need an environment with plentiful water (e.g. rivers and lakes).
Higher U:P ratios indicate a greater ability to reabsorb water and produce concentrated urine, so species with higher ratios (e.g. kangaroo rat) are better able to tolerate water shortage than those with low ratios (e.g. beaver).
Background Concept
The maximum U:P ratio is the ratio of the maximum solute concentration of urine to the solute concentration of blood plasma. It is a measure of how much the kidney can concentrate the filtrate — i.e. how much water it can reabsorb back into the blood while leaving solutes behind in the urine.
- A U:P of 1.0 means the urine has the same solute concentration as plasma; the kidney has done no net concentration work.
- A U:P of 16.0 means the urine is 16 times more concentrated than plasma — only species with very long loops of Henle and powerful countercurrent multipliers can do this.
The higher the U:P, the more water is conserved (less water lost as urine), and the better the animal is suited to environments where drinking water is scarce.
Understanding the Question
This is a "suggest" question (3 marks) using the data in Table 6.1 to draw a conclusion about the ecological and physiological meaning of the U:P ratio. The candidate must:
- read the trend across the table,
- link the ratio to a physiological process (water reabsorption/concentration of urine),
- connect the physiology to the habitat shown for each species.
The mark scheme accepts any three of: (1) higher ratio = tolerates water shortage, (2) higher ratio = more water reabsorbed / smaller urine volume, (3) higher ratio = better adapted to dry environment / can concentrate urine.
Approach
Quote specific ratios from the table to anchor the argument, then generalise the principle. End by linking the data to the habitats shown.
Step-by-Step Reasoning
- Direction of the trend: the higher the U:P ratio, the more water the kidney can reabsorb. Look at the extremes:
- beaver, U:P = 1.7, lives in rivers and lakes (water-rich).
- human, U:P = 4.5, lives in variable habitats.
- camel and kangaroo rat, U:P = 8.0 and 16.0, live in deserts (water-poor).
- Mechanism: a high U:P means the kidney is producing a small volume of highly concentrated urine; in other words, much water has been reabsorbed back into the blood. (Mark scheme point 2)
- Ecological consequence: this water-saving ability lets the animal tolerate habitats with little or no drinking water. The kangaroo rat can survive in the desert without ever drinking because its kidneys can produce very concentrated urine and minimise water loss. (Mark scheme points 1 and 3)
- Synthesis: therefore, U:P is a measure of the degree of adaptation to water shortage — low U:P = poorly adapted (beaver); high U:P = well adapted (kangaroo rat).
Key Takeaways
- U:P ratio is a measure of how much a kidney can concentrate urine.
- A high U:P ratio allows more water to be reabsorbed, so less is lost in urine.
- Mammals from water-poor (desert) habitats have higher U:P ratios than those from water-rich habitats — clear evidence of adaptation by natural selection.
- The kangaroo rat is the most specialised example: it can survive on metabolic water alone.
Common Mistakes
- Saying that "desert animals have a high U:P ratio" without explaining why (i.e. the kidney reabsorbs more water / produces more concentrated urine, conserving water).
- Stating that "the kangaroo rat can survive without water" without linking this back to its U:P ratio and the mechanism of water reabsorption.
- Confusing U:P with total urine volume — U:P is a ratio of concentrations, not volumes; a high U:P does not necessarily mean a low absolute volume, only that the urine is more concentrated than the plasma.
- Reading the data in the wrong direction (claiming a high U:P means the animal cannot tolerate drought).
Things to Be Careful About
- "Suggest" questions require candidates to go beyond what is stated in the table and link data to underlying principles. A bare description of the data without an interpretation scores poorly.
- Use comparative language: "higher than", "lower than", "the higher the ratio, the more water is conserved". Avoid absolute statements that ignore the trend.
- The data show that habitat correlates with U:P, but the mark scheme's credit is on the principle linking ratio → water reabsorption → tolerance of water shortage. Anchor the answer in that causal chain.
Spea multiplicata is one of several species of American spadefoot toad.
Young spadefoot toads are called tadpoles and live in water in ponds.
S. multiplicata tadpoles show three different phenotypes due to genetic variation. The three phenotypes are: detritus feeder, intermediate and carnivore.
Detritus feeders are small, and carnivores are large. Intermediates vary in size between the two extremes.
A detritus feeder and a carnivore are shown in Fig. 7.1.
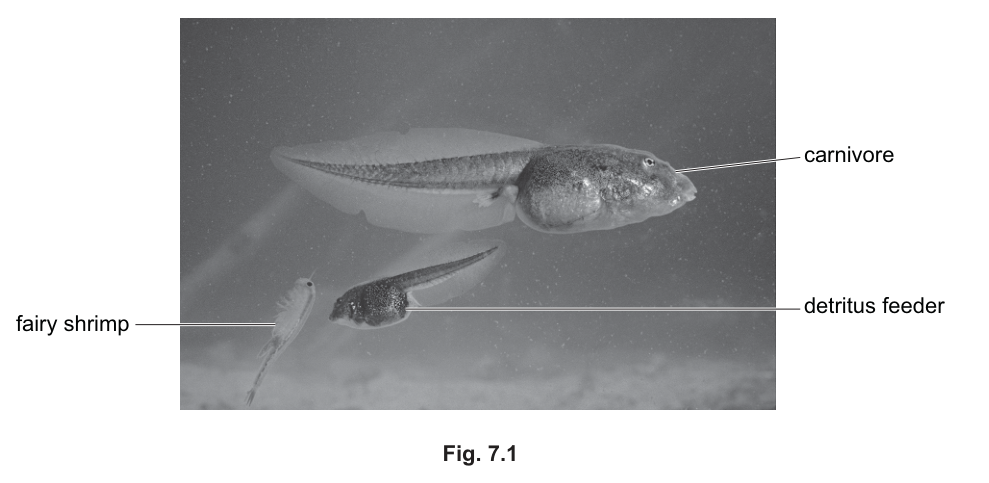
Detritus feeders:
• eat detritus (small pieces of dead organic matter) and algae (photosynthetic protoctists)
• have smooth mouthparts, small jaw muscles and long intestines.
Intermediates:
• can eat all available food (detritus, algae and fairy shrimps)
• have teeth-like mouthparts, medium-sized jaw muscles and medium-sized intestines.
Carnivores:
• eat fairy shrimps and other small animals
• have teeth-like mouthparts, large jaw muscles and short intestines.
Scientists counted the number of each type of tadpole in two different ponds: pond 1 and pond 2.
In pond 1, the scientists observed:
• a high density of tadpoles
• a low abundance of food
• that most of the tadpoles they counted were either detritus feeders or carnivores, with very few intermediates present.
Describe and suggest explanations for the type of natural selection that appears to be acting in pond 1.
Answer
- Disruptive / diversifying (selection).
- Carnivores and detritus feeders (the two extreme phenotypes) survive / are selected for, while intermediates are selected against / die.
- High / intense, competition (because tadpole density is high and food is limited).
- Lack / limited availability of food is the selection pressure.
- Intermediates are outcompeted for, detritus / algae (and) for (fairy) shrimps / small animals, so cannot obtain enough of either food source.
See answer — disruptive selection with intermediates selected against due to competition for limited food.
Background Concept
Natural selection acts on heritable phenotypic variation within a population. The fitness of each phenotype depends on how well it is adapted to the prevailing environmental conditions. When two (or more) extreme phenotypes each have a selective advantage over the average phenotype, the extremes are favoured and the mean of the trait shifts towards a bimodal distribution. This pattern is called disruptive (or diversifying) selection. Classic textbook examples include Darwin's finches with large or small beaks specialising on different seed sizes.
Selection requires three ingredients: heritable variation, a selection pressure (e.g. limited food, predation, disease), and differential survival/reproduction so that some phenotypes contribute more alleles to the next generation.
Understanding the Question
Pond 1 contains a high density of tadpoles but only a low abundance of food. Two extreme phenotypes (detritus feeders with long intestines for digesting algae/detritus, and carnivores with short intestines and powerful jaws for catching shrimps) dominate, while the intermediate phenotype is rare. We are asked to (a) describe the type of selection and (b) explain why it is occurring in this pond.
Approach
Identify the selection pattern from the phenotype distribution (extremes common, intermediates rare) — this is the signature of disruptive selection. Then connect the cause to the ecological data: limited food combined with high population density creates intense intraspecific competition, and the intermediates — which need both algae/detritus and shrimps — cannot reliably obtain enough of either when food is scarce, so they starve or grow poorly.
Step-by-Step Reasoning
- The observed distribution (lots of carnivores AND lots of detritus feeders, few intermediates) is the hallmark of disruptive selection, where the two extremes are favoured.
- The selection pressure is the limited food supply. With many tadpoles competing for too little food, only those that are well adapted to obtain one particular food type thrive.
- Carnivores have the jaw structure and short gut to capture and digest shrimps efficiently; detritus feeders have the long intestine and mouthparts to process large volumes of low-quality plant/detrital food. Both are specialised for one niche.
- Intermediates have neither extreme specialisation — they cannot compete with carnivores for shrimps (smaller jaws) or with detritus feeders for algae (shorter intestine). In conditions of food scarcity they get too little of either food, grow slowly, and are selected against.
- Over generations the alleles underlying the intermediate phenotype decrease in frequency and the population becomes more bimodal.
Key Takeaways
- A bimodal phenotype distribution under conditions of resource scarcity is the signature of disruptive selection.
- Specialised phenotypes each exploit a different niche; generalist intermediates are penalised when resources are limited.
- The selection pressure must be specified (here: limited food) — selection does not act without one.
Common Mistakes
- Naming the wrong type of selection (e.g. directional) because candidates only think about one extreme.
- Stating only that "extremes survive" without giving the mechanism (food limitation + competition).
- Saying that intermediates "do not eat" — they do, but cannot get enough of any one food under competition.
Things to Be Careful About
- The mark scheme requires BOTH the descriptive point (selection type + which phenotypes survive/die) AND the explanatory point (why — competition and food as selection pressure).
- "Survival of the fittest" on its own is not credit-worthy; specify WHY each phenotype is fitter here.
In pond 2, the scientists observed:
• a low density of tadpoles
• sufficient food availability for all tadpoles
• that most of the tadpoles they counted were intermediates, with fewer detritus feeders or carnivores.
Describe and suggest explanations for the type of natural selection that appears to be acting in pond 2.
Answer
- Stabilising (selection).
- Carnivores and detritus feeders (the extremes) are selected against / die, while intermediates survive / are selected for.
- Low / less, competition (because tadpole density is low and food is sufficient).
- Intermediates can eat, both types / a wider range / all, of food (detritus, algae and fairy shrimps).
- A greater variety in the diet improves the growth and development of (intermediate) tadpoles.
See answer — stabilising selection with intermediates favoured due to low competition and a wider diet.
Background Concept
Stabilising selection favours the intermediate (mean) phenotype and selects against both extremes. It is the most common form of selection in stable environments where the mean phenotype is already well adapted. Human birth weight is the classic example — both very small and very large babies historically had lower survival. The result is a narrowing of the phenotypic distribution around the mean.
Understanding the Question
In pond 2 the tadpole density is low and food is sufficient. Most tadpoles are intermediates, with few extreme detritus feeders or carnivores. The task is to identify the selection type and explain why intermediates are favoured here.
Approach
A distribution dominated by intermediates, with the extremes removed, is stabilising selection. The reasoning must be reversed from part (i): because food is plentiful and there are few competitors, each tadpole can obtain whatever food it needs. The generalist intermediate phenotype — able to eat algae, detritus and shrimps — gains a dietary flexibility advantage, while the specialised extremes lose their niche advantage and may even be disadvantaged (e.g. carnivores have shorter intestines and cannot digest detritus efficiently).
Step-by-Step Reasoning
- The phenotype distribution (intermediates common, extremes rare) is the signature of stabilising selection.
- With low population density, intraspecific competition is low; each tadpole can obtain enough food regardless of its specialisation, so the harsh competitive filter of part (i) is removed.
- Intermediates are generalists: they can eat detritus AND algae AND fairy shrimps. This dietary breadth means they always have an available food source, and the mix of foods supports better growth and development than either specialised diet.
- Detritus feeders have long intestines adapted to processing large volumes of low-quality plant material — in pond 2 they do not need this and the long intestine may even be a cost (slower growth, higher metabolic demand for gut tissue).
- Carnivores have short intestines and large jaw muscles — without enough shrimps to catch, or with shrimps available alongside other food, the specialisation is wasted.
- Over generations the extremes are removed and the population mean shifts very slightly (or not at all) — but the variance around the mean narrows.
Key Takeaways
- When conditions are not harsh, specialisation is not advantageous; generalists survive.
- Selection always acts relative to an environment — the same phenotypes can be favoured or penalised in different conditions.
- Stabilising selection does NOT shift the mean phenotype; it reduces the variance.
Common Mistakes
- Confusing this with disruptive selection because the pond has different conditions from pond 1.
- Saying "there is no selection" — selection is still acting, it just favours intermediates.
- Failing to give a mechanism — must say WHY intermediates are fitter (diet breadth, low competition).
Things to Be Careful About
- The mark scheme requires the type of selection AND the contrast between extremes and intermediates AND an explanation involving reduced competition and/or dietary flexibility.
- "Food is sufficient" is an observation from the question; the mark scheme wants you to use it, not just repeat it.
The intestine length of S. multiplicata tadpoles shows continuous variation.
Sketch a curve on Fig. 7.2 to show how intestine length varies in the tadpole population in pond 2.
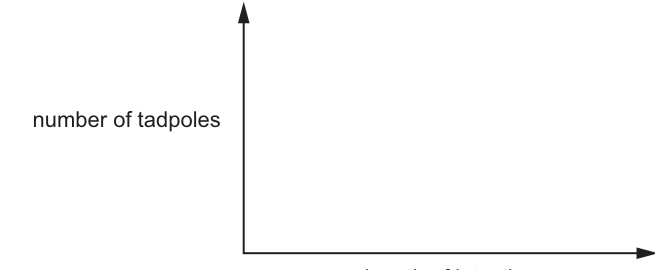
Answer
Sketch a normal distribution (bell-shaped) curve on Fig. 7.2:
- y-axis: number of tadpoles
- x-axis: length of intestine
- The curve is symmetrical, single-peaked, centred over the middle of the intestine-length range, with tails tapering to (but not necessarily touching) the x-axis at both short and long intestine lengths.
This shape reflects stabilising selection acting on continuous variation — most tadpoles have an intermediate intestine length, with progressively fewer at the short and long extremes.
Normal (bell-shaped) distribution curve, symmetrical and centred over the middle of the intestine-length axis.
Background Concept
Continuous variation is quantitative — it shows a full range of intermediate values between two extremes (e.g. height, mass, organ length). When such a trait is measured across many individuals in a population and the frequency of each value is plotted, the resulting histogram is usually bell-shaped (a normal distribution), because most individuals are near the population mean and progressively fewer lie towards the extremes. This is a consequence of many genes of small effect (polygenes) and environmental influences all contributing additively.
Stabilising selection, which is the selection pattern in pond 2, acts by removing the extremes of this distribution each generation, leaving the mean roughly unchanged but reducing the variance. The curve we expect to draw is therefore the standard normal distribution.
Understanding the Question
Fig. 7.2 is an empty graph with y-axis "number of tadpoles" and x-axis "length of intestine". The question tells us that intestine length is a continuously varying trait and asks us to sketch the curve that would result in pond 2, where intermediates are common and extremes are rare.
Approach
Read the axis labels, decide what shape matches "most tadpoles have intermediate intestine length and progressively fewer have shorter or longer intestines", and draw a single, smooth, symmetrical bell curve that peaks roughly above the middle of the x-axis range.
Step-by-Step Reasoning
- Identify what is on each axis — y-axis = frequency (number of tadpoles); x-axis = the continuous variable (length of intestine).
- Recall that continuous variation graphed as frequency produces a normal distribution.
- Pond 2 has stabilising selection, so the extremes are removed — the curve is still bell-shaped (because the trait is still continuous), but its tails are even thinner than they would be under no selection. The expected sketch is a standard symmetrical bell curve.
- Draw a smooth curve rising from low on the left, peaking above the middle of the x-axis, and falling again to low on the right. The curve does not need to touch the axis at both ends.
Key Takeaways
- Continuous variation → normal distribution curve (bell shape).
- Stabilising selection does NOT change the shape from a bell to something else — it just narrows it.
- Always check axis labels before sketching: y is frequency, x is the measured trait.
Common Mistakes
- Drawing a U-shape (which would suggest disruptive selection in pond 1, not pond 2).
- Drawing a skewed curve with a single tail.
- Forgetting to label / orient the axes correctly.
Things to Be Careful About
- One mark is awarded for the correct shape — a normal distribution. Do not embellish or change it.
A student suggested that the variation in S. multiplicata tadpoles could lead to sympatric speciation in some populations.
Outline the features of sympatric speciation.
Answer
- New species form due to reproductive isolation.
- Caused by, ecological / behavioural, separation / isolation / differences (e.g. different feeding niches leading to assortative mating within each niche).
- Speciation occurs in the same geographical region (no physical barrier separating the populations).
Reproductive isolation arising from ecological/behavioural separation within the same geographical region.
Background Concept
Speciation is the process by which one ancestral species splits into two or more reproductively isolated daughter species. For new species to be recognised as such, gene flow between the two groups must stop — they must no longer be able to interbreed to produce fertile offspring (the biological species concept).
There are two main modes:
- Allopatric speciation: a physical barrier (mountain range, sea, river) divides a population, the two halves evolve independently, and reproductive isolation evolves as a by-product.
- Sympatric speciation: a new species arises within the SAME geographical region as the parent population, with no physical barrier. Reproductive isolation usually arises through ecological niche differentiation, behavioural differences (e.g. mating preference), polyploidy in plants, or sexual selection.
A textbook sympatric example is the cichlid fish of Lake Victoria, where hundreds of species have evolved in the same lake by specialising on different food sources and choosing mates accordingly.
Understanding the Question
The student has suggested that the genetic variation in S. multiplicata tadpoles (detritus feeder vs carnivore vs intermediate) could, in some populations, lead to sympatric speciation. The task is to outline the FEATURES of sympatric speciation — i.e. state what defines it.
Approach
Identify the defining features: same geographical area (this is what distinguishes it from allopatric speciation), some form of reproductive isolation must evolve, and the trigger is usually ecological/behavioural separation rather than a physical barrier. In the context of Spea, the two extreme tadpole phenotypes occupy different feeding niches (detritus vs shrimp), which could lead to assortative mating — individuals mating with others of the same phenotype, reducing gene flow and eventually producing two species.
Step-by-Step Reasoning
- Sympatric speciation produces new species WITHOUT a geographical barrier — the whole process occurs within one location.
- A mechanism must evolve that prevents gene flow between the two groups; this is reproductive isolation.
- In the Spea example, the most plausible mechanism is ecological/ behavioural separation: tadpoles that develop into carnivores tend to encounter and mate with other carnivores (different habitat use, different timing of metamorphosis), while detritus feeders tend to mate amongst themselves.
- Over many generations, allele frequencies diverge between the two groups until they can no longer interbreed successfully — speciation is complete.
Key Takeaways
- Sympatric speciation = speciation without geographical separation.
- Reproductive isolation is the criterion that defines a species.
- Ecological/behavioural differences (niche specialisation) are a common trigger.
Common Mistakes
- Confusing sympatric with allopatric (i.e. saying there IS a geographical barrier).
- Omitting reproductive isolation — without it, no speciation.
- Writing about selection pressures without connecting them to a barrier to gene flow.
Things to Be Careful About
- The mark scheme explicitly looks for: reproductive isolation, ecological/behavioural separation, and same geographical region. Hit all three if possible.
Fig. 7.3 shows the evolutionary relationships between three species of American spadefoot toad.
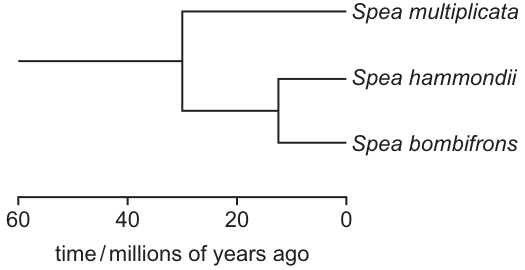
Explain how analysis of DNA allowed the evolutionary relationships shown in Fig. 7.3 to be determined.
Answer
- The DNA sequence(s) of (all three) species were obtained / compared.
- The number of nucleotide / base differences (and/or similarities) between each pair of species was found / counted.
- The fewer the differences, the more closely related the species / the more recent the divergence / the less time since they shared a common ancestor.
- Bioinformatics / computer software / databases / BLAST, was used to compare sequences.
- Spea hammondii and Spea bombifrons have the fewest differences / are the most genetically similar, so they share the most recent common ancestor (consistent with the tree).
DNA sequences of the three species are compared; fewer nucleotide differences indicate more recent common ancestry, with S. hammondii and S. bombifrons the most similar pair.
Background Concept
Phylogenetic (evolutionary) trees show the inferred pattern of common ancestry among a group of species. Modern phylogenetics relies heavily on molecular data — comparing the nucleotide sequences of homologous DNA regions (often conserved genes, mitochondrial DNA, or whole genomes) across species.
The underlying assumption is the molecular clock: DNA sequences accumulate neutral mutations at a roughly constant rate over time. Therefore, two species that diverged recently have had less time to accumulate differences and will have more similar sequences than two species that diverged long ago. Bioinformatics tools (BLAST, ClustalW, MEGA, etc.) align sequences and count the differences.
Understanding the Question
Fig. 7.3 is a phylogenetic tree for three Spea species, with S. multiplicata branching off earliest (about 30 million years ago) and S. hammondii and S. bombifrons being sister species that diverged more recently (about 12 million years ago). We are asked to explain how DNA analysis produced this tree.
Approach
Walk through the molecular-phylogenetic pipeline:
- Obtain DNA from each species (and ideally from outgroup species).
- Sequence a comparable region of DNA in each.
- Align the sequences (using bioinformatics software).
- Count nucleotide differences between each pair of species.
- Build a tree where species with fewer differences cluster more closely together, and use a molecular clock to estimate divergence times.
Step-by-Step Reasoning
- DNA is extracted from each of the three Spea species and the same gene (or several genes) is sequenced for all of them.
- The sequences are aligned using computer software such as BLAST or ClustalW so that homologous bases can be compared position-by-position.
- The number of base / nucleotide differences between each pair of species is counted.
- The principle: fewer differences = more recent common ancestor. S. hammondii and S. bombifrons show the fewest differences, so they diverged most recently; S. multiplicata differs more from both, so it diverged earlier.
- A phylogenetic tree is built in which branch lengths (or positions) reflect the amount of genetic divergence and therefore the time since each split. A molecular clock calibration (using fossils or known divergence dates) converts branch lengths into absolute times — here, the 30 and 12 million-year figures.
Key Takeaways
- Phylogenetic trees from DNA are built on the principle that sequence similarity reflects recency of common ancestry.
- Bioinformatics tools are essential for handling large sequence comparisons.
- A phylogenetic tree is a hypothesis, not a fact — different genes can give slightly different trees, and rates of evolution are not perfectly constant.
Common Mistakes
- Saying the species' DNA was "compared" without saying HOW (sequencing, alignment, counting differences).
- Saying "more similar DNA means they evolved from each other" — both species evolved from a common ancestor, not from each other.
- Forgetting to mention that S. hammondii and S. bombifrons are the most similar pair (this is the specific point that links the DNA data to the tree shown).
Things to Be Careful About
- "Closely related" in a phylogenetic context means they share a more recent common ancestor, NOT that one evolved from the other.
- Use the precise term "nucleotide / base differences" rather than vague "DNA differences".
Scientists use many different techniques in genetic engineering.
Sometimes the gene for genetic engineering cannot be extracted from the donor organism. Instead, the gene is synthesised using one of two different methods.
Outline the two methods for synthesising a gene for use in genetic engineering.
Answer
Method 1 — cDNA from mRNA:
- extract mRNA from the cells that express the gene;
- use reverse transcriptase to make a complementary DNA (cDNA) copy of the mRNA.
Method 2 — chemical synthesis:
- obtain the known amino acid / nucleotide sequence of the gene from a database;
- chemically synthesise (join) the gene from (free activated) nucleotides.
- Use reverse transcriptase to make cDNA from mRNA. 2. Chemically synthesise the gene from nucleotides using the known amino acid/nucleotide sequence from a database.
Background Concept
When a gene is to be transferred into a new organism it must first be obtained as a piece of DNA. The easiest method is to cut the gene out of the donor organism's DNA with a restriction endonuclease. However, this only works if (i) the gene is short and contains no internal cut sites for the chosen enzyme, and (ii) the gene's location and sequence are known well enough for a probe to be used to find it. In many cases neither condition is met, so alternative ways of making the gene have to be used.
The CIE syllabus requires you to know two such alternatives: (1) making the gene indirectly via mRNA using reverse transcriptase, and (2) building the gene chemically in a machine that joins nucleotides together. Both are valid because they can produce a piece of DNA that codes for the desired polypeptide without ever needing the intact chromosomal gene to be cut out.
Understanding the Question
The stem sets up a real situation faced by genetic engineers: the gene they want cannot simply be cut from the donor. The command word outline means you should give a brief description of each method, hitting the key features that earn marks. Three marks are available, so the mark scheme allows any three of the four creditable points (two methods × two features each). You need to be able to score at least one point from each method to give a balanced "two methods" answer.
Approach
Write one short paragraph per method, mentioning the starting material, the key enzyme or process, and (where relevant) the information source. Aim for the four mark-scheme points but only need any three of them. The order of methods is not important; either order is acceptable.
Step-by-Step Reasoning
Method 1 – reverse transcriptase / cDNA route.
- The gene is expressed in a particular cell type, so the cell contains many copies of its mRNA. mRNA is easier to obtain in quantity than the chromosomal gene itself.
- Reverse transcriptase is a retroviral enzyme that uses an mRNA template to synthesise a single strand of complementary DNA (cDNA).
- DNA polymerase is then used to make the cDNA double-stranded, giving a DNA copy of the original mRNA that contains the coding sequence of the gene (but no introns, because mRNA has already been spliced).
Method 2 – chemical synthesis.
- If the amino acid sequence of the protein is known (or, better, the exact nucleotide sequence of the gene is known), the sequence can be looked up in a database.
- A DNA synthesiser machine joins free activated nucleotides together in the correct order to build the gene chemically, one nucleotide at a time. Short genes (up to a few hundred base pairs) can be made this way; longer ones are usually assembled from overlapping synthetic oligonucleotides.
Key Takeaways
- You should know two methods of synthesising a gene when it cannot simply be cut from donor DNA: reverse transcriptase making cDNA from mRNA, and chemical synthesis of nucleotides.
- Reverse transcriptase is the key enzyme to name in the first method; in the second method, mention the use of a known sequence from a database.
- cDNA contains only exons (no introns) because it is copied from processed mRNA – this is also why cDNA is often preferred for expression in bacterial hosts that cannot splice introns.
Common Mistakes
- Naming only one method (e.g. just "use reverse transcriptase") and giving three detail points for it – this scores at most 2 marks because the question demands two methods.
- Writing "use RNA polymerase to make DNA from mRNA" – RNA polymerase makes RNA, not DNA; reverse transcriptase is the correct enzyme.
- Confusing the chemical synthesis method with PCR. PCR amplifies an existing template; chemical synthesis builds a sequence from scratch using no template.
- Saying "the gene is made from amino acids" – genes are made from DNA nucleotides, not amino acids; the amino acid sequence is only the information source used by the synthesiser.
Things to Be Careful About
- Outline does not require great depth, but each method must be recognisable – one short sentence per method is normally enough.
- The mark scheme gives four points for two methods, so you only need any three. A balanced answer that names both methods, however, is the safest way to guarantee the marks.
- Do not write about restriction enzymes here – the stem explicitly says the gene cannot be cut from the donor, so that method is excluded by the question.
DNA ligase and DNA polymerase are two enzymes that are used in genetic engineering.
Complete Table 8.1 to show the roles of DNA ligase and DNA polymerase in genetic engineering.
Use a tick (✓) if the enzyme has the role or a cross (✗) if the enzyme does not have the role.
Table 8.1
| role in genetic engineering | DNA ligase | DNA polymerase |
|---|---|---|
| joins two sections of sugar phosphate backbone in DNA | ||
| adds a gene to a plasmid | ||
| adds free activated DNA nucleotides to a polynucleotide |
Answer
| role in genetic engineering | DNA ligase | DNA polymerase |
|---|---|---|
| joins two sections of sugar phosphate backbone in DNA | ✓ | ✗ |
| adds a gene to a plasmid | ✓ | ✗ |
| adds free activated DNA nucleotides to a polynucleotide | ✗ | ✗ |
Ligase joins sugar-phosphate backbones and inserts a gene into a plasmid (✓, ✓); polymerase does neither (✗, ✗, ✗).
Background Concept
A living cell carries out DNA replication, repair and recombination using a toolkit of enzymes. Two of the most important in any molecular-biology lab are DNA ligase and DNA polymerase. They have very different catalytic jobs, and confusing them is one of the most common errors in CIE marking.
- DNA ligase seals nicks in the sugar-phosphate backbone. It forms the phosphodiester bond between the 3′–OH of one nucleotide and the 5′–phosphate of the next, but it does not itself add new nucleotides. In genetic engineering it is used to join the inserted gene to the opened plasmid, producing a recombinant plasmid.
- DNA polymerase adds nucleotides to a growing strand, using an existing strand as a template. Free activated nucleotides (deoxyribonucleoside triphosphates, dNTPs) are added to the free 3′–OH end of a primer that is already base-paired to the template. It does not join pre-existing sections of backbone; that is ligase's job.
Understanding the Question
The table is already partly drawn; you must place a tick or a cross in each of six cells (three rows × two enzymes). One mark is awarded for each row in which the candidate's ticks/crosses are entirely correct. The right-hand column for "DNA polymerase" is the easy one to get wrong, because polymerase is sometimes loosely described as "joining DNA together" – but that is not what the table is testing.
Approach
For each role, ask: which of the two enzymes does this? The roles can be answered directly from the textbook definitions above.
Step-by-Step Reasoning
Row 1 – joins two sections of sugar phosphate backbone in DNA.
This is the textbook definition of DNA ligase. ✓ for ligase. DNA polymerase extends a strand by adding nucleotides to an existing 3′–OH; it does not seal breaks between two pre-existing strands. ✗ for polymerase.
Row 2 – adds a gene to a plasmid.
Adding a gene to a plasmid means sealing the gene into the opened plasmid vector. This requires the phosphodiester bonds of the sugar-phosphate backbone to be re-formed, which is DNA ligase's job. ✓ for ligase. DNA polymerase has no role in this step. ✗ for polymerase.
Row 3 – adds free activated DNA nucleotides to a polynucleotide.
This describes the polymerisation step of DNA replication. It is done by DNA polymerase in vivo, but the question is about roles in genetic engineering. In genetic engineering, polymerase is used to fill in single-stranded overhangs after sticky ends have annealed (and in PCR/Sanger sequencing), but it is not used to add the gene itself to the plasmid. The mark scheme credits this row as a ✗ for ligase and a ✗ for polymerase because adding free nucleotides is not the role of either enzyme in the context of constructing a recombinant plasmid. Read carefully: polymerase does add nucleotides in some genetic-engineering contexts, but not in the construction of a recombinant plasmid, and the mark scheme treats this row as a distractor.
Key Takeaways
- DNA ligase seals nicks in the sugar-phosphate backbone – it joins existing pieces of DNA together.
- DNA polymerase extends a strand by adding free nucleotides to a 3′–OH end – it does not join pre-existing sections.
- A useful one-sentence memory aid: ligase welds; polymerase builds.
Common Mistakes
- Putting a tick for DNA polymerase in row 1 because polymerase "makes new DNA" – polymerase makes DNA by extending a strand, not by joining two pre-existing sections.
- Putting a tick for DNA polymerase in row 2 because the polymerase "fills in" sticky ends – filling in single-stranded overhangs is not the same as adding the gene to the plasmid, and the mark scheme does not credit it here.
- Confusing ligase with restriction enzyme. Restriction enzymes cut DNA at specific sequences; ligase joins DNA. They are not the same enzyme, although they work on the same sugar-phosphate backbone.
Things to Be Careful About
- The table has six cells, but only three marks are available – one per row. If you put three ticks or three crosses in a row you score 0 for that row, even if the other two rows are correct.
- The "free activated DNA nucleotides" wording is precise: activated means carrying three phosphates (dNTPs). The phrase "DNA polymerase adds activated nucleotides" is true in general biology but is rejected in this question because the context is genetic engineering of a recombinant plasmid, where polymerase does not play this role.
The polymerase chain reaction (PCR) is used to make many copies of a gene.
Three temperatures are used in a PCR cycle.
State the three temperatures that are used, and outline what happens at each temperature during a PCR cycle.
Answer
- – DNA, denatures / the two strands separate (hydrogen bonds between complementary bases break).
- – primers, bind (anneal / base-pair) to the single-stranded DNA.
- – (Taq) DNA polymerase, makes the new DNA strand / extends the primer by adding free activated DNA nucleotides.
90–98 °C: strands separate; 50–65 °C: primers anneal; 68–75 °C: Taq polymerase extends the new strand.
Background Concept
The polymerase chain reaction (PCR) is a way of amplifying a specific DNA sequence in vitro. A small amount of template DNA, a pair of short single-stranded DNA primers complementary to the two ends of the target sequence, free deoxyribonucleoside triphosphates (dNTPs), and a thermostable DNA polymerase (almost always Taq polymerase, isolated from the thermophilic bacterium Thermus aquaticus) are mixed together and then cycled through three temperatures repeatedly. Each cycle doubles the number of copies of the target sequence, so after n cycles roughly copies are produced (e.g. about a billion copies from 30 cycles).
The three temperatures are needed because each step of the cycle has a different optimum:
- a high temperature to separate the strands,
- a lower temperature to allow the primers to base-pair,
- an intermediate temperature at which the polymerase works fastest.
The use of a thermostable polymerase is what makes cycling possible: ordinary DNA polymerases would be denatured at the high first temperature and would have to be re-added after every cycle, which is impractical.
Understanding the Question
The question asks for two things at each of the three temperatures: the temperature itself and what is happening biologically. The mark scheme gives one mark per temperature step (temperature + event), for three marks. The exact temperatures within the stated ranges are accepted; quoting the range or a single value within it is fine.
Approach
Recall the order of the steps: denature → anneal → extend. Then match each step to its temperature range and to the event that takes place. Keep the language precise – use the words "denature" (or "strands separate") for step 1, "bind / anneal / base-pair" for step 2 and "polymerase extends / new strand made" for step 3.
Step-by-Step Reasoning
Step 1 – denaturation, .
At near-boiling temperature the hydrogen bonds between complementary base pairs are broken and the double helix separates into two single strands. The mixture is held at this temperature only briefly because prolonged heating would damage the primers and the polymerase. The high temperature is essential because primers are short and would otherwise re-anneal to the template as soon as the temperature dropped.
Step 2 – primer annealing, .
The mixture is cooled enough to allow the primers to hydrogen-bond to their complementary sequences on the single-stranded template. The exact temperature is chosen to be low enough for the primers to bind stably but high enough that non-specific binding (primers sticking in the wrong place) is minimised. The primers define where the new DNA synthesis will start – one for each strand, so that the region between the primers is amplified.
Step 3 – extension, .
The mixture is warmed to the optimum working temperature of Taq DNA polymerase (the polymerase itself comes from a thermophilic bacterium, so it remains active at this temperature). The polymerase extends each primer by adding free activated DNA nucleotides to the 3′ end, using the template strand as a guide. Each new strand is synthesised in the 5′→3′ direction. After a few minutes the new strand has been built right across the target region and the cycle can begin again.
The three steps are then repeated, typically 25–35 times, and at the end of the final cycle a final extension step at is sometimes added to ensure that all strands are fully extended.
Key Takeaways
- A PCR cycle has three steps: denaturation, primer annealing, and extension.
- Temperatures: about , about and about (any values in the CIE-accepted ranges are fine).
- Taq polymerase is required because it is thermostable – ordinary DNA polymerases would be denatured at the first step.
- Each cycle doubles the number of copies of the target sequence, giving an exponential amplification of approximately after cycles.
Common Mistakes
- Reversing the order of the temperatures (e.g. putting the lowest temperature first). The cycle must be hot → cool → warm.
- Saying "the DNA is split open" or "cut" – the correct word is denatured (or the strands separate). No cutting is involved.
- Calling the primers "enzymes" – primers are short single-stranded DNA sequences, not enzymes.
- Forgetting to name Taq polymerase. The mark scheme accepts either "Taq polymerase" or just "DNA polymerase" but it must be the DNA polymerase that extends the new strand; do not credit it for the denaturation step.
- Saying the polymerase "unzips the DNA" – the high temperature unzips the DNA; the polymerase builds the new strand.
Things to Be Careful About
- The temperatures are ranges, not single values; the mark scheme accepts any value within , and . A common acceptable shorthand is 95 °C, 55 °C and 72 °C.
- Each mark requires the temperature and the event at that temperature. Quoting only temperatures or only events will not score all three marks.
- The order of the three answers should match the order in which the steps occur in a cycle, otherwise the examiner has to work out which event you are describing for which temperature.
Lichens are found growing on trees, walls, rocks and soil.
Fig. 9.1 shows a lichen of the genus Usnea. Usnea can tolerate only low concentrations of sulfur dioxide and does not grow in places where the air is polluted with sulfur dioxide.
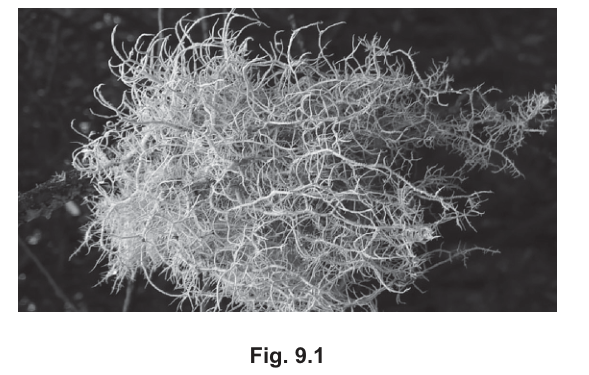
Usnea is composed of a mixture of two types of cell:
• photosynthetic cells that are classified in the kingdom Protoctista
• fungal cells that are classified in the kingdom Fungi.
Answer
Both kingdoms (Eukarya)
- both are eukaryotic; cells have a true nucleus (nuclear envelope) and membrane-bound organelles (e.g. mitochondria, endoplasmic reticulum).
Protoctista — a kingdom whose members vary
- some members are photosynthetic (e.g. green algae such as Chlorella or Spirogyra), while others are heterotrophic (e.g. Amoeba or Paramecium); some have a cell wall (algae) and others do not (protozoa); some are unicellular, while others are multicellular (e.g. large seaweeds).
Fungi (any three)
- cell wall made of chitin (not cellulose)
- body made of hyphae, organised into a mycelium
- heterotrophic nutrition — saprotrophic (extracellular digestion of dead organic matter) or parasitic
- (other valid features) hyphae are often multinucleate / coenocytic; carbohydrate stored as glycogen (not starch); reproduce by spores.
Both Protoctista and Fungi are eukaryotic. Protoctista is a diverse kingdom (some photosynthetic, others heterotrophic; some have a cell wall, others do not; some unicellular, others multicellular). Fungi have chitin cell walls, a hyphal mycelium, multinucleate hyphae, heterotrophic nutrition, store glycogen and reproduce by spores.
Background Concept
Classification places every living organism into a hierarchy of taxa: kingdom, phylum, class, order, family, genus, species. CIE A-Level Biology teaches both the three-domain system (Archaea, Bacteria, Eukarya) and the five-kingdom system (Prokaryotae/Monera, Protoctista, Fungi, Plantae, Animalia). Under the three-domain model, Protoctista, Fungi, Plantae and Animalia are all placed in Eukarya, defined by the possession of a true nucleus and membrane-bound organelles.
Protoctista is essentially a 'catch-all' kingdom for eukaryotes that are not animals, plants or fungi. Its members are very diverse and so the kingdom is defined by exclusion rather than by a clear set of shared features. Fungi, by contrast, share a clear set of features: they are heterotrophic eukaryotes with chitin cell walls, a hyphal body plan and spore-based reproduction. Modern molecular evidence places Fungi closer to Animalia than to Plantae.
Understanding the Question
The stem of Q9 explains that a lichen (Usnea) is a partnership between photosynthetic cells classified in Protoctista and fungal cells classified in Fungi. Part (a) asks you to outline the characteristic features of these two kingdoms. 'Outline' means state the key points briefly — for 4 marks you need four distinct points, drawn from the mark scheme list.
Approach
Plan your answer under two headings (Protoctista and Fungi) and start with the shared eukaryotic feature to pick up the easy first mark. For Protoctista, remember that the kingdom is defined by diversity, so the mark scheme requires you to give BOTH sides of a variation (e.g. 'some photosynthetic, others heterotrophic'). For Fungi, choose any three of the six listed features; the classic trio is chitin wall, hyphae/mycelium and heterotrophic nutrition, but multinucleate hyphae, glycogen storage and spore reproduction are equally valid.
Step-by-Step Reasoning
Both eukaryotic (mark 1) — Eukaryotic cells have a true nucleus bounded by a nuclear envelope, and membrane-bound organelles such as mitochondria, endoplasmic reticulum, Golgi apparatus and (in many) chloroplasts. This single shared feature earns one mark.
Example of a eukaryotic feature (mark 2) — Pick a concrete example: a true nucleus, linear chromosomes, mitochondria, 80S ribosomes, endoplasmic reticulum, Golgi apparatus. The most accessible choice is 'true nucleus' or 'membrane-bound organelles such as mitochondria'.
Protoctista — a kingdom whose members vary (mark 3) — The mark scheme requires you to give BOTH ends of a variation, not just one. Choose any of:
- Nutrition: some photosynthesise (e.g. green algae such as Chlorella or Spirogyra), others are heterotrophic (e.g. Amoeba or Paramecium).
- Cell wall: some have a cell wall (algae), others do not (protozoa).
- Body plan: most are unicellular, but some are multicellular (large seaweeds such as kelp).
- Locomotion: some have flagella or cilia, others move by amoeboid means, others are non-motile.
Just stating one side of a variation is incomplete and may not earn the mark.
Fungi — pick any three (marks 4 onward, capped at 3 marks for Fungi) — The six features in the mark scheme are:
- Chitin cell wall — the same tough nitrogen-containing polysaccharide that forms insect exoskeletons. Distinguishes fungi from plants (cellulose walls) and from animals (no walls).
- Hyphae / mycelium — the fungal body is a network of thread-like hyphae; the whole network is the mycelium. The large surface area is ideal for absorption of nutrients.
- Multinucleate hyphae — many fungi have hyphae with no internal cross-walls (septa), so the cytoplasm contains many nuclei in one continuous compartment (a coenocyte or syncytium).
- Heterotrophic nutrition — fungi cannot make their own organic compounds. They feed as saprotrophs (secreting extracellular enzymes that digest dead organic matter, then absorbing the products) or as parasites (digesting living host tissue).
- Glycogen storage — fungi store carbohydrate as glycogen, the same as animal cells, not as starch (which is the plant storage polysaccharide).
- Spore reproduction — fungi reproduce both asexually and sexually via spores, which are usually tiny, light and wind-dispersed.
The mark scheme caps Fungi at 3 marks, so even if you list all six you will only earn three. Pick your three strongest.
Key Takeaways
- Protoctista and Fungi both lie in domain Eukarya.
- Protoctista is a 'dumping-ground' kingdom; its members are extremely varied in nutrition, cell wall, body plan and habitat.
- Fungi are heterotrophic eukaryotes with chitin walls, a hyphal mycelium, glycogen stores and spore-based reproduction.
Common Mistakes
- Treating Protoctista as a single coherent group and giving only one feature (e.g. 'they are unicellular') instead of the required both-sides variation.
- Saying fungi have cellulose cell walls (that is plants) or store starch (also plants).
- Saying fungi are plants or animals, or that they photosynthesise.
- Calling fungal hyphae simply 'multicellular' — the mark scheme prefers 'multinucleate / coenocytic' to capture the unusual nuclear arrangement.
- Writing about kingdoms other than Protoctista and Fungi, e.g. drifting into Plantae or Animalia.
Things to Be Careful About
- The mark scheme caps Fungi at 3 marks, so you must say something about Protoctista to access the full 4 marks.
- The Protoctista point requires BOTH sides of a variation (e.g. 'some X, others Y'); a single feature is not enough.
- Italicise genus/species names correctly (e.g. Chlorella, Amoeba).
- Do not give a long essay — 'outline' means brief, point-form statements.
Xanthoria is a lichen that can grow in places where there is a high concentration of sulfur dioxide in the air, for example in towns where homes, factories and vehicles burn fuels.
Fig. 9.2 shows a lichen of the genus Xanthoria.
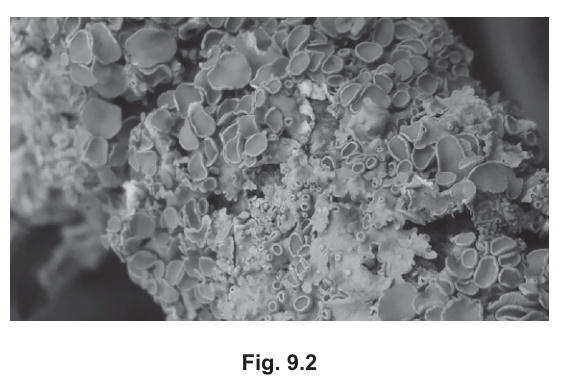
A student planned a method to measure the relative abundance of Usnea and Xanthoria on trees along a transect from the town centre at to unpolluted countryside at .
Suggest why measuring the relative abundance of the two types of lichen gives information that is useful for conservation.
Answer
- The changing ratio of Usnea (sensitive) to Xanthoria (tolerant) along the transect gives information about air quality / sulfur dioxide pollution; lichens act as bioindicators of because they absorb everything directly from the atmosphere.
- A decrease in sensitive lichen abundance signals that / acid rain is also harming other species (e.g. mosses, trees, aquatic invertebrates), so the data flag wider ecosystem damage that conservationists need to address.
- Lichens form part of food webs — they are eaten by invertebrates (e.g. moth caterpillars, mites, springtails), which in turn feed other animals — so a fall in lichen abundance threatens the species that depend on them for food.
The data give a biological measure of SO2 air quality (Usnea as a clean-air bioindicator); they also flag parallel harm to other species from acid rain and warn of damage to food webs that depend on lichens.
Background Concept
Lichens are stable, long-lived symbioses between a fungus (usually an ascomycete, the mycobiont) and a photosynthetic partner (the photobiont) — either a green alga or a cyanobacterium. The fungal partner provides structure, water and mineral nutrients; the photosynthetic partner provides organic carbon via photosynthesis.
Because the lichen has no cuticle, no stomata, no roots and no vascular system, it absorbs everything (water, minerals, gases, pollutants) directly across its surface from the atmosphere. This is what makes lichens so sensitive to atmospheric pollutants such as sulfur dioxide (). is acidic and damages the fungal cells, and the resulting acid rain lowers the pH of bark and rock, removing the substrate the lichen needs.
Different lichen species have different sensitivities. Usnea (a bushy, hair-like lichen) is highly sensitive and acts as a 'clean-air' indicator; Xanthoria (a leafy, crustose lichen) is much more tolerant of and even thrives in moderately polluted areas. This is why ecologists use contrasting lichen species to map air quality.
A transect is a line placed along an environmental gradient, with samples taken at regular intervals. It is the standard tool for showing how species composition changes as one moves from one environment to another — in this case, from a polluted town centre to clean countryside.
Understanding the Question
The student plans a transect from the polluted town centre (0 km) to clean countryside (4 km), recording the relative abundance of the two contrasting lichen genera shown in Fig. 9.1 (Usnea) and Fig. 9.2 (Xanthoria). The question asks you to SUGGEST why this kind of measurement gives information that is useful for conservation. 'Suggest' means you should give reasoned, plausible ideas — not just facts.
The mark scheme wants three threads:
- the data give information about air quality / pollution,
- the same pollution harms other species,
- lichens are part of food webs, so changes in lichen abundance affect the species that depend on them.
Approach
Think about the conservation value of the data. Do not just say 'useful to know' — connect lichen abundance to:
- what it tells us about the environment (bioindication of ),
- what it tells us about the wider ecosystem (other species are also at risk), and
- what it tells us about food webs (species that depend on lichens).
Step-by-Step Reasoning
Air quality information (mark 1) — A shift from Xanthoria (tolerant) near the town centre to Usnea (sensitive) further out is a visual, biological measure of pollution. The ratio of the two species along the transect therefore gives a quick, cheap, ecologically-meaningful picture of air quality without chemical analysis. This is the bioindicator principle in action: a sensitive species tells you the air is clean; a tolerant species alone tells you nothing because it grows everywhere.
Parallel harm to other species (mark 2) — Sulfur dioxide and the acid rain it causes damage many organisms besides lichens: mosses, conifers, freshwater invertebrates, amphibian eggs, the algal partners inside the lichens. A fall in sensitive lichen abundance is therefore an early warning that the wider ecosystem is also at risk, prompting conservationists to act (e.g. lobby for cleaner fuels, protect affected habitats, monitor freshwater streams).
Food-web effects (mark 3) — Lichens are food for many invertebrates (caterpillars, mites, springtails, slugs), and these invertebrates in turn feed birds, small mammals and other predators. A reduction in lichen abundance ripples up the food chain, so the transect data flag risks to the species that depend on lichens.
AVP (mark 4 if used) — Any other valid point is accepted; common ones include: lichens are slow-growing so declines take a long time to reverse, or that lichens are flagship / indicator species that help raise public awareness of pollution.
Key Takeaways
- Lichens are classic bioindicators because they absorb everything directly from the air.
- A transect survey is a useful tool for showing how species composition changes along an environmental gradient.
- Bioindicator data are valuable for conservation because they flag both the pollutant and its wider effects on the ecosystem and food webs.
Common Mistakes
- Vague statements like 'the data show pollution' without naming or explaining the bioindicator role.
- Talking only about lichens and not connecting the data to other species or the ecosystem as a whole.
- Confusing 'relative abundance' with 'biodiversity' — the question is about which of two species dominates, not about counting species.
Things to Be Careful About
- 'Suggest' wants reasoned suggestions, not bare facts. Always state the link: the data are useful because X, which matters because Y.
- Be specific: name sulfur dioxide / air quality; do not just say 'pollution'.
- The mark scheme caps this part at 3 marks; three well-chosen, distinct points are enough.
Although a large biodiversity of lichens can be found in a range of habitats, most people ignore them.
Outline why forms of life that are usually ignored, such as lichens, should be conserved.
Answer
- Lichens play a role in food webs — they are eaten by many invertebrates (e.g. moth caterpillars, mites, springtails), which in turn feed other animals higher up the food chain.
- Lichens are pioneer species / primary colonisers of bare rock; they help break down the substrate and contribute to soil formation, allowing other plants to colonise later.
(Other valid reasons accepted by the mark scheme: provide shelter / camouflage for insects; clean the air / remove pollutants; may have medical or other practical use; ethical / aesthetic reasons; conserve genetic diversity for future use.)
Lichens play important roles in food webs and are pioneer species that help form soil; they may also have medical value, clean the air, provide shelter for invertebrates, and have intrinsic worth.
Background Concept
Conservation is the protection and management of biodiversity — the variety of life at genetic, species and ecosystem levels. Most public and political attention goes to 'charismatic' megafauna (tigers, whales, pandas) but ecologists argue that overlooked groups such as lichens, mosses, fungi and invertebrates are equally important. The standard reasons, which the mark scheme lists, fall into three broad groups:
- Ecological roles — overlooked species contribute to food webs, nutrient cycling, soil formation, pollination, decomposition and habitat provision.
- Human-use / potential value — they may have medicinal, agricultural or industrial uses, and they preserve genetic diversity that may be useful in the future.
- Intrinsic / ethical value — species have a right to exist, and people value them aesthetically or culturally.
Lichens are an excellent case study. They are widely ignored but tick all three boxes: they are eaten by invertebrates and are pioneers that begin soil formation on bare rock; they have been used in traditional dyes, perfumes and medicine; and they are valued aesthetically by naturalists.
Understanding the Question
The prompt explicitly tells you that lichens are 'usually ignored' by the public. The question asks you to outline why forms of life such as lichens should nonetheless be conserved. 'Outline' means give brief, distinct points — for 2 marks you need two valid points from the mark scheme's list of eight.
Approach
Pick two STRONG, DISTINCT reasons. The most reliable combinations pair an ecological role (food web, soil formation, air cleaning) with a human-use or ethical reason (medicinal use, genetic resource, intrinsic value). Do not just repeat the same idea twice.
Step-by-Step Reasoning
Ecological role — food web (mark 1) — Lichens are eaten by many invertebrates: moth caterpillars, mites, springtails, slugs and snails. Those invertebrates in turn feed birds, small mammals and predatory invertebrates. Removing lichens therefore disrupts food webs at the base, with knock-on effects higher up the chain.
Ecological role — pioneer / soil formation (mark 2) — Lichens are often the first organisms to colonise bare rock, tree bark and walls. They chemically weather the substrate and contribute organic matter from their dead tissue, gradually building a thin layer in which mosses and then vascular plants can establish. Without pioneers such as lichens, succession on bare surfaces is much slower.
Air cleaning — Lichens absorb and metabolise atmospheric pollutants, including some heavy metals and , helping to clean the air.
Shelter / camouflage — Many insects and spiders live among lichen fronds, where their grey-green colouration hides them from predators.
Medical use — Lichens produce a wide range of secondary metabolites. Usnic acid (from Usnea) has antibacterial properties and has been investigated as an antibiotic. Other lichen compounds have shown antiviral or anticancer activity.
Other practical use — Lichens have been used as dyes (e.g. orchil, litmus), as perfume fixatives and even as emergency food (reindeer moss, Cladonia).
Genetic diversity / future use — A species may carry genes that prove useful in medicine, biotechnology or crop breeding. Extinction is irreversible; the gene pool is lost forever.
Ethical / aesthetic reasons — Many people value lichens for their beauty and intricate forms. There is also a moral argument that humans have a duty to avoid causing extinctions.
Key Takeaways
- Overlooked species deserve conservation because of their ecological roles, their actual or potential human use, and their intrinsic value.
- Lichens are excellent case studies: they contribute to food webs, soil formation and air quality, and have a long history of human use.
- A species extinction is irreversible — we cannot recover lost genes or ecological functions.
Common Mistakes
- Vague answers such as 'they are important' or 'they help the environment' — too general to score.
- Repeating the same idea twice in different words (e.g. 'they are part of food webs' and 'they are eaten by other animals' are the same point).
- Drifting into reasons the transect data are useful (b(i)) instead of focusing on why lichens themselves should be conserved.
- Listing reasons that apply to any organism without tailoring them to lichens (e.g. 'they are part of biodiversity' is too generic).
Things to Be Careful About
- 'Outline' wants brief, point-form statements — do not write an essay.
- Each point must be specific to lichens (or to small overlooked organisms) and clearly different from the other.
- The mark scheme accepts a wide range of points; pick the two you can state most confidently and clearly.
Populations of the moth Biston betularia live in Europe and in North America. The most common phenotype on both continents is a pale wing colour with light-grey shading (the typical form).
A moth phenotype with dark wing colour (the melanic form) also occurs on both continents.
Fig. 10.1 shows the typical form of the moth. Fig. 10.2 shows the melanic form of the moth.
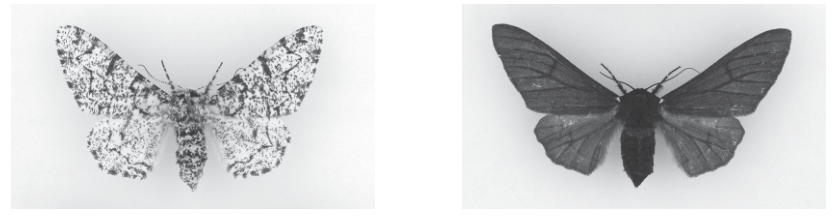
Two melanic European moths were crossed together. The wing colours of the offspring were 15 typical and 41 melanic.
Construct a genetic diagram to explain these results. You may use the symbols A and a to represent the alleles.
Working
Parental phenotypes: melanic × melanic
Parental genotypes: Aa × Aa
Gametes from each parent: A, a
Punnett square:
| A | a | |
|---|---|---|
| A | AA | Aa |
| a | Aa | aa |
Offspring genotypes: AA, Aa, Aa, aa
Offspring phenotypes: melanic, melanic, melanic, typical
Answer
Ratio = 3 melanic : 1 typical
3 melanic : 1 typical
Background Concept
A monohybrid cross follows the inheritance of a single gene with two alleles. The dominant allele is expressed in both the homozygous dominant (AA) and heterozygous (Aa) genotypes, while the recessive allele is only expressed in the homozygous recessive (aa) genotype. A Punnett square combines the gametes from each parent to predict the genotypes and phenotypes of the offspring.
Understanding the Question
Two melanic moths were crossed and produced 15 typical and 41 melanic offspring — a total of 56. The ratio of typical to melanic is 15 : 41, or approximately 1 : 3. Equivalently, the ratio of melanic to typical is approximately 3 : 1. This pattern strongly suggests a monohybrid cross between two heterozygous parents, with the melanic trait dominant.
Approach
Assign A to the dominant allele (melanic) and a to the recessive allele (typical). The 3 : 1 offspring ratio tells us that both parents must be heterozygous (Aa). Construct a Punnett square for Aa × Aa, then read off the offspring genotypes, phenotypes, and the final ratio.
Step-by-Step Reasoning
- 41 melanic + 15 typical = 56 total. 41/56 ≈ 0.73 and 15/56 ≈ 0.27, fitting a 3 : 1 ratio with melanic as the dominant trait.
- For a 3 : 1 ratio both parents must be Aa (homozygous parents would not give any recessive offspring).
- Each Aa parent produces two kinds of gamete: A and a.
- The Punnett square combines these to give four offspring cells: AA, Aa, Aa, aa.
- AA is melanic, the two Aa are melanic (A is dominant), aa is typical.
- The phenotypic ratio is therefore 3 melanic : 1 typical, consistent with the observed 41 : 15.
Key Takeaways
- A 3 : 1 offspring ratio in a monohybrid cross indicates that both parents are heterozygous and the trait that appears in 3/4 of offspring is the dominant one.
- A Punnett square is the standard way to lay out the cross and show all four offspring genotypes.
Common Mistakes
- Concluding that typical is dominant because the parents look melanic. The dominance of an allele is read from the offspring ratio, not from the parents' phenotype.
- Using the symbol A for the recessive allele. Capital letters denote dominant alleles by convention.
- Omitting one of the four offspring from the Punnett square, or forgetting to convert genotypes to phenotypes.
Things to Be Careful About
- The observed 15 : 41 is only an approximation of 1 : 3, and the question expects the predicted 3 : 1 ratio as the answer.
- The question explicitly allows the symbols A and a — A is the melanic (dominant) allele.
- Be sure to state the ratio in the conventional 3 : 1 melanic : typical form.
In a similar experiment, two melanic North American moths were crossed together. The colours of the offspring were 10 typical and 31 melanic.
What can be concluded about the allele that causes the melanic form in the moth populations in both continents?
Answer
The (melanic) allele is dominant.
The (melanic) allele is dominant.
Background Concept
When a cross gives the same offspring ratio in two independent populations, the same genetic mechanism — in particular, the same dominance relationship — is likely operating in both.
Understanding the Question
The European cross gave 15 typical : 41 melanic, and the North American cross gave 10 typical : 31 melanic. Both splits are close to 1 : 3 (typical : melanic), i.e. 3 : 1 melanic : typical. The same 3 : 1 pattern appears on both continents, so the same dominance relationship must be operating.
Approach
Recognise that the same 3 : 1 ratio in two independent crosses tells us the allele behaves the same way in both populations, and the melanic form is the dominant phenotype.
Step-by-Step Reasoning
- 15 : 41 in Europe and 10 : 31 in North America are both close to 1 : 3 (typical : melanic).
- A 3 : 1 ratio (melanic : typical) only arises when the more common phenotype is dominant and both parents are heterozygous.
- Therefore the melanic allele is dominant in both populations.
Key Takeaways
The same 3 : 1 offspring ratio in two populations implies the same dominance relationship between the alleles.
Common Mistakes
- Concluding that the alleles themselves are identical, rather than that they show the same dominance. The next part of the question explores exactly this distinction.
- Saying 'the gene is the same' or 'the populations are the same' — the data only tell us about dominance.
Things to Be Careful About
The conclusion is about the dominance relationship, not about the alleles being the same DNA sequence. The mark-scheme wording is 'it / (melanic) allele, is dominant'.
Researchers did not know if the allele causing the melanic form in European moths occurred at the same locus as the allele causing the melanic form in North American moths. To find out, they carried out the following crosses:
• Cross 1: European moths that were heterozygous at the European melanic locus only were crossed with North American moths that were heterozygous at the North American melanic locus only.
• Cross 2: The melanic and the typical offspring of cross 1 were mated together.
Answer
The melanic (dominant) phenotype moths are crossed with the homozygous recessive (typical, aa) moths from cross 1.
The melanic (dominant phenotype) is crossed with the homozygous recessive (typical).
Background Concept
A test cross is a genetic cross between an individual showing the dominant phenotype and an individual known to be homozygous recessive. It is used to determine whether the dominant individual is homozygous (AA) or heterozygous (Aa). AA × aa gives 100% dominant offspring; Aa × aa gives 1 : 1 dominant : recessive.
Understanding the Question
In cross 2, the melanic offspring of cross 1 (dominant phenotype) are mated with the typical offspring of cross 1 (homozygous recessive, aa). The setup is the textbook definition of a test cross: dominant phenotype × homozygous recessive.
Approach
Identify the two key ingredients of a test cross: the unknown-dominant-phenotype parent and the known-homozygous-recessive parent. Match them to the moths in cross 2.
Step-by-Step Reasoning
- The melanic phenotype is dominant (established in parts a and b).
- The typical phenotype is homozygous recessive (aa).
- Cross 2 mates melanic × typical = dominant phenotype × homozygous recessive, which is the definition of a test cross.
- The test cross will reveal the genotype of each melanic parent (AA gives 100% melanic offspring; Aa gives 1 : 1 melanic : typical).
Key Takeaways
A test cross is always between a dominant-phenotype individual (whose genotype is unknown) and a homozygous-recessive individual. The offspring ratio then identifies the unknown genotype.
Common Mistakes
- Saying it is a test cross simply because the parents have different phenotypes. The defining feature is the use of a homozygous recessive partner.
- Confusing which parent is the unknown (it is the dominant-phenotype one) and which is the known (it is the homozygous-recessive one).
Things to Be Careful About
- The 'typical' parent is the homozygous recessive, because 'typical' is the recessive phenotype (aa).
- The test cross result is informative because the homozygous recessive can only contribute an a allele, so all the variation in the offspring comes from the other parent.
Complete Table 10.1 to show the predicted results if:
• the European and North American melanic alleles are on the same locus (A/a)
• the European and North American melanic alleles are on two different loci (A/a and B/b).
Table 10.1
| same locus (A/a) | different loci (A/a and B/b) | |
|---|---|---|
| genotypes of melanic moths from cross 1 | ||
| proportion of test crosses (cross 2) giving 100% melanic offspring |
Answer
| same locus (A/a) | different loci (A/a and B/b) | |
|---|---|---|
| genotypes of melanic moths from cross 1 | AA, Aa (aA) | AaBb, Aabb, aaBb |
| proportion of test crosses (cross 2) giving 100% melanic offspring | 1 in 3 | none / 0 |
Same locus: melanic genotypes AA, Aa; 1 in 3 test crosses give 100% melanic. Different loci: melanic genotypes AaBb, Aabb, aaBb; no test cross gives 100% melanic.
Background Concept
A test cross between AA and aa gives 100% Aa (all dominant); between Aa and aa it gives 1 : 1 dominant : recessive. The proportion of test crosses yielding 100% dominant offspring is therefore the proportion of dominant parents that are homozygous. With two independent loci (A/a and B/b), an individual that is heterozygous at one locus still gives only 50% dominant offspring when crossed with the double-recessive aabb.
Understanding the Question
Cross 1 is a cross between a European moth heterozygous only at the European melanic locus and a North American moth heterozygous only at the North American melanic locus. Two scenarios are being compared:
- Same locus (A/a): the European and North American melanic alleles are alternative alleles of the same gene.
- Different loci (A/a and B/b): the European and North American melanic alleles are alleles of two different genes.
For each scenario, the table must give (1) the genotypes of the melanic offspring from cross 1, and (2) the proportion of test crosses (cross 2, with a typical moth) that give 100% melanic offspring.
Approach
- Same-locus case: cross 1 is a monohybrid Aa × Aa. The 3 : 1 split gives AA, Aa, Aa (melanic) and aa (typical). A test cross of each melanic genotype with aa reveals that only AA gives 100% melanic — 1 in 3 of the melanic offspring.
- Different-loci case: cross 1 is Aabb × aaBb (each parent heterozygous only at one locus). The offspring are 1/4 each of AaBb, Aabb, aaBb, aabb. Each of the three melanic genotypes is heterozygous at at least one locus, so none of the test crosses with aabb give 100% melanic offspring.
Step-by-Step Reasoning
Same locus (A/a):
- Cross 1: Aa × Aa → 1 AA : 2 Aa : 1 aa.
- Melanic offspring: AA, Aa, Aa (i.e. AA, Aa and aA, but aA is just Aa).
- Test cross (× aa):
- AA × aa → all Aa (melanic) — 100% melanic.
- Aa × aa → 1 Aa : 1 aa — only 50% melanic.
- 1 of the 3 melanic genotypes gives 100% melanic → 1 in 3.
Different loci (A/a and B/b):
- European parent (heterozygous only at European locus): Aabb.
- North American parent (heterozygous only at North American locus): aaBb.
- Cross 1: Aabb × aaBb → 1/4 AaBb : 1/4 Aabb : 1/4 aaBb : 1/4 aabb.
- Melanic offspring: AaBb, Aabb, aaBb (each 1/3 of the melanic moths).
- Test cross (× aabb):
- AaBb × aabb → 1/4 each of AaBb, Aabb, aaBb, aabb — 3/4 melanic, not 100%.
- Aabb × aabb → 1/2 Aabb : 1/2 aabb — 1/2 melanic.
- aaBb × aabb → 1/2 aaBb : 1/2 aabb — 1/2 melanic.
- None of the test crosses give 100% melanic → none / 0.
Key Takeaways
- A 100%-melanic test cross only happens when the melanic parent is homozygous at every locus that contributes to melanism.
- In the same-locus model, 1/3 of the melanic parents (the AA) are homozygous.
- In the different-loci model, every melanic parent is heterozygous at one of the two loci, so the test cross always produces some typical offspring.
Common Mistakes
- Forgetting that in the different-loci model, the test-cross partner is aabb (homozygous recessive at both loci), not just aa.
- Concluding that the Aabb or aaBb test crosses give 100% melanic just because those parents are 'homozygous' at one locus. They are still heterozygous at the other locus, so half the offspring are aabb.
- For the same-locus case, mixing up the ratio and saying 2 in 3 or 1 in 2. Only the AA parent (1 of the 3 melanic offspring) gives 100% melanic.
Things to Be Careful About
- The 'European heterozygous at European locus only' parent must be Aabb (or its equivalent), with the typical allele at the North American locus. The wording is precise: heterozygous at one locus only.
- For the 'same locus' column, the test cross partner is aa. For the 'different loci' column, the test cross partner is aabb.
- The ratio 1/3 comes from the 3:1 split of cross 1 in the same-locus case: 1 AA out of 3 melanic offspring.
A light trap was used to estimate the total size of a population of B. betularia in a woodland. On night one, 24 moths were captured. These were marked with a small spot of harmless paint. On night two, 29 moths were captured, and 8 of these showed a spot of paint.
Use the Lincoln index formula provided to calculate the size of the population.
Show your working.
Key to symbols:
= estimate of population size
= number of individuals captured in first sample
= number of individuals (both marked and unmarked) captured in second sample
= number of marked individuals recaptured in second sample
population size = ______
Working
Answer
Population size = 87
87
Background Concept
The Lincoln index (also called the Petersen estimate or mark-recapture method) is a way of estimating the size of a mobile animal population. A first sample is captured, marked, and released. A second sample is then captured, and the proportion of marked individuals in the second sample is taken to equal the proportion of marked individuals in the whole population. The rearranged relationship gives the formula
The method assumes that the population is closed (no births, deaths, immigration, or emigration between the two samples), that marking does not affect an individual's survival or behaviour, and that marked and unmarked individuals mix randomly.
Understanding the Question
24 moths were caught on night one, marked with a spot of paint, and released. On night two, 29 moths were caught and 8 of them carried a paint mark. The question supplies the Lincoln index formula and the symbols, and asks for the population size estimate.
Approach
Match the data to the symbols, substitute into the formula, and evaluate.
Step-by-Step Reasoning
- n1 = 24 (first sample, marked and released).
- n2 = 29 (second sample, both marked and unmarked).
- m2 = 8 (marked individuals in the second sample).
- Substitute:
- The estimated population size is 87 moths.
Key Takeaways
- The Lincoln index N = (n1 × n2) / m2 is the standard mark-recapture formula.
- n1 is the number marked and released; n2 is the size of the second sample; m2 is the number of marked individuals in that second sample.
- The result is an estimate; its reliability depends on the assumptions being met (closed population, no effect of marking, random mixing).
Common Mistakes
- Confusing m2 with the total number of marked individuals in the population. m2 is only the number of marked individuals recaptured in the second sample.
- Treating n1 as the total population size. It is only the size of the first sample.
- Forgetting to divide by m2, or dividing the wrong way round.
- Giving the answer with units (the answer is a number of individuals; no unit is needed).
Things to Be Careful About
- 696 / 8 should give an exact whole number (87). If the calculation gives a non-integer, double-check the arithmetic.
- The mark-recapture method gives an estimate, not an exact count. In a closed exam question the numerical answer is the one required, but in real ecological work a confidence interval or repeat samples would be used to gauge uncertainty.
- The paint spot must be harmless and not affect behaviour or survival, otherwise the assumption of equal catchability is broken and the estimate becomes biased.