Biology 9700/42 — October/November 2024
Cambridge A-Level · A Level Structured Questions · worked solutions for every part, with the mark scheme
Topics Selection and Evolution · Inheritance · Genetic Technology · Energy and Respiration · Photosynthesis · Control and Coordination · +2 more
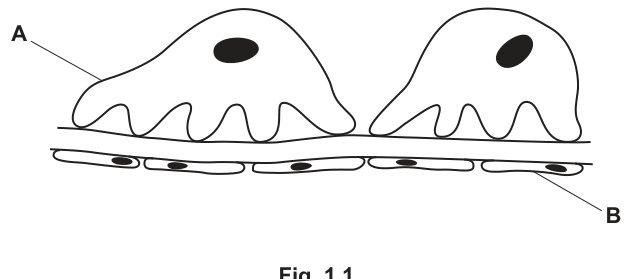
Fig. 1.1 is a diagram of part of a Bowman’s capsule and a glomerular capillary.
No worked solution for this part yet — the official mark scheme is linked at the top of the page.
The glomerular filtrate is produced in the Bowman’s capsule by the process of ultrafiltration.
State the conditions required for ultrafiltration.
No worked solution for this part yet — the official mark scheme is linked at the top of the page.
As the newly formed glomerular filtrate passes along the proximal convoluted tubule, selective reabsorption takes place. The fluid remaining in the proximal convoluted tubule eventually forms urine.
Table 1.1 lists three of the components of blood plasma that enter the glomerulus in a healthy person.
Complete Table 1.1 by writing:
• increased, if the component is present and is higher in concentration than in blood plasma
• decreased, if the component is present and is lower in concentration than in blood plasma
• same, if the component is present and is of the same concentration as blood plasma
• not present, if the component is absent.
You may use each response once, more than once or not at all.
Table 1.1
| component of blood plasma entering glomerulus | component in newly formed glomerular filtrate | component in urine |
|---|---|---|
| glucose | ||
| large plasma proteins | ||
| urea |
No worked solution for this part yet — the official mark scheme is linked at the top of the page.
Sweating during exercise can lead to a response in the posterior pituitary gland and in the kidney.
State the response to sweating that occurs in the posterior pituitary gland and the response that occurs in the kidney.
No worked solution for this part yet — the official mark scheme is linked at the top of the page.
Several different processes can affect allele frequencies in populations.
Answer
Any six of the following:
-
Mutation — changes the base sequence of DNA and so introduces new alleles into the gene pool, which can be acted on by the other processes.
-
Genetic drift — random, chance changes in allele frequency, especially in small populations, because the alleles passed on depend on which individuals happen to survive and reproduce.
-
Founder effect — a small group becomes isolated from the main population and founds a new population; the allele frequencies in the founder group are not representative of the original, so the new population has shifted allele frequencies.
-
Bottleneck effect — a large, sudden fall in population size (e.g. disease or natural disaster) leaves only a small, non-representative sample, so the surviving population has altered allele frequencies.
-
Natural selection — directional or disruptive selection increases the frequency of alleles that confer a selective advantage in a particular environment (or, for disruptive selection, favours both extremes of a range).
-
Migration / gene flow — individuals (or gametes) move between populations and interbreed, carrying their alleles with them, so the allele frequencies of both donor and recipient populations change.
-
Genetic recombination — independent assortment and crossing over during meiosis break linkage groups and produce new combinations of alleles in gametes, increasing the genetic variation on which the other processes act.
Six processes that may affect allele frequencies in a wildlife population: mutation; genetic drift; founder effect; bottleneck effect; natural selection (directional or disruptive); migration / gene flow. (Genetic recombination is also acceptable.)
Background Concept
A population is a group of organisms of the same species living in the same area and capable of interbreeding. Each population carries a gene pool — the complete set of alleles of every gene in that population — and the relative frequencies of those alleles are called the allele frequencies.
These frequencies are not static. Several processes can change them, generating or removing genetic variation and shifting the population away from (or back towards) Hardy–Weinberg equilibrium. Because the question specifies a wildlife population, artificial selection is not relevant and is explicitly rejected by the mark scheme.
The processes fall into three broad categories:
- Mechanisms that create new variation — mutation, genetic recombination.
- Mechanisms that change frequencies randomly (no selection) — genetic drift, founder effect, bottleneck effect.
- Mechanisms that change frequencies non-randomly (because of selection or movement) — natural selection, migration / gene flow.
Understanding the Question
The command word is "outline" — give the main features briefly, without going into full detail. You need to identify six processes that may change allele frequencies in a wildlife population, and give a short one-clause description of each. The mark scheme lists eight creditable points, and any six earn full marks, so you have some flexibility about which six you include.
Be precise with terminology: the mark scheme explicitly rejects "artificial selection" and "stabilising selection" for this question. If you mention selection, it must be directional or disruptive.
Approach
- List the processes you can confidently describe.
- For each, write a single short sentence that captures the mechanism and how it changes allele frequencies.
- Choose six that together cover the range of mechanisms (variation-generating, random, non-random) — this shows the examiner that you understand the different ways allele frequencies can shift.
Step-by-Step Reasoning
1. Mutation. A mutation is a change in the base sequence of DNA. It can create a new allele where none existed before, and so changes the allele frequencies of the gene pool. Mutation is the ultimate source of all genetic variation on which the other processes act.
2. Genetic drift. Random change in allele frequency that occurs because the individuals that happen to survive and reproduce do not pass on a perfectly representative sample of the gene pool. The smaller the population, the more pronounced the effect — some alleles may be lost entirely, others may reach fixation, purely by chance.
3. Founder effect. A special case of genetic drift: a small number of individuals colonise a new area and found a new population. The allele frequencies in that new population are determined by the (non-representative) genotypes of the founders, and can differ markedly from the parent population.
4. Bottleneck effect. Another special case of genetic drift: a large, sudden fall in population size (e.g. disease, volcanic eruption, severe winter) leaves only a small, non-representative sample of the original gene pool. Allele frequencies in the survivors — and in the population as it rebuilds — are shifted by chance.
5. Natural selection. The non-random differential survival and reproduction of individuals because their phenotypes are better adapted to the environment. Directional selection shifts the mean phenotype (and the underlying allele frequencies) in one direction. Disruptive selection favours both extremes of a range at the expense of intermediates, so two divergent allele sets are maintained. The mark scheme ignores artificial and stabilising selection here.
6. Migration / gene flow. When individuals (or their gametes, in plants) move between populations and interbreed, they carry their alleles with them. The donor population loses those alleles (or some of them), and the recipient gains them, so the allele frequencies of both populations shift.
7. Genetic recombination. During meiosis, independent assortment of homologous chromosomes and crossing over between non-sister chromatids of homologues produce new combinations of alleles in the gametes. Different combinations of alleles appear in the offspring, and this is the genetic variation on which the other processes can act. (Note: recombination does not create new alleles — it merely reshuffles existing ones.)
Key Takeaways
- Allele frequencies are not static; they can be changed by mutation, genetic drift (including founder and bottleneck effects), natural selection, migration / gene flow and genetic recombination.
- Genetic drift, founder effect and bottleneck effect are random processes — they change allele frequencies with no reference to whether the alleles are advantageous.
- Natural selection is non-random — allele frequencies change because particular alleles give a survival/reproductive advantage.
- The smaller the population, the faster allele frequencies can be moved by random (non-adaptive) processes.
Common Mistakes
- Writing artificial selection or stabilising selection — both are explicitly rejected by the mark scheme here, because the question specifies wildlife populations.
- Confusing founder effect and bottleneck effect — both are forms of genetic drift, but the founder effect involves a small number of individuals starting a new population, whereas the bottleneck effect involves a sudden reduction in size of an existing population.
- Describing the processes in general terms ("evolution happens", "natural selection acts on variation") rather than linking them directly to allele frequencies.
- Confusing mutation with genetic recombination — mutation creates new alleles; recombination only reshuffles existing ones.
Things to Be Careful About
- Use the technical term ("genetic drift", "founder effect", "bottleneck effect", "gene flow") rather than just describing the situation, because the terms themselves are usually the mark.
- For natural selection, the mark scheme accepts directional or disruptive but not stabilising or artificial.
- Mutation is the only mechanism that creates new alleles — recombination only rearranges existing ones, but in doing so it produces new genotypes.
- You only need six points for six marks; do not pad your answer with weak or incorrect extra material that the examiner will then not credit.
The process of selective breeding changes allele frequencies in a population. Plant breeders use selective breeding to improve crop plants such as maize.
Explain how selective breeding can be used to obtain a variety of maize where the plants are vigorous and of uniform height.
Answer
- Inbreed maize plants (self-pollinate or cross closely related individuals) for many generations to produce homozygous, genetically uniform lines, so the plants are of uniform height.
- Outbreed by crossing two different inbred lines to hybridise them.
- The F1 hybrid offspring are all heterozygous at every locus, and the increased heterozygosity gives hybrid vigour (faster, more vigorous growth).
Inbreed to produce homozygous, uniform lines; then outbreed (cross two inbred lines) to produce F1 hybrid offspring that are heterozygous and show hybrid vigour.
Background Concept
Selective breeding (also called artificial selection) is the deliberate choice by humans of which individuals in a population are allowed to reproduce, in order to shift the population's gene pool towards a desired combination of traits. Two genetic conditions are central:
- Homozygosity — both alleles at a locus are identical. A homozygous plant breeds true: all its gametes carry the same allele at that locus, so all its offspring are genetically identical at that locus.
- Heterozygosity — the two alleles at a locus are different. Heterozygotes often show hybrid vigour (also called heterosis): they grow faster, are larger, and are more robust than either parental line, because the masking of deleterious recessive alleles and the complementary action of different alleles both contribute.
Understanding the Question
The question has a deliberate tension. Uniform height requires genetic similarity between plants — they must all carry the same alleles for the height-controlling genes. But vigour requires genetic diversity — at least some loci must be heterozygous, because the F1 hybrid of two different inbred lines is what produces hybrid vigour. The candidate has to explain how a single breeding programme satisfies both requirements.
The mark scheme rewards the linked ideas: inbreeding → homozygosity → uniformity, and outbreeding / hybridisation → F1 heterozygosity → vigour.
Approach
- Start with the trait that needs uniformity (height) and identify the genetic state that gives it: homozygosity.
- Identify the breeding method that fixes homozygosity: inbreeding.
- Then identify what is needed for vigour: heterozygosity, via crossing two different homozygous lines.
- Bring the two together: inbreed to make pure-breeding parental lines, then cross the lines to get uniform-but-vigorous F1 hybrid seed.
Step-by-Step Reasoning
1. Inbreeding. Inbreeding is the crossing of closely related individuals — in maize this is done by self-pollination (transferring pollen from a flower to the silks of the same plant, or to a genetically very similar plant). Generation after generation, this drives the offspring towards homozygosity at all loci, because each parent can only pass on one of its two alleles and similar parents pass on similar alleles. After several generations, each plant is essentially homozygous at every locus.
2. Homozygous lines are uniform. A homozygous plant is genetically identical (at every locus) to every other plant in the same inbred line, so all the plants in that line have the same height-controlling alleles and are of uniform height.
3. Outbreeding / hybridisation. Two different inbred lines (each homozygous and uniform but for different alleles) are then crossed by deliberate hybridisation — the breeder transfers pollen from one inbred line to the silks of the other. All the F1 offspring receive one allele from line A and one from line B at every locus, so they are all heterozygous at every locus.
4. F1 hybrid vigour. Because the F1 plants are all heterozygous (and genetically identical to one another), they are both uniform and vigorous. The heterozygosity produces hybrid vigour: the F1 plants grow faster, larger and more robustly than either of the parental inbred lines. This is why farmers buy new F1 hybrid maize seed every year rather than saving seed from their own crop — the F2 generation would segregate (different F2 plants would inherit different combinations of the parental alleles), losing both uniformity and vigour.
Key Takeaways
- Inbreeding → homozygosity → genetic uniformity → uniform height.
- Outbreeding / hybridisation of two inbred lines → F1 heterozygosity → hybrid vigour.
- The two processes are used in sequence in the same breeding programme: first inbreed to make pure lines, then cross the lines to make F1 hybrid seed.
- F1 hybrid vigour is lost in the F2 generation, so commercial hybrid seed must be re-produced every year by re-crossing the parental inbred lines.
Common Mistakes
- Describing only inbreeding — this gives uniformity but not vigour. The question requires both targets, and the marks are split across both methods.
- Describing only outbreeding — this can give vigour, but without first inbreeding the parental lines, the F1 offspring will not be uniform.
- Getting the genetic relationship the wrong way round — writing "outbreeding produces homozygosity" or "inbreeding produces vigour". The relationships go the opposite way.
- Mentioning stabilising selection or natural selection — this is selective breeding (artificial), and the breeding process is inbreeding followed by outbreeding, not natural selection.
- Failing to identify the F1 generation specifically — the mark scheme gives credit for linking the F1 to heterozygosity and to vigour.
Things to Be Careful About
- Keep the genetic terms straight: homozygous (identical alleles) versus heterozygous (different alleles).
- Recognise that uniformity and vigour are not contradictory in the F1 — uniformity comes from the F1 plants being genetically identical to one another, while vigour comes from them being heterozygous at each locus. Both conditions hold simultaneously.
- The mark scheme does not require the technical term "heterosis" — it accepts "hybrid vigour" or a simple description — but using "hybrid vigour" makes the link to heterozygosity explicit and shows clear understanding.
- Note that F1 hybrid seed is uniform only as a generation; the individual plants in the F1 generation are genetically identical to one another but genetically different from both parental inbred lines.
The treatment of many diseases has been improved by the use of genetic technology in medicine.
Answer
Genetic engineering is the manipulation of genetic material (genes / DNA) so that a gene/allele is transferred into a cell or organism, where it is expressed to modify the phenotype or produce a (new) protein.
Manipulation of genetic material / gene / DNA; transfer of a gene / allele into a cell or organism; expression of that gene to modify the phenotype or produce a protein.
Background Concept
Genetic engineering (recombinant DNA technology) is the deliberate alteration of the genetic makeup of an organism by introducing, removing or modifying DNA. Three ideas must all be present: something is done to the DNA itself (manipulation); that DNA is moved into a host cell or organism; and once inside, it is expressed (transcribed and translated) so that the host gains a new characteristic or makes a new protein. Common laboratory steps include cutting DNA with restriction endonucleases, joining fragments with DNA ligase, and using a vector (typically a plasmid or a virus) to carry the recombinant DNA into the recipient. The result is often described as a genetically modified organism (GMO), and the field now also includes gene editing (e.g. CRISPR/Cas9) where the existing DNA sequence is changed in situ rather than a new gene being added.
Understanding the Question
Part (a) is a 3-mark "explain" command-word item. The mark scheme asks for any three of: manipulation of DNA, transfer into a cell/organism, expression, modified phenotype / new protein, or an additional valid point (such as the possibility of producing a GMO). The candidate must say enough to convince the examiner that the technique is intentional, that DNA is the material being worked on, and that a tangible biological outcome follows.
Approach
Write a short, single-sentence (or compact) definition that explicitly mentions the three linked ideas: (1) the material acted on (DNA/gene/allele), (2) what is done to it (manipulation/transfer), and (3) what happens as a result (expression, leading to a new protein or phenotype change). Mirror the language of the mark scheme.
Step-by-Step Reasoning
- Point 1 – Manipulation: genetic engineering involves deliberately changing (manipulating) genetic material – gene, allele or DNA. This is the defining feature that separates it from selective breeding.
- Point 2 – Transfer: the manipulated gene/allele is moved into a recipient cell or organism, typically using a vector (plasmid or virus) or physical methods.
- Point 3 – Expression: once inside, the gene is transcribed and translated; this is the key step that produces the biological effect.
- Point 4 – Outcome: the cell/organism now produces a (new) protein or shows a modified phenotype – e.g. a bacterium making human insulin, a crop resistant to herbicide, or – relevant to this paper – production of a missing functional protein in a human disease.
Key Takeaways
- Genetic engineering = deliberate change to an organism's DNA, expressed as a new protein or phenotype.
- It is distinct from selective breeding (no DNA is moved) and from gene therapy (where the new DNA is added to a patient for medical benefit).
- Modern genetic technology also includes gene editing – changing the existing DNA in place, rather than adding foreign DNA.
Common Mistakes
- Saying only that "DNA is changed" without mentioning transfer into another cell or expression – loses 2 of the 3 marks.
- Confusing genetic engineering with cloning (cloning copies an entire genome; engineering changes specific DNA).
- Writing "modification of genes" alone – the mark scheme requires that the result is a transferred, expressed gene.
Things to Be Careful About
- Use the precise term "genetic material / gene / allele / DNA" – avoid vague phrases like "the genetics of an organism".
- For full marks, the definition must link manipulation + transfer + expression in a single, integrated answer.
Leber Congenital Amaurosis (LCA) is an inherited eye disease. In LCA, the photoreceptor cells in the retina die at an early age. This causes impaired vision (reduced eyesight) in children, which can progress to blindness.
Mutations in different genes cause different forms of LCA. One form of this disease, LCA2, is caused by a mutation in the RPE65 gene. Gene therapy has been used to treat LCA2.
Outline how an inherited eye disease, such as LCA2, is treated with gene therapy.
Answer
- A healthy / functional copy of the RPE65 gene is inserted into a (harmless) virus (e.g. adeno-associated virus, AAV) which acts as the vector.
- The virus carrying the RPE65 gene is injected into the eye so it reaches the photoreceptor cells.
- The RPE65 gene is integrated into the genome / DNA of the photoreceptor cells.
- The gene is expressed, producing functional RPE65 protein so the photoreceptor cells work correctly.
Functional RPE65 gene added to a viral vector; virus injected into the eye; gene integrated into photoreceptor DNA; gene expressed to make functional protein.
Background Concept
Gene therapy is a form of genetic engineering in which a functional copy of a defective gene is delivered into the somatic (body) cells of a patient to treat an inherited disease. Two broad strategies exist: in vivo, where the gene is delivered directly into the patient's tissues (as in LCA2), and ex vivo, where cells are removed, modified in culture and returned. The most successful in-vivo delivery uses viral vectors – especially the adeno-associated virus (AAV) – because viruses have evolved to enter human cells efficiently. The viral genes are removed so the virus cannot replicate, and a therapeutic gene is inserted in their place. Once inside the target cell, the gene is expressed and produces the missing functional protein.
Understanding the Question
LCA2 is caused by a recessive loss-of-function mutation in RPE65, a gene required by retinal photoreceptor cells. The candidate is asked to outline, in any coherent order, how gene therapy is used to treat an inherited eye disease. The mark scheme rewards four clear steps: vector preparation, delivery, integration, and expression – and accepts an additional credit such as naming AAV or the licensed drug voretigene neparvovec.
Approach
Write a brief, ordered narrative: (1) prepare a virus carrying a healthy gene, (2) inject it into the eye, (3) the gene integrates into the photoreceptor DNA, (4) the gene is expressed to make functional protein. Avoid drifting into discussion of how LCA2 is inherited – the question is about treatment, not about genetics.
Step-by-Step Reasoning
- Vector construction: Start with a harmless virus (commonly AAV) and insert a healthy, functional copy of the RPE65 gene into its genome. Removing the viral replication genes means the virus can no longer cause disease.
- Delivery: The engineered virus is injected directly into the eye (e.g. sub-retinal injection) so that it physically reaches the photoreceptor cells. AAV has good tropism for retinal cells, which is one reason it is used.
- Integration / persistence: Once inside the cell, the RPE65 gene enters the nucleus and is integrated into the host cell's DNA (or, for some vectors, persists episomally) so it is passed on to daughter cells after division.
- Expression: Transcription and translation produce functional RPE65 protein, restoring the biochemical pathway the photoreceptor needs to detect light. Vision therefore improves.
- Optional extra credit: Naming AAV, or naming the first FDA-approved ocular gene-therapy drug voretigene neparvovec (Luxturna) used for LCA2.
Key Takeaways
- A virus is used as a vector because it naturally enters human cells and delivers DNA.
- The injected gene is added to photoreceptor cells of the retina, where it makes the missing RPE65 protein.
- The first licensed ocular gene-therapy product (voretigene neparvovec) targets RPE65 and is therefore a direct real-world example of the technique.
Common Mistakes
- Saying "the virus replaces the faulty gene in the DNA" – the virus delivers a new copy; it does not edit the original in situ. (That is what CRISPR/Cas9 does in part (c)(ii).)
- Confusing the eye and the brain (LCA is a retinal disease, not a cortical one).
- Describing gene therapy for SCID (bone-marrow stem cells) – that is a different application with different logistics.
Things to Be Careful About
- The mark scheme requires integration into the genome / DNA for the third mark; saying only that the gene "enters the cell" is not enough.
- The eye in LCA2 has photoreceptor cells in the retina; the gene is delivered to these cells, not to every cell of the body.
Answer
The eye is small and easily accessible, so only a small volume of treatment is needed and the virus can be injected directly to the target tissue.
The eye is small / easily accessible, so only a small amount of vector is needed and it can be injected directly.
Background Concept
The eye has several properties that make it unusually well suited as a target organ for gene therapy. It is a small, enclosed, well-defined anatomical compartment; it is easy to access surgically (and the contralateral eye provides an internal control); it has a degree of immune privilege (the blood–retinal barrier and lack of lymphatic drainage dampen inflammatory responses to viral vectors); and diseases of the retina can be monitored very precisely using non-invasive imaging and visual-acuity tests. Together these features mean that a small dose of vector can be delivered to a defined cell population, the risk of systemic side effects is reduced, and improvements can be measured directly.
Understanding the Question
The candidate is asked to suggest why the eye is a suitable organ for gene therapy. "Suggest" means the answer is not in the passage and the candidate is expected to apply biological reasoning. The mark scheme accepts any one of three points: ease of access / injection, low risk of immune response, or the small size of the eye (so little vector is needed). A 1-mark item, only one clearly expressed point is required.
Approach
Pick the most convincing single reason and state it concisely, using precise biological language. "Easily accessible so the virus can be injected" is the safest single mark; adding a second reason as a hedge does not earn extra marks but costs nothing.
Step-by-Step Reasoning
- Accessibility: the eye is a small, surface-near organ; injection of a viral vector is a routine clinical procedure (e.g. intravitreal or sub-retinal injection). The eye not treated can serve as an internal control (this is exploited in the LCA10 trial in part (c)).
- Immune privilege: the retina is protected by the blood–retinal barrier, so the immune response to the vector is weaker than it would be in, say, the liver or muscle, allowing the vector to persist and the gene to be expressed.
- Small size: because the eye is small, only a small volume of expensive vector is needed to reach therapeutic dose – a practical and economic advantage.
Key Takeaways
- For a 1-mark "suggest" item, a single well-expressed biological point is enough; do not write a long list.
- The eye is a model organ for early gene-therapy trials because it is small, accessible, immune-privileged and easy to monitor.
Common Mistakes
- Giving a vague answer such as "it is a good place for treatment" – examiners want a specific biological reason (e.g. easy to inject, low immune risk, small volume needed).
- Saying the eye is "important for sight" – that is true but not a reason why the eye is suitable for gene therapy.
Things to Be Careful About
- A "suggest" answer must be a biological justification, not merely a description of the eye.
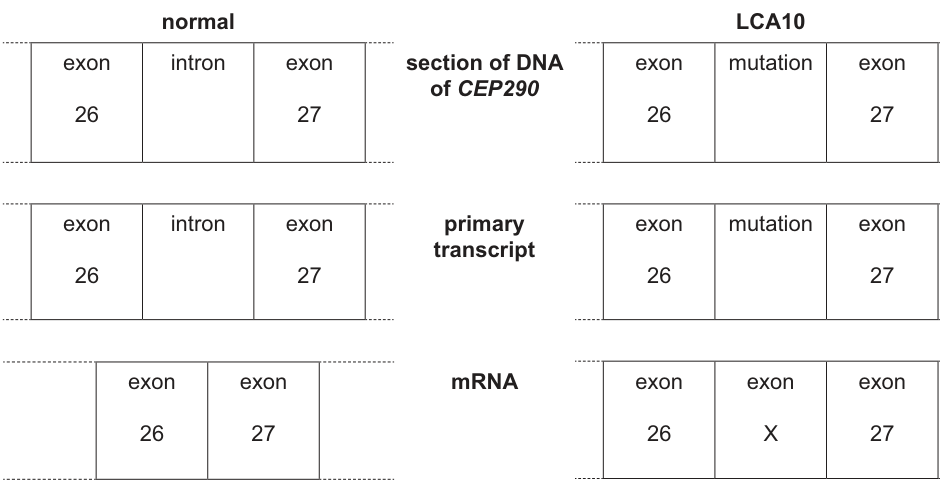
LCA10 is a different form of LCA caused by a recessive mutation in the CEP290 gene. This gene codes for the protein CEP290, which is involved in the correct functioning of photoreceptor cells in the retina.
The mutation in CEP290 causes an error to be made when the primary transcript is spliced to form messenger RNA (mRNA). The abnormal mRNA that is formed has an extra sequence of RNA nucleotides, known as exon X, between exon 26 and exon 27. Exon X contains a STOP codon.
Fig. 3.1 compares the effect of the mutation in CEP290 with the normal gene expression.
In 2022, research was carried out into possible treatment of LCA10 using genetic technology.
A human clinical trial investigated a treatment of LCA10 using a short RNA nucleotide sequence known as Sepofarsen.
Sepofarsen binds to the section of the primary transcript containing the CEP290 mutation so that normal splicing occurs and functional CEP290 protein is synthesised.
• People in the clinical trial received regular treatment with Sepofarsen to the eye with the greatest loss of vision (treated eye) for a period of 12 months.
• Changes in the light perception (visual acuity) of both eyes were measured using a vision chart.
• A negative change in the visual acuity score shows an improvement in visual acuity.
Fig. 3.2 shows the results of the clinical trial over 12 months.
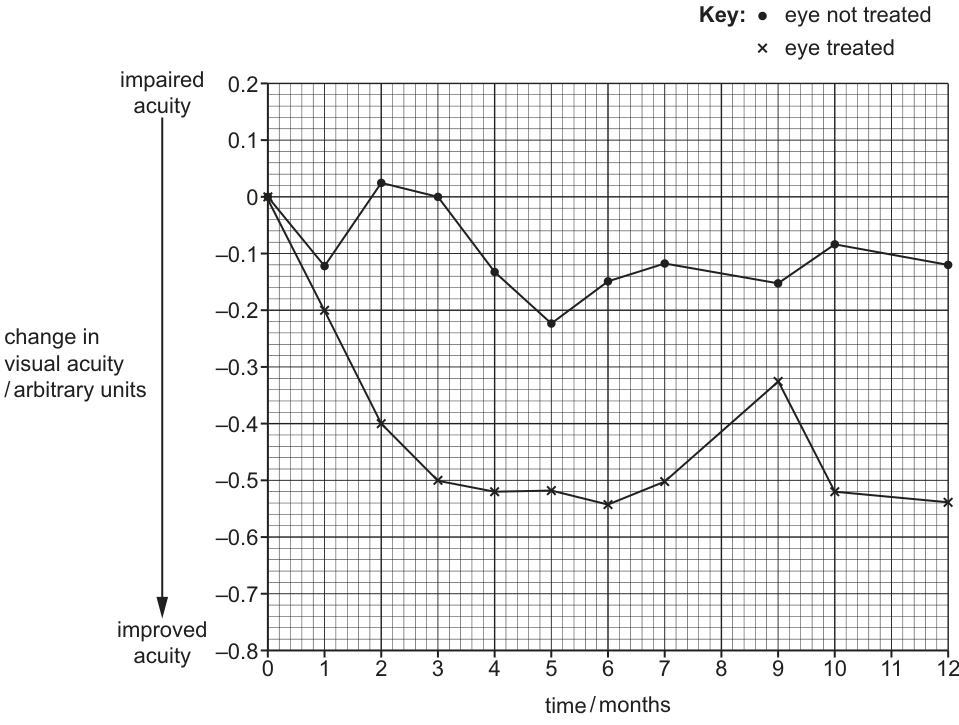
Describe the results of the clinical trial data shown in Fig. 3.2.
Answer
- Both eyes show an overall improvement in visual acuity (the change in acuity becomes more negative over 12 months).
- The treated eye shows a greater improvement than the untreated eye, e.g. at 1 month the treated eye was −0.20 arbitrary units while the untreated eye was −0.12, and at 2 months the treated eye reached −0.40 while the untreated eye was +0.02.
- The treated eye improves sharply between 0 and 2 months, then plateaus at about −0.5 until month 12.
- At month 9 the treated eye shows an anomalous rise to about −0.33, which does not fit the overall trend; the untreated eye stays close to 0 throughout.
Both eyes show overall improvement; the treated eye improves more than the untreated eye; the treated eye improves sharply by month 2 then plateaus; the month 9 result for the treated eye is anomalous.
Background Concept
LCA10 is caused by a recessive mutation in CEP290; the mutation creates a faulty splice site so that an extra exon (exon X) containing a STOP codon is inserted between exon 26 and exon 27 of the mRNA. The resulting protein is truncated and non-functional. Sepofarsen is a short, single-stranded antisense oligonucleotide (an RNA-based drug) that binds to the mutated region of the CEP290 primary transcript and re-directs splicing so that exon X is excluded and the normal mRNA – and therefore functional CEP290 protein – is produced. It is a form of mRNA-targeted therapy: the DNA itself is not changed.
Clinical trials in inherited retinal disease routinely use the untreated fellow eye as an internal control, both for ethical reasons (every patient receives an active treatment) and because the disease is typically symmetric. The outcome measure here is change in visual acuity in arbitrary units measured on a vision chart; a more negative value indicates better vision (the y-axis on Fig. 3.2 is reversed, with "impaired acuity" at the top and "improved acuity" at the bottom).
Understanding the Question
Part (c)(i) is a 3-mark "describe" item based on Fig. 3.2. The mark scheme accepts any three of: (1) overall improvement in both eyes, (2) the treated eye improves more than the untreated eye, (3) reference to the anomalous point at month 9, (4) a data quote giving values of one eye at two months OR values of both eyes at one month. The candidate must read the graph accurately, including its reversed y-axis.
Approach
Plan four short observations:
- State the overall trend for both eyes (improvement = more negative values).
- State the relative comparison (treated > untreated).
- Mention the shape of the treated-eye curve and the anomaly at month 9.
- Include a numerical data quote with units.
Step-by-Step Reasoning
- Both eyes improve overall: the change in acuity becomes negative for both eyes over 12 months, i.e. both eyes end up below 0; remember that a more negative value means better vision (reversed y-axis).
- Treated eye improves more: at every time point after 0 the treated eye is below (more negative than) the untreated eye. A clean data quote is at 1 month: untreated = −0.12, treated = −0.20, or at 2 months: untreated = +0.02, treated = −0.40.
- Shape of the treated-eye curve: there is a steep improvement between 0 and 2 months (from 0 to −0.40), then the curve plateaus at about −0.5 between months 2 and 12, with one transient worsening at month 9.
- Anomaly at month 9: the treated eye rises to about −0.33 at month 9 (less improved), then falls back to −0.54 by month 10. This single point does not fit the surrounding trend and is described in the mark scheme as an anomalous result.
- Untreated eye: stays near 0 throughout (range roughly 0 to −0.22), with a slight downward drift.
Key Takeaways
- "Describe a graph" questions reward four ingredients: overall trend, comparative trend, shape / turning points, anomalies, and at least one accurate data quote with units.
- Always check the orientation of the y-axis: here a "more negative" value means better acuity.
- The untreated fellow eye acts as a control, demonstrating that the improvement is due to the drug and not to placebo or learning effects.
Common Mistakes
- Reading the reversed y-axis the wrong way round and concluding that vision has worsened.
- Forgetting units ("arbitrary units") on the data quote.
- Describing the month-9 spike as a general trend rather than an anomaly.
- Comparing only the endpoints and missing the speed of the initial improvement.
Things to Be Careful About
- The mark scheme accepts any one accurate data quote; a second is harmless. Values must come from the graph given (e.g. −0.40 at month 2 for the treated eye), not invented.
- "Acuity becomes more negative" is the same statement as "acuity improves" – pick one phrasing and stick with it.
Another method being investigated to treat LCA10 is to use a gene editing tool known as the CRISPR/Cas9 system.
The CRISPR/Cas9 system uses a short length of RNA called guide RNA. Guide RNA is complementary to the target DNA and is linked to a nuclease enzyme called Cas9. Cas9 breaks phosphodiester bonds in DNA.
The cell repair mechanisms repair the cut in DNA after the modification has taken place.
• A vector delivers Cas9 and two specific guide RNAs to the photoreceptor cells.
• They act on the section of DNA which contains the mutation.
• Exon X is no longer added to the mRNA.
Explain how this method used to treat LCA10 is an example of gene editing.
Answer
- The CRISPR/Cas9 system uses two guide RNAs that bind to a specific sequence in the patient's own CEP290 DNA, between exon 26 and exon 27, and direct Cas9 to that site.
- Cas9 cuts the phosphodiester bonds in the DNA at this precise location, removing (or disrupting) the mutation that causes exon X to be included.
- The cell's own DNA repair mechanisms join the cut ends back together; because the mutation has been removed, exon X is no longer spliced into the mRNA and full-length, functional CEP290 protein is produced, restoring correct functioning of the photoreceptor cells.
- Because the patient's own DNA is altered in place, the technique is gene editing rather than gene addition.
Cas9 cuts the phosphodiester bonds of the mutated DNA at a specific location between exon 26 and exon 27, removing the mutation; cell repair joins the DNA so that functional CEP290 protein is made from the patient's own edited DNA.
Background Concept
CRISPR/Cas9 is a two-component gene-editing system adapted from a bacterial adaptive immune response:
- A short guide RNA (gRNA) is synthesised in the lab to be complementary to a chosen target sequence in the genome.
- The gRNA is bound to the Cas9 nuclease; the gRNA "searches" the genome by base pairing and Cas9 makes a precise double-strand cut at that site by cleaving the phosphodiester bonds of both DNA strands.
- The cell then repairs the cut, either by non-homologous end joining (NHEJ) – which often introduces small insertions/deletions that disrupt the gene – or, if a DNA template is supplied, by homology-directed repair (HDR) – which can replace the sequence with a corrected version.
The crucial point is that the cell's own DNA is permanently altered in place, not supplemented with an extra functional copy. This is what makes CRISPR/Cas9 an example of gene editing rather than gene therapy (as in part (b)(i), where an extra healthy copy of RPE65 was added by a virus). Editing the existing locus can also remove the underlying cause of the disease: in LCA10, deleting or disrupting the mutation that creates the cryptic splice site means exon X is no longer included in the mRNA and a full-length, functional CEP290 protein is made.
Understanding the Question
Part (c)(ii) is a 3-mark "explain" question that asks the candidate to justify why the procedure described counts as gene editing. The mark scheme rewards:
- The mutated DNA is deleted / cut out / removed (or replaced with normal DNA) at the specific location between exon 26 and exon 27 in the genome.
- The result is a functional CEP290 protein / correct functioning of the photoreceptors.
- The procedure acts on the person's own DNA.
- An additional point (e.g. the STOP codon is no longer present).
Approach
Plan three to four short points: (1) the DNA is cut at a precise locus, (2) the cell's repair mechanism restores the sequence without the mutation, (3) the outcome is functional protein from the patient's own DNA. Make the distinction from part (b) explicit: there, a new gene was added; here, the existing gene is corrected in place.
Step-by-Step Reasoning
- Specific targeting: the two guide RNAs are complementary to the CEP290 sequence around the mutation (between exon 26 and exon 27), so Cas9 is directed to that exact locus in the genome rather than cutting at random.
- Cutting the DNA: Cas9 cleaves the phosphodiester bonds of the DNA at that site; this is a double-strand break that physically removes or disrupts the mutation (and therefore removes the cryptic splice site that caused exon X to be included).
- Cell-mediated repair: the cell's own repair machinery (typically NHEJ) joins the cut ends. Because the mutation has been removed or disrupted, when the gene is now transcribed and spliced, exon X is no longer inserted into the mRNA.
- Functional protein: a full-length, functional CEP290 polypeptide is produced, restoring correct functioning of the photoreceptor cells.
- Why this is "gene editing" not "gene therapy": the patient's own DNA is altered in place; no extra copy of the gene is added. This is the defining feature of editing.
Key Takeaways
- Gene editing changes the existing DNA sequence in the patient's genome; gene therapy adds a new functional copy.
- CRISPR/Cas9 = guide RNA (targeting) + Cas9 nuclease (cutting phosphodiester bonds) + cell's own DNA repair (rejoining).
- For LCA10, removing the cryptic splice site eliminates exon X from the mRNA, allowing the full-length CEP290 protein to be made.
Common Mistakes
- Saying the gene is deleted or cut out – the mark scheme explicitly rejects this wording; it is the mutated DNA sequence (or the section containing the mutation) that is removed, not the entire gene.
- Saying exon X is deleted – the mark scheme ignores this because exon X is an mRNA feature, not a DNA feature.
- Confusing this with the LCA2 treatment in part (b), where a healthy RPE65 gene was added by a virus rather than the existing CEP290 DNA being corrected.
Things to Be Careful About
- Use the precise term phosphodiester bonds when describing the action of Cas9 – the mark scheme explicitly credits this wording.
- Make the location of the cut explicit (between exon 26 and exon 27) to earn the second marking point.
- State clearly that the protein now made is the functional (full-length) CEP290 – "protein is now made" alone is not enough.
Genetic crosses can be used to investigate patterns of inheritance.
A mutation in a gene involved in fruit colour in tomato plants, Solanum lycopersicum, results in the production of yellow fruits instead of red fruits.
A genetic cross was carried out between a pure breeding plant with a red fruit and a pure breeding plant with a yellow fruit to produce the F1 generation. All offspring plants produced red fruits.
The F1 plants were then crossed with each other and the seeds produced were planted to obtain the F2 generation.
Construct a genetic diagram to show the cross of the F1 generation that produced this F2 generation.
Use the symbols R and r for the alleles.
Working
Parental phenotypes: red × red
Parental genotypes:
Gametes: , from each parent
Offspring genotypes:
Offspring phenotypes: red, red, red, yellow
Answer
red : yellow
3 : 1
Background Concept
In Mendelian inheritance, each gene exists as two alleles (alternative forms) on homologous chromosomes. For a single gene with two alleles, an organism can be homozygous dominant (e.g. ), homozygous recessive (e.g. ), or heterozygous (e.g. ). The dominant allele is expressed in the phenotype whenever it is present, so and individuals look the same; the recessive allele is only expressed when no dominant allele is present (i.e. ).
A monohybrid cross follows the inheritance of one gene. Mendel's first law (the law of segregation) states that the two alleles at a locus separate (segregate) during meiosis, so each gamete carries only one allele of each gene. When a heterozygote is self-crossed (), the gametes ( and in equal proportions) fuse at random, giving a genotypic ratio of and a phenotypic ratio of dominant : recessive.
Understanding the Question
The question describes a tomato cross: pure-breeding red ( homozygous ) crossed with pure-breeding yellow ( homozygous ) gives an F1 in which all fruits are red — this tells you that red is dominant to yellow and that the F1 plants are all . The question then asks for a genetic diagram of the F1 F1 cross that produces the F2 generation. You are told to use the symbols R and r for the alleles.
The command word is construct a genetic diagram, so a clear Punnett square showing parents, gametes, offspring genotypes and phenotypes is the expected answer. Three marks are available: one for the parental genotypes and gametes, one for the offspring genotypes, and one for the offspring phenotypes.
Approach
- Identify the parental generation: the F1 plants, all of which are (because red is dominant).
- List the gametes each parent can produce: or (with equal probability).
- Set out a Punnett square (a 2 × 2 grid) combining the gametes from each parent.
- Read off the four offspring boxes, give each genotype, then assign the phenotype (red or yellow) to each.
- Tally the phenotypes to give the ratio.
Step-by-Step Reasoning
- Parental genotypes (): The F1 individuals came from a cross , so every F1 is . When the F1 are crossed with each other, both parents are — this is the parental genotype line that earns the first mark.
- Gametes ( and from each parent): According to the law of segregation, the homologous chromosomes carrying and separate at meiosis I, so each parent produces gametes with and gametes with in equal numbers. The mark scheme requires the gametes to be written out — typically above and to the side of the Punnett square.
- Offspring genotypes (, , , ): Filling in the four cells of the Punnett square gives (top left), (top right and bottom left), and (bottom right). The two cells must both be written for the second mark.
- Phenotypes (red, red, red, yellow): Because is dominant, and both produce red fruits; only produces yellow fruits. The third mark is awarded for writing the phenotype beneath or alongside each genotype.
- Ratio: Summing the phenotypes gives 3 red : 1 yellow.
Key Takeaways
- A pure-breeding red crossed with a pure-breeding yellow gives a uniform F1 (here, all red) — the parental phenotype seen in the F1 identifies which trait is dominant.
- An F1 F1 monohybrid cross gives a 3:1 phenotypic ratio (and 1:2:1 genotypic ratio) in the F2.
- A genetic diagram should always show, in order: parental phenotypes, parental genotypes, gametes, offspring genotypes, and offspring phenotypes. This is the conventional layout credited by the mark scheme.
Common Mistakes
- Writing the F1 parental genotype as (forgetting that pure breeding was the P generation, not the F1).
- Listing only one gamete from each parent (e.g. only ) instead of both and — the mark scheme requires the two gamete types.
- Writing offspring as or instead of separating them into the four boxes.
- Labelling offspring as yellow because they "carry the recessive allele" — dominance means the phenotype is determined by the allele that is present, not the ones that are absent.
- Forgetting the parental phenotype line — a complete genetic diagram starts with phenotypes, not just genotypes.
Things to Be Careful About
- Use the symbols exactly as instructed: R and r, with the dominant allele in upper case and the recessive allele in lower case.
- The mark scheme credits the answer only if parents, gametes, offspring genotypes and phenotypes are all present and in the right order. A diagram with a single line of " red : yellow" will not earn full marks.
- "Pure breeding" means homozygous — for this question, the pure-breeding red parent is and the pure-breeding yellow parent is . This is P generation context; the question only asks for the F1 F1 cross.
- Do not introduce extra alleles (e.g. or ); the question restricts you to and .
A theoretical dihybrid cross involves two genes located on different autosomes. Each gene has two alleles, one dominant and one recessive.
A parent, homozygous dominant for both genes, is crossed with a parent that is homozygous recessive for both genes. This produces F1 individuals that are then crossed to produce the F2 generation.
State the phenotypic ratio of this dihybrid F2 generation and explain why some of these offspring phenotypes are different from the original parental phenotypes.
ratio ______
explanation ______
Answer
Ratio:
Explanation: During meiosis, homologous chromosomes (bivalents) line up and separate independently at random at metaphase I. This independent (random) assortment of the two pairs of homologous chromosomes produces gametes with all four possible combinations of alleles, so when F1 gametes fuse at random, offspring arise with phenotypes that combine the dominant and recessive alleles of the two genes in new ways that were not present in the original parents.
9 : 3 : 3 : 1
Background Concept
A dihybrid cross follows the inheritance of two different genes at the same time. When the two genes are located on different autosomes (i.e. on different pairs of homologous chromosomes), the alleles of one gene assort independently of the alleles of the other gene during meiosis. This is Mendel's second law, the law of independent assortment.
A cross between a parent homozygous dominant for both genes (e.g. ) and a parent homozygous recessive for both genes (e.g. ) produces F1 individuals that are heterozygous at both loci (). The F1 expresses only the two dominant phenotypes because and are dominant. When two F1 individuals are crossed, the gametes they produce are , , and in equal proportions (because of independent assortment), and the random fusion of these gametes produces the classic dihybrid phenotypic ratio of in the F2. Of these 16 parts, 9 show both dominant phenotypes, 3 show one dominant + the other recessive, 3 show the other dominant + the one recessive, and 1 shows both recessive phenotypes — the last category (and the two 3s in part) is "recombinant" relative to the original parents.
Understanding the Question
This part sets up a theoretical dihybrid cross with two unlinked autosomal genes (i.e. genes on different chromosomes). You are asked to do two things: (1) state the F2 phenotypic ratio, and (2) explain why some offspring in the F2 have phenotypes that were not present in either of the original (P generation) parents. The P generation shows only the two parental phenotypes (both dominant, and both recessive); the F2 contains four phenotypes, two of which mix a dominant trait of one gene with a recessive trait of the other — these "new" phenotypes are what the question wants explained.
The command words are state (the ratio — just a number) and explain (the reason for the recombinant phenotypes — must give the mechanism, not just restate the ratio). Three marks are available: one for the ratio and two for the explanation.
Approach
- Recognise the cross as a standard dihybrid cross between two double-heterozygous F1 individuals.
- State the classic F2 ratio: 9:3:3:1.
- Identify the source of the "new" phenotypes: independent (random) assortment of homologous chromosomes / bivalents at a specific stage of meiosis (metaphase I, where the orientation of each bivalent on the equator is random, or metaphase II for sister chromatids).
- Link the chromosome behaviour to the four types of gamete, and therefore to the appearance of recombinant phenotypes in the F2.
Step-by-Step Reasoning
- Ratio (mark 1): A dihybrid F2 from a cross always shows the phenotypic ratio when both genes show complete dominance and are unlinked. The 9 represents the double-dominant phenotype, the two 3s each represent one dominant + one recessive phenotype, and the 1 is the double-recessive phenotype. Two of these four phenotypes (the two 3s) were not seen in the P generation.
- Independent assortment (mark 2): During meiosis, the two pairs of homologous chromosomes (one carrying and the other carrying ) line up independently of one another. This is the source of the four kinds of gamete.
- Stage of meiosis (mark 3): The mark scheme specifically requires a named stage — metaphase I is the canonical answer (bivalents align on the equator; the orientation of each bivalent is random, so the maternal/paternal chromosome of one pair can be combined with either chromosome of the other pair). Metaphase II is also accepted. Note that crossing over is ignored by the mark scheme for this question, so it should not be given as the explanation.
- Link to phenotype: The independent orientation of bivalents means that the allele can end up in a gamete with either or , and likewise for . F1 gametes are therefore , , and in equal proportions, and when these fuse at random, the and combinations produce phenotypes that combine a dominant trait of one gene with a recessive trait of the other — phenotypes that were not present in the original parents.
Key Takeaways
- A standard dihybrid F2 (from a cross of two F1 double heterozygotes) has a phenotypic ratio of .
- The new (recombinant) phenotypes in the F2 are produced by independent assortment of the two pairs of homologous chromosomes during meiosis.
- The classic meiotic stage to cite is metaphase I, where random orientation of bivalents generates the four gamete types.
Common Mistakes
- Writing the ratio as 1:2:1:2:4:2:1:2:1 or another genotypic-style ratio instead of the 9:3:3:1 phenotypic ratio.
- Saying that the new phenotypes arise "because of meiosis" without specifying what happens in meiosis — the mark scheme requires independent assortment AND a named stage (e.g. metaphase I).
- Attributing the recombinant phenotypes to crossing over — the mark scheme explicitly says to ignore references to crossing over for this question.
- Citing "random mating" or "random fertilisation" as the cause — these are true but they do not, by themselves, generate new combinations of alleles; it is the assortment of chromosomes into gametes that creates the new allele combinations in the first place.
- Confusing the F2 with the F1: the F1 is uniform, and the F2 is where the 9:3:3:1 ratio appears.
Things to Be Careful About
- State the ratio precisely in the form "9:3:3:1" — variants such as "9-3-3-1" or "9, 3, 3, 1" may not be credited.
- For the explanation, two separate ideas are needed for the two marks: (i) independent / random assortment, and (ii) of homologous chromosomes / bivalents (or sister chromatids) at a named stage of meiosis. A single sentence that lumps all of this together may miss a mark; a candidate who only says "independent assortment" without naming the stage will not earn the third mark.
- Do not describe crossing over as the source of the new phenotypes for this question — the mark scheme instructs the examiner to ignore it.
- Keep the explanation focused on the mechanism (chromosome behaviour) rather than the outcome (the 9:3:3:1 ratio). The mark scheme is rewarding the mechanism, not the result.
Phenotypic variation exists in natural populations. There are many causes of variation. Natural selection determines which phenotypes are advantageous.
Variation in a particular characteristic can be described as either discontinuous or continuous.
Table 5.1 contains a list of statements that apply to discontinuous variation, continuous variation or both.
Complete both columns of Table 5.1. Put a tick (✓) in the box if the statement applies and leave the box empty if the statement does not apply.
Table 5.1
| statement | discontinuous variation | continuous variation |
|---|---|---|
| often involves one gene only | ||
| environmental factors may affect gene expression | ||
| there is an additive effect of genes that contributes to the phenotype | ||
| there are distinct differences between the various forms of a characteristic |
Answer
| statement | discontinuous variation | continuous variation |
|---|---|---|
| often involves one gene only | ✓ | |
| environmental factors may affect gene expression | ✓ | |
| there is an additive effect of genes that contributes to the phenotype | ✓ | |
| there are distinct differences between the various forms of a characteristic | ✓ |
See working
Background Concept
Variation between individuals in a population can be classified in two main ways:
- Discontinuous variation is qualitative and produces a small number of distinct, non-overlapping categories (e.g. ABO blood group, tongue-rolling, seed shape in Mendel's peas). It is usually determined by one gene (or a very small number of genes) with a small number of alleles, so the environment has little effect on which category an individual falls into.
- Continuous variation is quantitative and shows a smooth gradation between two extremes (e.g. height, mass, skin colour, milk yield). It is usually determined by many genes (polygenes), each contributing a small additive effect to the phenotype. Environmental factors (nutrition, temperature, exercise, sunlight exposure) also influence where on the scale an individual lies, so the phenotype is the result of genotype + environment.
The key distinctions tested by Table 5.1 are:
| Feature | Discontinuous | Continuous |
|---|---|---|
| Number of genes | One (or few) | Many (polygenes) |
| Additive gene effects | No | Yes |
| Distinct categories | Yes | No (smooth range) |
| Environment alters phenotype | Rarely | Yes |
Understanding the Question
The question provides four statements and asks which apply to discontinuous variation, which to continuous variation, and which to both. A tick is placed in a box only if the statement applies to that type.
Approach
For each statement, recall the defining features of discontinuous and continuous variation and decide which column it fits.
Step-by-Step Reasoning
- "often involves one gene only" — Discontinuous variation is typically controlled by a single gene (or very few) with discrete alleles. ✓ for discontinuous; ✗ for continuous (which involves many genes). → Tick discontinuous.
- "environmental factors may affect gene expression" — Continuous variation is strongly influenced by environment (e.g. nutrition affects height, sunlight affects skin colour). The mark scheme ticks this only for continuous. → Tick continuous.
- "there is an additive effect of genes that contributes to the phenotype" — Continuous variation results from many genes each contributing a small additive effect (polygenes). → Tick continuous.
- "there are distinct differences between the various forms of a characteristic" — Discontinuous variation has discrete, non-overlapping categories. → Tick discontinuous.
Key Takeaways
- Discontinuous variation = few genes, no overlap, environment has little effect.
- Continuous variation = many genes (polygenes) with additive effects, strongly influenced by environment, no distinct categories.
Common Mistakes
- Ticking "environmental factors may affect gene expression" for both columns. The mark scheme credits this only for continuous, because although environment can also affect discontinuous traits, the statement is characteristic of continuous variation in the context of the syllabus.
- Ticking "additive effect of genes" for discontinuous. This is the hallmark of polygenic (continuous) variation.
Things to Be Careful About
- Read each statement carefully and match it to the type of variation whose defining features it describes, not just traits that might apply in unusual cases.
- A tick goes in a box only if the statement is a defining feature of that type of variation.
There is variation in the quantity of vitamin D stored in the body.
Vitamin D has an important role in keeping bones healthy. The main storage form of vitamin D in the body is serum 25‑hydroxyvitamin D (serum 25‑OHD).
A study was carried out on 262 healthy women to investigate if the concentration of serum 25‑OHD varied between summer and winter. The women had taken no vitamin D supplements. The age range of the women in the sample was 40 to 72 years old.
Table 5.2 shows the results of the study.
Table 5.2
| group | mean concentration of serum 25‑OHD / | standard deviation |
|---|---|---|
| sampled during summer | 32.7 | 7.6 |
| sampled during winter | 28.5 | 8.3 |
| whole sample | 30.7 | 8.2 |
Additional analysis showed that there was no significant correlation between age and serum 25‑OHD concentration.
Answer
Standard deviation is a measure of the spread (or variability / dispersion) of the sample values about the mean.
A measure of the spread of the data about the mean.
Background Concept
A mean alone does not describe a dataset fully; two sets of results can have the same mean but very different spreads. The standard deviation () is the most widely used statistic to quantify that spread. It is calculated from the squared deviations of every data point from the mean, averaged (divided by for a sample), then square-rooted. The larger the standard deviation, the more the data are spread out around the mean.
In the context of the vitamin D study, the standard deviations (7.6, 8.3, 8.2 ) indicate how much individual women's serum 25-OHD concentrations vary around each group mean.
Understanding the Question
Part (b)(i) is a one-mark "explain what is meant by" item requiring a definition of standard deviation in the context of Table 5.2.
Approach
State the defining idea: standard deviation is a measure of the spread of data about the mean. The mark scheme credits any reference to "spread of results about the mean".
Step-by-Step Reasoning
The single marking point is satisfied by saying that standard deviation is a measure of how much the results are spread (or scattered) about the mean. A higher standard deviation means the individual values are more variable; a lower one means they cluster closer to the mean.
Key Takeaways
- Standard deviation quantifies the spread of a sample about its mean.
- It is used in the -test formula as a measure of variability within each group.
Common Mistakes
- Confusing standard deviation with standard error. Standard error is and is smaller than the standard deviation because it reflects the precision of the mean, not the spread of the data.
- Defining it as "the average value" — that is the mean, not the standard deviation.
Things to Be Careful About
- The definition must mention both spread and mean. A phrase such as "a measure of variability" alone is borderline; the safest form is "a measure of the spread of the data about the mean".
The -test was used to compare the mean concentration of serum 25‑OHD when sampled during the summer with the mean concentration of serum 25‑OHD when sampled during the winter, as shown in Table 5.2.
Calculate the value of using the formula provided.
key to symbols:
Give your answer to four significant figures.
There is space for your working.
-test value = ______
Working
Answer
4.255
Background Concept
The unpaired (two-sample) -test compares two group means to test the null hypothesis that the two populations from which the samples are drawn have the same mean. The test statistic is calculated as
where are the two sample means, are the sample standard deviations, and are the sample sizes. A large value of means the two means are far apart relative to the variability within the groups, so they are likely to come from populations with genuinely different means.
Understanding the Question
The data are:
- Summer group: , ,
- Winter group: , ,
The question asks for the value of to four significant figures.
Approach
- Subtract the means (numerator).
- Square each standard deviation and divide by the corresponding (two terms inside the square root).
- Add the two terms, take the square root, then divide the numerator by it.
- Round to four significant figures.
Step-by-Step Reasoning
- Numerator: .
- (to 4 d.p.).
- (to 4 d.p.).
- Sum inside square root: .
- Square root: (to 4 d.p.).
- To four significant figures: .
The mark scheme accepts 4.255, or 4.25/4.26 (rounded to 3 sig figs if the candidate worked to that precision), but not 4.256 (incorrectly rounded up — the next digit is 4, so the fifth digit does not round the fourth upward).
Key Takeaways
- Be systematic: square first, then divide by , then add, then take the square root, then divide.
- Maintain extra precision in the working so the final answer is correct to the required significant figures.
- Correct rounding: 4.2554 → 4.255 (the 5th digit, 4, is below 5 so the 4th digit stays at 5).
Common Mistakes
- Computing (standard error) instead of for each term — this is the most common algebraic slip.
- Using in place of — the formula in the question uses , so use .
- Rounding 4.2554 to 4.256 (wrong direction of rounding).
- Failing to apply the absolute value to the difference of means (the means happen to be subtracted the right way round here, so this would still give 4.2).
Things to Be Careful About
- The ... in the formula means the difference is taken as positive; with the data given it does not matter which way the subtraction is done.
- Show all intermediate values; if the final answer is wrong, the mark scheme still gives up to 2 marks for visible correct working (e.g. 4.2 as the numerator and 0.9870 as the denominator).
The critical value at the 0.0001 probability level is 3.773.
State the conclusion that can be made about the results of the study shown in Table 5.2 and explain how the result of your calculation in (b)(ii) can be used to support this conclusion.
Answer
The mean concentration of serum 25-OHD is higher in summer than in winter (or vice versa).
Supporting points:
- The calculated value of (4.255) is greater than the critical value (3.773).
- Therefore there is a significant difference between the two means.
- The probability that this difference is due to chance is less than 0.0001 (0.01%).
Higher mean concentration in summer than in winter; t (4.255) > critical value (3.773), so the difference is significant and not due to chance (p < 0.0001).
Background Concept
A -test result is interpreted by comparing the calculated value with a critical value taken from a statistical table for the chosen probability level (commonly , but here ) and the appropriate degrees of freedom (here, , well above the row of the table). If exceeds the critical value, the null hypothesis (that the two means come from the same population) is rejected: the difference between the means is statistically significant.
The smaller the probability level, the stronger the evidence against the null hypothesis. A probability of 0.0001 means the difference would arise by chance in fewer than 1 in 10 000 similar experiments.
Understanding the Question
The candidate must:
- State a biological conclusion about the data (which mean is higher).
- Justify it using the calculated value, the critical value, and the probability level.
Approach
Apply the standard decision rule of the -test: compare to the critical value, then translate the result into biological language.
Step-by-Step Reasoning
- From (b)(ii), .
- The critical value at is 3.773.
- Because , the calculated lies in the rejection region of the test.
- We therefore reject the null hypothesis and conclude that there is a significant difference between the summer mean (32.7) and the winter mean (28.5) concentration of serum 25-OHD.
- The probability that such a difference would arise by chance (if the two means were really equal in the population) is less than 0.0001 (0.01%).
- Biologically: women in this sample had a higher mean concentration of stored vitamin D in summer than in winter — consistent with greater skin synthesis of vitamin D on exposure to summer sunlight.
Key Takeaways
- critical value → reject the null hypothesis → significant difference.
- The smaller the chosen , the stronger the evidence required to reject the null.
- A statistical conclusion must be stated in biological terms, not just in the language of and critical values.
Common Mistakes
- Saying "the result is significant" without identifying which mean is higher (the mark scheme requires the direction of the difference).
- Saying "the difference is due to chance" — the opposite is true; the difference is not likely to be due to chance.
- Comparing with the wrong critical value, or quoting the probability incorrectly.
- Stating "the data are 99.99% accurate" — the probability refers to the chance of obtaining the observed difference by chance, not to data accuracy.
Things to Be Careful About
- The mark scheme allows error carried forward (ecf) from an incorrect value in (b)(ii), so a wrong number can still earn full credit if the comparison and conclusion are correct given that number.
- The conclusion must mention the direction of the difference (summer higher than winter) as well as the significance.
Suggest the likely causes of variation in quantity of vitamin D stored in the body in this sample of women.
Answer
Variation in the amount of vitamin D stored in the body is due to a combination of genetic and environmental causes.
For example:
- Genetic cause — different alleles of genes involved in vitamin D synthesis, transport or metabolism (e.g. variation in the gene for the enzyme that converts 7-dehydrocholesterol to vitamin D in the skin, or in the vitamin D receptor gene) lead to different individuals producing, transporting or using vitamin D at different rates.
- Environmental cause — different exposure to UV light / sunlight (e.g. due to season, latitude, time spent outdoors, clothing or use of sunscreen), which determines how much vitamin D is made in the skin; also dietary intake of vitamin D from food.
Any one genetic cause and any one environmental cause scores the mark.
A genetic cause (e.g. different alleles affecting vitamin D synthesis/metabolism) and an environmental cause (e.g. differing exposure to UV light / sunlight, or differing dietary intake of vitamin D).
Background Concept
Most phenotypes in a population vary because of two broad classes of cause:
- Genetic causes — different individuals inherit different alleles of the genes involved. These may code for enzymes, receptors, transporters or other proteins. The alleles may differ in activity, producing different phenotypes.
- Environmental causes — the conditions an individual experiences (diet, sunlight, temperature, toxins, exercise, etc.) alter the phenotype produced by a given genotype. Identical genotypes can give different phenotypes in different environments.
Almost all variation observed in real human populations has both genetic and environmental components. Vitamin D status is a textbook example: skin pigmentation (genetic) and sun exposure (environmental) both affect how much vitamin D the body makes.
Understanding the Question
The candidate is asked to suggest likely causes of variation in serum 25-OHD concentration within the sample of 262 women. The mark scheme requires one genetic AND one environmental cause (or named examples of each).
Approach
Think of factors that differ between individuals and that could plausibly affect the amount of vitamin D stored:
- Genetic factors operate through the proteins a person makes — e.g. alleles of the genes encoding the enzymes that synthesise vitamin D in the skin, or of the vitamin D receptor.
- Environmental factors operate through what a person is exposed to — chiefly UV light from sunlight (which triggers vitamin D synthesis in the skin) and the vitamin D in the diet.
Step-by-Step Reasoning
- Genetic cause example. Alleles of the CYP2R1 gene (which encodes a liver enzyme that converts vitamin D to 25-OHD) differ between individuals, so the rate of production of serum 25-OHD differs. Similarly, alleles affecting skin pigmentation (melanin content) determine how much UV light passes through the skin and hence how much vitamin D is made.
- Environmental cause example. The women in the study were sampled in different seasons. Sunlight (UV) exposure varies enormously between summer and winter, and between individuals who spend more or less time outdoors, wear more or less clothing, or live at different latitudes. Diet (oily fish, eggs, fortified foods) is another environmental input.
Any plausible genetic cause paired with any plausible environmental cause is sufficient.
Key Takeaways
- Almost all phenotypic variation in human populations has a genetic + environmental basis.
- For vitamin D, the major environmental driver is exposure to UV light; the major genetic driver is variation in the enzymes and receptors of the vitamin D pathway (and in skin pigmentation).
Common Mistakes
- Naming only one cause (the mark scheme requires both, or an example of each).
- Giving vague answers such as "genes" or "lifestyle" without saying which gene or which environmental factor.
- Conflating "sunlight" with the unrelated factor of skin colour (skin colour is genetic, sun exposure is environmental).
Things to Be Careful About
- The mark scheme credits "genetic AND environmental" (or one example of each) — both must be present in the answer for the single mark.
- Examples should be specific to vitamin D where possible, to show understanding of the trait in question.
DCPIP is an indicator and can be used to determine the rate of respiration of organisms such as yeast.
Answer
Redox.
redox
Background Concept
DCPIP (2,6-dichlorophenolindophenol) is a chemical dye whose colour depends on its oxidation state. In its oxidised form it is blue; when it accepts electrons (or hydrogen atoms) and is reduced, it becomes colourless. Because the colour change is driven by a change in redox state, DCPIP belongs to the family of redox (oxidation–reduction) indicators. In a respiration experiment, DCPIP acts as an artificial terminal electron acceptor — the electron-transport chain of actively respiring cells passes electrons to DCPIP instead of to oxygen, and the indicator is therefore reduced and decolourises.
Understanding the Question
This is a one-mark recall asking which category of indicator DCPIP belongs to. The expected single word is the family, not a description of the colour change.
Approach
Recall that DCPIP changes colour when it is reduced — the defining behaviour of a redox indicator. The mark-scheme answer is the single word "redox".
Step-by-Step Reasoning
Biological indicators fall into broad families: pH indicators (litmus, methyl orange, universal indicator), redox indicators (DCPIP, methylene blue, tetrazolium dyes) and specific binding indicators. DCPIP's colour responds to whether it is oxidised (blue) or reduced (colourless), so it is a redox indicator. The candidate's single word is "redox".
Key Takeaways
- DCPIP is a redox (oxidation–reduction) indicator.
- It is reduced by components of the electron-transport chain in actively respiring cells.
- Redox indicators are useful when measuring respiration rate without needing to measure O₂ uptake directly.
Common Mistakes
- Writing "pH indicator" — wrong category; DCPIP is not a pH indicator.
- Writing the colour change (e.g. "blue to colourless") instead of the category — the question asks for the category, not the colour.
- Writing "oxidation indicator" — incomplete; the indicator responds to the redox state, not oxidation alone.
Things to Be Careful About
The mark-scheme answer is the single word "redox". No alternative wording is accepted. Do not pad the answer with extra words.
Describe the colour change that occurs in DCPIP during experiments to determine the rate of respiration.
Answer
Blue to colourless.
blue to colourless
Background Concept
DCPIP is a redox indicator. In its oxidised state it is blue. When it is reduced (i.e. gains electrons / hydrogen from reduced NAD or from the electron-transport chain) it becomes colourless. The rate at which the blue colour disappears is therefore a measure of the rate of electron flow through the respiratory chain, and hence a measure of the rate of respiration.
Understanding the Question
The candidate is asked to describe the colour change that DCPIP undergoes during a respiration experiment. The expected answer is the start colour, the end colour, and the direction of change.
Approach
State the initial (oxidised) colour, the final (reduced) colour and the direction. The mark-scheme answer is "blue to colourless".
Step-by-Step Reasoning
In the experimental tube, DCPIP begins blue (its oxidised form). As the yeast cells respire, the electron-transport chain reduces DCPIP instead of — or in competition with — O₂. The reduced DCPIP is colourless, so the solution decolourises. The end-point of the experiment is when the blue colour disappears.
Key Takeaways
- DCPIP starts blue and becomes colourless when reduced.
- The time taken for the colour to disappear is inversely related to the rate of respiration.
- Other redox indicators (e.g. methylene blue) decolourise in the same way when reduced.
Common Mistakes
- Writing "blue to pink" or any other end colour — only "colourless" is accepted.
- Writing the change in the wrong direction, e.g. "colourless to blue".
- Confusing DCPIP's behaviour in a photosynthesis experiment (the Hill reaction) with its behaviour in a respiration experiment — the colour change is the same (blue to colourless) but the electron source differs (water in chloroplasts vs. reduced NAD in mitochondria).
Things to Be Careful About
The mark-scheme reward is the pair "blue to colourless", in that order. Reversing them is incorrect. The two colour states must appear in the candidate's answer to gain the mark.
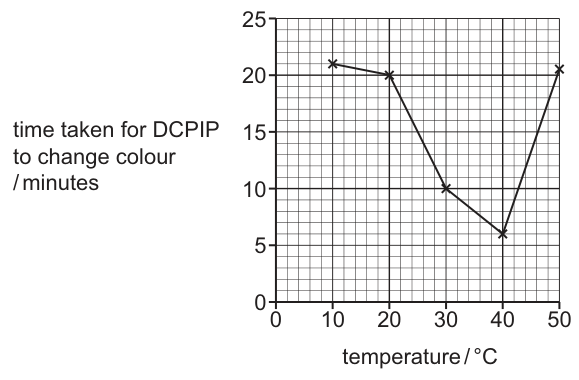
An investigation was carried out to determine the effect of temperature on the rate of respiration of yeast.
• A suspension of yeast cells was added to a test‑tube containing glucose solution.
• A further four test‑tubes were set up in the same way.
• One test‑tube was placed in a water‑bath at 10°C for 5 minutes.
• DCPIP was added to the test‑tube and the time taken for the DCPIP to change colour was measured.
• The experiment was repeated using the other test‑tubes at 20°C, 30°C, 40°C and 50°C.
The results are shown in Fig. 6.1.
Answer
- Volume (or mass, or concentration) of yeast suspension.
- Volume (or mass, or concentration) of glucose solution.
(Other acceptable answers: volume or concentration of DCPIP; time interval before DCPIP is added; pH of the solutions.)
e.g. volume of yeast suspension and volume of glucose solution
Background Concept
In any experiment that investigates how one variable affects another, every other factor that could influence the result must be kept constant — these are the control (or standardised) variables. If they are not, a change in the dependent variable could be due to any of them rather than the independent variable, and the experiment is not a fair test. In this investigation the independent variable is temperature and the dependent variable is the time taken for DCPIP to decolourise, which is inversely related to the rate of respiration.
Understanding the Question
The question asks for two variables that must be kept constant. It is a 2-mark question, so two distinct, valid, controllable variables are required.
Approach
Think through everything that could vary between tubes other than the temperature of the water-bath: how much yeast, how much glucose, how concentrated each is, how much DCPIP is added, how long the tube sits before DCPIP is added, the pH of the solution, and so on. Pick the two most obviously important and easily controllable and state each one as a quantity plus the substance.
Step-by-Step Reasoning
- The amount of yeast cells in each tube determines how many respiratory enzymes are present; this must be the same so that temperature is the only factor that differs. → keep the volume (or mass, or concentration) of yeast suspension the same in every tube.
- The amount of glucose determines how much substrate is available for respiration; this must be the same. → keep the volume (or concentration) of glucose solution the same.
- Other valid answers: volume / concentration of DCPIP (so the same amount of indicator must be reduced each time), time between setting up the tube and adding the DCPIP (so each tube is at temperature for the same period), pH of the solutions (because enzymes are pH-sensitive).
Key Takeaways
- A control variable is anything that could affect the dependent variable and is not the independent variable.
- "Same volume", "same mass" or "same concentration" are the standard ways of stating how each control variable is kept constant.
- A complete list of control variables is the difference between a strong plan and a weak one in Paper 5.
Common Mistakes
- Naming the independent variable (temperature) or the dependent variable (time) — these are not control variables.
- Naming a substance (e.g. "yeast" or "glucose") without specifying the quantity (volume / mass / concentration). The mark scheme requires the quantity to be credited.
- Naming properties that cannot sensibly be controlled, e.g. "room temperature" while the water-bath is at 50 °C.
- Naming an irrelevant variable such as "colour of the test-tube" or "size of the laboratory".
Things to Be Careful About
Each marking point requires a quantity descriptor (volume, mass, or concentration) plus the substance. "Same amount of yeast" is too vague; "same volume of yeast suspension" is the credit-worthy form.
Answer
- The shorter the time taken for the DCPIP to decolourise, the higher the rate of respiration (rate is inversely related to time).
- Between 10 °C and 40 °C, the time decreases, so the rate increases. Molecules have more kinetic energy, so there are more (successful) collisions between enzymes and substrates and more enzyme–substrate complexes form per unit time.
- Between 40 °C and 50 °C, the time increases, so the rate falls. The respiratory enzymes are denatured, the active site changes shape so the substrate can no longer bind, and the rate decreases. 40 °C is the optimum temperature.
Rate of respiration rises to an optimum at 40 °C (more kinetic energy / collisions) then falls sharply (enzyme denaturation).
Background Concept
Respiration depends on a chain of enzyme-catalysed reactions (glycolysis, the link reaction, the Krebs cycle and oxidative phosphorylation). The rate of any enzyme-catalysed reaction is affected by temperature. As temperature rises from a low value, molecules have more kinetic energy, move faster, and collide with substrates more often and with more energy, so more enzyme–substrate complexes form and the rate rises. Above an optimum temperature, however, the enzyme begins to denature — the tertiary structure of the protein unravels, the active site loses its specific shape, the substrate can no longer bind, and the rate falls sharply.
Understanding the Question
The candidate is shown Fig. 6.1, a graph of time taken for DCPIP to decolourise (y-axis) against temperature (x-axis). The points are 10 °C = 21 min, 20 °C = 20 min, 30 °C = 10 min, 40 °C = 6 min, 50 °C = 21 min. The candidate must interpret the curve and explain the trend in biological terms.
Approach
Translate the y-axis (time taken to change colour) into a statement about rate, then describe the trend in two parts (rising then falling) and finally attach a biological mechanism to each part. The mark scheme rewards three points: a rate-statement, a kinetic-energy / collision explanation for the rising part, and a denaturation explanation for the falling part.
Step-by-Step Reasoning
- Rate interpretation. The shorter the time taken for the DCPIP to change colour, the higher the rate of respiration. Equivalently (ora), the longer the time, the lower the rate. The graph therefore shows respiration rate rising from 10 °C to 40 °C and then falling sharply at 50 °C.
- Rising part (10–40 °C). The time decreases from 21 min to 6 min, so the rate of respiration increases. The biological reason lies in enzyme kinetics: as temperature rises, substrate and enzyme molecules gain kinetic energy. They collide more frequently and a greater fraction of collisions have enough energy to be successful, so more enzyme–substrate complexes form per unit time and more reactions are catalysed. (The change is small from 10 to 20 °C but large from 20 to 40 °C, because the enzymes are well below their optimum in that range and small temperature rises have a big effect on collision frequency.)
- Falling part (40–50 °C). The time jumps back up from 6 min to 21 min, so the rate of respiration falls. The biological reason is denaturation. Above the optimum temperature (40 °C here), the increased vibrational energy of the polypeptide chain breaks some of the weak bonds (hydrogen bonds, hydrophobic interactions, ionic interactions) that hold the tertiary structure of the enzyme together. The active site changes shape and can no longer bind the substrate, so enzyme–substrate complexes do not form and the rate drops sharply. 40 °C is therefore the optimum temperature for the yeast respiratory enzymes in this experiment.
- The fact that the 50 °C time is roughly the same as the 10 °C time is coincidence: the two ends of the curve have completely different underlying reasons (one is too cold for many collisions, the other has destroyed the active site).
Key Takeaways
- Decolourisation time and respiration rate are inversely related.
- Below the optimum, temperature increases the rate by increasing the kinetic energy, the collision frequency, and the proportion of successful collisions.
- Above the optimum, temperature denatures the enzyme, the active site loses its shape, and the rate collapses.
- A rate–temperature graph for an enzyme-catalysed process is a characteristic asymmetric curve with a sharp fall after the optimum.
Common Mistakes
- Stating only "the rate increases then decreases" without giving a biological reason — the question asks to explain, not just describe.
- Saying "the enzyme is killed" — enzymes are not alive; the correct term is denaturation.
- Saying "the enzyme is denatured" without any further detail (the mark scheme awards a separate point for the mechanism: change in active site shape, or specifying that 40 °C is the optimum).
- Stating the trend without linking it to respiration rate (forgetting the "shorter time = faster rate" conversion).
- Confusing this with the photosynthesis rate vs temperature curve, in which the same explanation applies but the relevant enzyme is rubisco rather than a respiratory enzyme.
Things to Be Careful About
- "Denature" must be used in the correct context. Yeast is a living organism, but at 50 °C the relevant change is denaturation of the enzymes inside it, not death of the cell.
- The y-axis is time, not rate. Many marks are lost by candidates who say "the rate increases" when the graph actually shows the time decreasing. The conversion to rate must be made explicit.
- The "ora" in the mark scheme means the candidate may equally state "the longer the time, the lower the rate". Either phrasing earns the mark.
Paper chromatography is a technique that can be used to separate and identify different chloroplast pigments.
Describe how the results of paper chromatography can be used to identify chloroplast pigments.
Answer
- Measure the distance moved by each pigment spot from the baseline and the distance moved by the solvent front from the baseline.
- Calculate the value for each pigment:
- Compare each calculated value with known / standard / table values for chloroplast pigments to identify the pigments present.
Calculate the Rf value for each pigment and compare it with known values to identify the pigments.
Background Concept
Paper chromatography is a separation technique that exploits the different solubilities of mixture components in a solvent and their different affinities for the stationary phase (the chromatography paper). When a piece of paper with a spot of pigment mixture is placed in a solvent, the solvent moves up the paper by capillary action, carrying the pigments with it. Pigments that are more soluble in the solvent (and less strongly adsorbed to the paper) travel further.
Each pigment, under given conditions (solvent, temperature, paper type), has a characteristic retardation factor () value, defined as:
The value is a ratio and therefore has no units. It always lies between 0 (pigment did not move) and 1 (pigment moved as far as the solvent front).
Understanding the Question
The question asks how the results of paper chromatography can be used to identify which chloroplast pigments are present. The "results" here are the chromatogram showing separated pigment spots at different positions on the paper. The task is to convert those positions into identifications.
Approach
The approach is in three steps: (1) measure the distances travelled by the solvent and by each pigment from the baseline; (2) calculate an value for each pigment spot; and (3) compare each value with a known reference (e.g. published tables or values obtained for pure pigment standards run under the same conditions).
Step-by-Step Reasoning
- Measure the distances. With the chromatogram dry, mark the original baseline (where the pigment was applied) and the solvent front (the highest point reached by the solvent). For each coloured spot, measure from the baseline to the centre of the spot (distance moved by the pigment) and from the baseline to the solvent front (distance moved by the solvent).
- Calculate the value. Divide the distance moved by the pigment by the distance moved by the solvent. The result is a number between 0 and 1, characteristic of that pigment under the conditions used.
- Compare with known values. values for the common chloroplast pigments (chlorophyll a, chlorophyll b, carotene, xanthophyll etc.) are tabulated for standard solvent systems. By matching the calculated values with these reference values, each spot can be identified.
Key Takeaways
- is a ratio (no units) and is specific to a given pigment, solvent and paper type.
- Identification by chromatography relies on values being reproducible under fixed conditions.
- Always compare like with like: an value is only meaningful if the solvent and conditions match those used to generate the reference table.
Common Mistakes
- Measuring from the wrong baseline (e.g. the bottom edge of the paper rather than the line where pigment was applied).
- Dividing the wrong way round — always distance moved by pigment ÷ distance moved by solvent.
- Quoting an greater than 1, which signals a measurement error.
- Forgetting that comparison must be with values obtained in the same solvent system, since depends on the solvent.
Things to Be Careful About
- Measure to the centre of each spot, not the leading edge, especially if spots are diffuse.
- Make sure the chromatogram is fully dry before measuring.
- Quote to two decimal places for the level of precision the mark scheme expects.
Carotene and xanthophyll are chloroplast pigments.
Describe the role played by these pigments in photosynthesis.
Answer
- Carotene and xanthophyll are accessory pigments that absorb wavelengths of light not absorbed by chlorophyll a (the primary pigment at the reaction centre).
- This extends the range of wavelengths of light that can be used to drive photosynthesis.
- The energy they absorb is passed to the reaction centre / primary pigment / chlorophyll a in the photosystem.
Accessory pigments that absorb wavelengths not absorbed by chlorophyll a, extending the range of usable wavelengths, and pass the absorbed energy to the reaction centre / chlorophyll a.
Background Concept
Chlorophyll a is the primary pigment in the reaction centres of photosystems I and II. It is the only pigment that can directly convert absorbed light energy into chemical energy (as excited electrons that enter the electron transport chain). However, chlorophyll a does not absorb all wavelengths of visible light equally well — for example, it absorbs red and blue light strongly but absorbs green light poorly.
Plants also contain a range of accessory pigments, principally:
- Carotenes (e.g. β-carotene) — orange-yellow pigments.
- Xanthophylls — yellow pigments (oxygenated carotenes).
- Chlorophyll b — a yellow-green pigment.
These accessory pigments have absorption spectra that complement chlorophyll a, so together they harvest more of the incoming light energy.
Understanding the Question
The question asks specifically about the role of carotene and xanthophyll in photosynthesis. The mark scheme wants you to say what these pigments do — not what they are or where they are found.
Approach
The key idea is that these are accessory pigments: they assist the primary pigment (chlorophyll a) by absorbing additional wavelengths of light and then transferring that energy onwards. You need to make three things clear: (1) what they absorb that chlorophyll a does not, (2) the consequence of this (extending the wavelength range usable by the plant), and (3) what happens to the energy they capture (it is passed to the reaction centre).
Step-by-Step Reasoning
- Wavelengths absorbed. Carotene and xanthophyll absorb wavelengths of light (such as blue-green and other regions) that are not absorbed efficiently by chlorophyll a. In other words, they fill in the "gaps" in chlorophyll a's absorption spectrum.
- Extended range. Because of this complementary absorption, the overall range of wavelengths of light that the plant can use for photosynthesis is wider than it would be with chlorophyll a alone. More of the incoming solar energy is therefore harvested.
- Energy transfer. The energy absorbed by carotene and xanthophyll is passed on (by resonance transfer) to the reaction centre / primary pigment / chlorophyll a within the photosystem. From there, the energy can drive the photochemical reactions of the light-dependent stage.
Carotene and xanthophyll do not have their own reaction centres and do not directly emit electrons or reduce electron carriers; they are simply energy funnels.
Key Takeaways
- Accessory pigments broaden the absorption spectrum of the plant.
- The energy they capture is transferred to chlorophyll a — it is not used directly.
- This is why the action spectrum (rate of photosynthesis vs wavelength) does not perfectly match the absorption spectrum of chlorophyll a alone.
Common Mistakes
- Saying that carotene and xanthophyll carry out the light-dependent reactions — they do not; they only pass energy to chlorophyll a.
- Saying they "absorb all wavelengths" or "trap light" without specifying which wavelengths or what happens next.
- Confusing accessory pigments with primary pigments and saying chlorophyll a is the only pigment — chlorophyll a is the only primary pigment.
- Omitting any mention of energy transfer.
Things to Be Careful About
- Use the precise terms "reaction centre", "primary pigment" or "chlorophyll a" — these are the terms the mark scheme accepts for where the energy is passed to.
- "Accessory pigment" is the umbrella term the mark scheme wants.
- Note that the energy transfer is to chlorophyll a in the reaction centre, not to any chlorophyll a molecule in the antenna complex.
The light‑dependent stage of photosynthesis produces ATP and reduced NADP, which are used in the light‑independent stage.
Describe the light‑independent stage of photosynthesis.
Answer
- CO₂ combines with ribulose bisphosphate (RuBP), a 5-carbon acceptor, in a reaction catalysed by the enzyme rubisco. This is carbon dioxide fixation.
- The product is an unstable 6-carbon compound which immediately splits into two molecules of glycerate 3-phosphate (GP).
- GP is reduced to triose phosphate (TP) using reduced NADP and ATP (both supplied by the light-dependent stage).
- Most TP is used to regenerate RuBP, so the cycle can continue.
- Some TP leaves the cycle and is used to form hexose sugars (e.g. glucose, fructose), sucrose, starch, cellulose, lipids and amino acids.
- GP itself can be used to form amino acids.
- This cyclical series of reactions is called the Calvin cycle.
CO₂ combines with RuBP (catalysed by rubisco) to give an unstable 6C compound that splits into 2 GP; GP is reduced to TP by reduced NADP and ATP; most TP regenerates RuBP; some TP forms hexose sugars, sucrose, starch, cellulose, lipids and amino acids; the whole pathway is the Calvin cycle.
Background Concept
The light-independent stage of photosynthesis (also called the Calvin cycle, after its discoverer Melvin Calvin) is a cyclical series of enzyme-controlled reactions that takes place in the stroma of the chloroplast. It does not require light directly, but it depends on the products of the light-dependent stage: ATP (an energy source) and reduced NADP (a source of reducing power / hydrogen).
The overall purpose of the cycle is to fix inorganic carbon dioxide into organic molecules — ultimately carbohydrate — using the energy and reducing power supplied by the light-dependent stage. Each turn of the cycle fixes one molecule of CO₂; three turns fix three molecules of CO₂ and yield one molecule of triose phosphate (a 3-carbon sugar) that can leave the cycle.
Understanding the Question
The stem tells you that ATP and reduced NADP from the light-dependent stage are used in the light-independent stage. Part (c) asks you to describe the light-independent stage — that is, the Calvin cycle. Seven marks are available, so the answer should be a thorough, step-by-step account covering: the entry of CO₂, the role of rubisco and RuBP, the formation of GP and TP, the regeneration of RuBP, and what happens to the intermediates that leave the cycle.
Approach
Work systematically through the cycle in the order the reactions occur:
- CO₂ entry and fixation (combining with RuBP).
- The unstable 6C intermediate and its breakdown into GP.
- Reduction of GP to TP (using ATP and reduced NADP).
- Regeneration of RuBP from TP (using further ATP).
- Fate of the TP and GP that leave the cycle (the products of photosynthesis).
Keep the energy/reducing-power link to the light-dependent stage in mind throughout — that is what makes the cycle "light-independent but light-dependent in its products".
Step-by-Step Reasoning
- Carbon dioxide fixation. CO₂ combines with the 5-carbon acceptor molecule ribulose bisphosphate (RuBP). This reaction is catalysed by the enzyme rubisco (ribulose bisphosphate carboxylase/oxygenase), which is the most abundant protein on Earth. The combination of CO₂ with RuBP is called carbon dioxide fixation.
- Unstable 6C intermediate and GP formation. The product of CO₂ + RuBP is an unstable 6-carbon compound that has only a transient existence. It is immediately hydrolysed into two molecules of glycerate 3-phosphate (GP), a 3-carbon compound. (GP is also sometimes called 3-phosphoglycerate, 3-PGA.)
- Reduction of GP to TP. Each molecule of GP is then reduced (gains hydrogen) to triose phosphate (TP). The reducing agent is reduced NADP, and the energy required comes from ATP. Both of these were produced by the light-dependent stage. NADP is re-oxidised to NADP⁺ (which returns to the light-dependent stage to be reduced again), and ADP + Pi is released (which is re-phosphorylated to ATP in the light-dependent stage).
- Regeneration of RuBP. For every 6 molecules of TP produced, 5 are used to regenerate RuBP so that the cycle can continue. This regeneration step also uses ATP.
- Fate of the remaining TP. The 1 molecule of TP in 6 that does not get used to regenerate RuBP is a net product of the cycle. From this TP, the plant can make a wide range of organic molecules:
- Hexose sugars (glucose, fructose), which can be combined to form disaccharides such as sucrose and maltose, or joined to form polysaccharides such as starch (storage) and cellulose (cell walls).
- Lipids — the glycerol backbone and the carbon skeletons of fatty acids are made from TP.
- Amino acids — by adding amine groups, GP and TP can be converted to amino acids and hence to proteins.
- The whole cyclical pathway is known as the Calvin cycle. It takes place in the stroma of the chloroplast, where the relevant enzymes (including rubisco) are located.
Key Takeaways
- The Calvin cycle is the carbon-fixation pathway of photosynthesis.
- It needs ATP and reduced NADP from the light-dependent stage to run.
- CO₂ is fixed by combining with RuBP in a rubisco-catalysed reaction.
- The first stable product is GP (3C); this is reduced to TP (3C) using the products of the light-dependent stage.
- Most TP is recycled to RuBP; some TP leaves the cycle to form sugars, polysaccharides, lipids and amino acids.
- Six turns of the cycle (fixing 6 CO₂) give a net output of 2 TP molecules (one hexose equivalent).
Common Mistakes
- Saying the 6C compound is stable — it is unstable and breaks down almost immediately into two GP molecules.
- Forgetting the role of rubisco — this enzyme is the gateway to the cycle and is credit-worthy.
- Saying GP is oxidised to TP — the reverse is true; GP is reduced to TP.
- Confusing the direction of the cycle: GP → TP → RuBP, not the other way round.
- Saying the cycle produces glucose directly — glucose formation requires two TP molecules to combine, which is a separate step and not a single turn of the cycle.
- Stating the cycle takes place in the grana / thylakoids — it takes place in the stroma.
Things to Be Careful About
- Keep the role of ATP and reduced NADP clear: GP → TP uses both, RuBP regeneration uses ATP.
- Specify that the unstable 6C compound splits into two GP — do not say "into GP" or "into one GP".
- "Carbon dioxide fixation" is the technical term the mark scheme wants for the addition of CO₂ to RuBP.
- The use of "Calvin cycle" is an acceptable term for the whole pathway.
- "Hexose / sucrose / maltose / starch / cellulose / glycerol / lipids / amino acids" — the mark scheme accepts any of these as a credible product of TP, so you only need to name one or two to earn the mark.
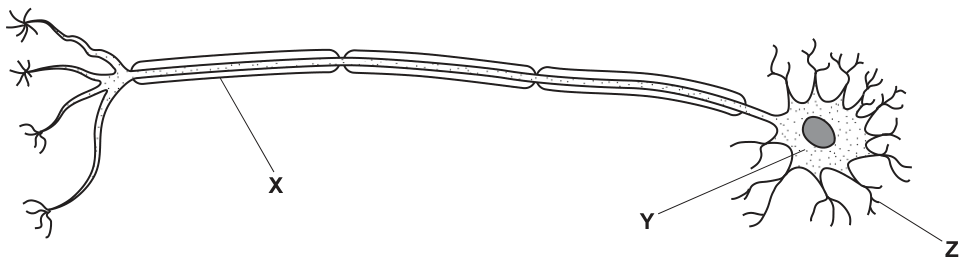
Fig. 8.1 is a diagram of a motor neurone.
Answer
X: Schwann (cell) ;
Y: cell body ;
X: Schwann cell; Y: cell body
Background Concept
A motor neurone carries action potentials from the central nervous system to an effector (muscle or gland). Its main features are:
- Cell body (soma) — contains the nucleus and most organelles; metabolic centre of the cell.
- Dendrites — short branched projections that receive incoming signals from other neurones.
- Axon — a long fibre that conducts the action potential away from the cell body.
- Myelin sheath — concentric layers of plasma membrane wrapped around the axon by Schwann cells in the peripheral nervous system (oligodendrocytes perform the equivalent role in the CNS).
- Nodes of Ranvier — small gaps between adjacent Schwann cells where the axonal membrane is exposed to the extracellular fluid and where voltage-gated channels are concentrated.
- Synaptic knobs (axon terminals) — the swollen ends of the axon that release neurotransmitter (acetylcholine from motor neurones) onto the next cell.
Understanding the Question
Fig. 8.1 is a motor neurone with three labels — X, Y and Z. You are asked to name:
- X — the cell wrapping the axon
- Y — the region containing the visible nucleus
Approach
Match each label to the standard anatomy. The wrapping of an axon is the work of a Schwann cell; the bulky region containing the dark oval (the nucleus) is the cell body.
Step-by-Step Reasoning
- X sits along the axon between two Nodes of Ranvier. Each myelin segment between two nodes is made by one Schwann cell. Note: myelin itself is a membrane, not a cell, so writing "myelin sheath" for X is rejected; the cell that produces it is the Schwann cell.
- Y points to the rounded mass at the right-hand end of the neurone, where the prominent dark oval is the nucleus. This is the cell body (soma). "Cytoplasm" is also acceptable, but cell body is the more precise term.
Key Takeaways
- Schwann cells are the peripheral-nervous-system glial cells that myelinate axons.
- The cell body is the region containing the nucleus — it integrates incoming synaptic input and maintains the neurone.
- When asked to name a structure on a diagram, give the most precise term (e.g. cell body, not cytoplasm or membrane).
Common Mistakes
- Writing "myelin sheath" for X — this is rejected because myelin is the membrane wrapped around the axon; the cell that makes it is the Schwann cell.
- Writing "nucleus" for Y — the nucleus is one organelle inside the cell body; the correct term is cell body.
- Confusing the cell body with a Node of Ranvier or with the axon terminal.
Things to Be Careful About
Read the arrowheads on the figure carefully: Y is the rounded swelling containing the dark oval, not the gap between two myelin segments.
Answer
intermediate neurone ; (allow relay neurone / sensory neurone)
intermediate neurone (or relay neurone / sensory neurone)
Background Concept
A motor neurone is not a standalone cell — it is part of a neural circuit. In a typical reflex arc the pathway is:
- Receptor → sensory neurone → intermediate (relay) neurone in the spinal cord → motor neurone → effector (muscle).
Motor neurones therefore receive synaptic input from sensory and intermediate neurones and send output to muscles.
Understanding the Question
Structure Z is the synaptic knob of the motor neurone. The question asks for a type of cell that forms a synapse with the motor neurone — i.e. a cell that is presynaptic to it, delivering the signal into it.
Approach
Think about what sits upstream of the motor neurone in a reflex arc. The cell that hands the signal to the motor neurone is the intermediate (relay) neurone; in some monosynaptic reflex arcs the sensory neurone synapses directly onto the motor neurone.
Step-by-Step Reasoning
In a typical reflex arc the intermediate neurone's axon terminals synapse onto the motor neurone's dendrites / cell body. So intermediate neurone is the best answer. Sensory neurone is also accepted because in some reflex arcs (e.g. the knee-jerk reflex) the sensory neurone synapses directly onto the motor neurone without an intervening intermediate neurone.
Key Takeaways
- Motor neurones are postsynaptic to sensory and intermediate neurones in CNS reflex circuits.
- The reflex arc is the simplest circuit in which to remember the connections of motor neurones.
Common Mistakes
- Naming "muscle cell" or "effector" — the muscle is the effector of the motor neurone (postsynaptic to Z), but the mark scheme does not accept it; the expected answer is another neurone.
- Confusing direction: motor neurones send signals to muscles and receive signals from sensory/intermediate neurones.
Things to Be Careful About
The phrasing "forms a synapse with" can be read either way round. In context, the examiner wants a neurone that is presynaptic to the motor neurone.
Table 8.1 shows some of the events that occur during muscle contraction. They are not listed in the correct order.
Table 8.1
| event | description of event |
|---|---|
| A | calcium ions diffuse out of sarcoplasmic reticulum |
| B | myosin heads bind to actin |
| C | sarcolemma depolarised |
| D | sarcomere shortens |
| E | calcium ions bind to troponin |
| F | T‑tubule system membranes depolarised |
| G | binding sites on actin exposed |
| H | myosin heads tilt |
| I | tropomyosin moves |
| J | troponin changes shape |
Complete Table 8.2 to show the correct order of the events that occur during muscle contraction. Two of the events have been completed for you.
Table 8.2
| correct order | letter of event |
|---|---|
| 1 | |
| 2 | |
| 3 | |
| 4 | |
| 5 | J |
| 6 | |
| 7 | |
| 8 | |
| 9 | |
| 10 | D |
Answer
| correct order | letter of event |
|---|---|
| 1 | C |
| 2 | F |
| 3 | A |
| 4 | E |
| 5 | J |
| 6 | I |
| 7 | G |
| 8 | B |
| 9 | H |
| 10 | D |
C, F, A, E, J, I, G, B, H, D
Background Concept
Excitation–contraction coupling links the arrival of an action potential at the muscle surface to shortening of the sarcomere. The sequence has three broad phases:
- Electrical excitation — depolarisation spreads across the sarcolemma and down into the T-tubules.
- Ca²⁺ release and tropomyosin shift — exits the sarcoplasmic reticulum (SR), binds troponin, and pulls tropomyosin off the actin's myosin-binding sites.
- Cross-bridge cycling and shortening — myosin heads bind actin, tilt (power stroke), release and rebind, dragging the thin filaments over the thick filaments and shortening the sarcomere.
Understanding the Question
Table 8.1 lists ten events (A–J) that occur during muscle contraction but in the wrong order. You must slot the correct letter into each row 1–10 of Table 8.2. Row 5 is already filled with J (troponin changes shape) and row 10 is already filled with D (sarcomere shortens).
Approach
Trace the cause-and-effect chain forwards from the start (sarcolemma depolarised) and backwards from the end (sarcomere shortens). Insert each event at the point where its cause is satisfied and its consequence makes sense.
Step-by-Step Reasoning
Working from the start:
- C — sarcolemma depolarised: the action potential arrives at the muscle surface.
- F — T-tubule system membranes depolarised: the depolarisation is conducted deep into the fibre via the T-tubules, which are continuous with the sarcolemma.
- A — calcium ions diffuse out of sarcoplasmic reticulum: depolarisation of the T-tubules opens voltage-gated -release channels (ryanodine receptors) in the SR, so flows down its gradient into the sarcoplasm.
- E — calcium ions bind to troponin: troponin has -binding sites; once is in the sarcoplasm it binds.
- J — troponin changes shape (given): binding causes a conformational change in troponin.
- I — tropomyosin moves: troponin's change of shape pulls tropomyosin away from the myosin-binding sites on actin.
- G — binding sites on actin exposed: with tropomyosin shifted, the myosin-binding sites are now accessible.
- B — myosin heads bind to actin: cross-bridges form.
- H — myosin heads tilt: the power stroke — ADP + Pi are released and the head pivots, sliding the thin filament.
- D — sarcomere shortens (given): repeated cross-bridge cycles pull the Z-lines closer together.
Key Takeaways
- Excitation–contraction coupling flows: electrical signal → release → troponin/tropomyosin shift → cross-bridge formation → power stroke → sarcomere shortening.
- The T-tubule system is essential: it carries the action potential deep into the fibre so that all myofibrils depolarise simultaneously.
- Troponin and tropomyosin are the regulatory proteins; is the trigger that unmasks actin's binding sites.
Common Mistakes
- Putting "myosin heads bind to actin" (B) before "binding sites on actin exposed" (G) — without exposed sites, myosin cannot bind.
- Putting release (A) after binding to troponin (E) — release must precede binding.
- Forgetting that T-tubule depolarisation (F) is the step between sarcolemma depolarisation (C) and SR release (A).
- Putting tropomyosin movement (I) before troponin change of shape (J) — J drives I.
Things to Be Careful About
The order tests logical dependence: each event must occur before its consequence. Work forwards from the depolarisation and backwards from the sarcomere shortening, and meet in the middle.
Lambert‑Eaton myasthenic syndrome (LEMS) is a rare disorder of the neuromuscular junction. A person with LEMS produces antibodies that bind to the voltage‑gated calcium channels on the presynaptic knob. One symptom of LEMS is weaker muscle contraction.
Suggest and explain why LEMS leads to weaker muscle contraction.
Answer
- Fewer ions enter the presynaptic knob (because antibodies bind to and block the voltage-gated channels).
- Fewer vesicles fuse with the presynaptic membrane, so less is released by exocytosis.
- Less binds to receptors on the sarcolemma (motor end plate).
- Fewer channels open / less enters the muscle fibre, so the sarcolemma is less depolarised / fewer action potentials are generated, leading to weaker muscle contraction.
Fewer Ca²⁺ enter presynaptic knob → less ACh released → less ACh binds to receptors → fewer Na⁺ channels open → less depolarisation → weaker contraction
Background Concept
At the neuromuscular junction the motor neurone's synaptic knob releases the neurotransmitter acetylcholine () onto the muscle fibre's motor end plate. The sequence is:
- An action potential arrives at the synaptic knob.
- Voltage-gated channels open and flows into the knob down its electrochemical gradient.
- The causes vesicles containing to fuse with the presynaptic membrane, releasing into the synaptic cleft (exocytosis).
- diffuses across the cleft and binds to nicotinic receptors on the motor end plate (sarcolemma).
- The receptors open, allowing (and some ) to flow; the net influx of depolarises the sarcolemma.
- If threshold is reached, an action potential fires and propagates along the muscle fibre, triggering excitation–contraction coupling (the events ordered in part (b)) and contraction.
The strength of muscle contraction is therefore set by the amount of released, which depends on how much enters the presynaptic knob.
Understanding the Question
In Lambert–Eaton myasthenic syndrome (LEMS), autoantibodies bind to and disable the voltage-gated channels on the presynaptic knob of motor neurones. The question asks you to suggest and explain how this leads to weaker muscle contraction — i.e. trace the consequences through the neuromuscular junction to the contraction itself.
Approach
Follow the synaptic-transmission chain step by step. At each stage, state how a smaller influx propagates to a weaker downstream effect, and end with the consequence for muscle contraction.
Step-by-Step Reasoning
- Ca²⁺ entry reduced. Antibodies bind to the voltage-gated channels on the presynaptic knob, so fewer channels are functional. When the action potential arrives, less enters the knob.
- Vesicle fusion reduced. is the trigger for vesicle fusion with the presynaptic membrane. With less inside, fewer vesicles fuse, so less is released into the synaptic cleft by exocytosis.
- Receptor activation reduced. Less in the cleft means fewer molecules bind to receptors on the motor end plate.
- Na⁺ entry reduced. Each -bound receptor opens to allow (and some ) through. With fewer receptors activated, fewer channels are open and less enters the muscle fibre.
- Depolarisation reduced. The end-plate potential is therefore smaller. It may not reach threshold, so fewer (or no) action potentials are generated, and excitation–contraction coupling is initiated less often / less strongly.
- Weaker contraction. Each of the events described in part (b) — release from the SR, troponin/tropomyosin shift, cross-bridge cycling — occurs less often or less synchronously, so the muscle contraction is weaker.
Any four of these links earns full credit; the mark scheme lists seven alternative or additional points.
Key Takeaways
- entry into the presynaptic knob is the trigger that couples the action potential to neurotransmitter release.
- Anything that reduces entry (in this case, autoantibodies against the channels) reduces release and therefore reduces muscle activation.
- LEMS is a useful contrast with myasthenia gravis, where the autoantibodies target the receptors on the muscle side rather than the channels on the neurone side — the clinical picture (weak muscles) is similar but the mechanism is different.
Common Mistakes
- Saying "less binds to receptors" without explaining why (because less was released, because less entered). Each link in the chain should be connected.
- Writing "less released from the SR" instead of "less enters the presynaptic knob" — the channels mentioned in the stem are on the presynaptic membrane, not on the SR.
- Saying "no muscle contraction" or "muscle cannot contract at all" — the contraction is weaker, not abolished, because the channels are not completely blocked and the effect is partial.
- Discussing the postsynaptic membrane instead of the presynaptic knob — the antibodies act on the knob.
Things to Be Careful About
- Mark scheme point 7 mentions "less released from the SR / less binding of to troponin / fewer sites exposed / fewer cross bridges" — this is an optional downstream point linking the synaptic effect back to the contraction events in part (b). It is acceptable but not required.
- Use precise terminology: "sarcolemma", not "postsynaptic membrane"; "presynaptic knob", not "axon terminal" alone; "exocytosis" for vesicle release.
- "Ignore postsynaptic membrane" in the mark scheme — the antibodies do not bind there.
The red ruffed lemur, Varecia rubra, is a mammal found only in the rainforests of the Masoala region in north east Madagascar.
Fig. 9.1 shows a red ruffed lemur.
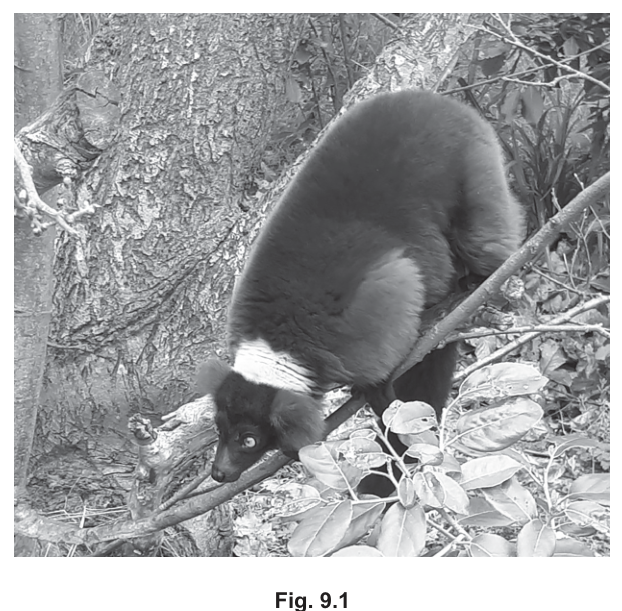
The International Union for Conservation of Nature (IUCN) Red List of Threatened Species™ states that the red ruffed lemur is critically endangered.
Suggest why the red ruffed lemur has become critically endangered.
Answer
Any three from:
- loss of habitat (e.g. deforestation of the Masoala rainforest for agriculture / logging / charcoal)
- hunted / poached for the illegal pet or fur trade
- climate change (e.g. altered rainfall patterns or increased cyclone frequency affecting the rainforest)
- competition for food / resources with humans or invasive species
- new disease (to which the lemur has no immunity)
- increased predation
Any three: habitat loss, hunting/poaching, climate change, competition for resources, new disease, illegal pet/fur trade.
Background Concept
The IUCN Red List categorises species by extinction risk. "Critically endangered" sits just below "extinct in the wild" — these populations face an extremely high risk of extinction in the immediate future. Species become critically endangered when one or more of their vital rates (births, deaths, dispersal) are pushed out of balance, typically by human activity.
The red ruffed lemur (Varecia rubra) is endemic to the Masoala peninsula of north-east Madagascar. Madagascar has been isolated for ~150 million years, so its lemurs have evolved without close relatives elsewhere and many are highly specialised to particular forest niches. Endemic species with small ranges are especially vulnerable because they have nowhere else to go when their habitat is altered.
Understanding the Question
The stem establishes that Varecia rubra is found only in the Masoala rainforests and is listed as critically endangered. You are asked to suggest reasons — that is, to come up with credible biological explanations that could account for the decline. You need three distinct points.
Approach
Think of the major categories of threat that drive species towards extinction, and apply each to a small-range rainforest mammal in Madagascar:
- Habitat-related threats: deforestation, fragmentation, degradation
- Direct exploitation: hunting, poaching, illegal trade
- Environmental change: climate change, altered rainfall
- Biological threats: new diseases, invasive predators/competitors
Pick the three you can support with the most specific detail.
Step-by-Step Reasoning
- Habitat loss — Madagascar has lost a large proportion of its primary forest to slash-and-burn agriculture ("tavy"), commercial logging, charcoal production and mining. The Masoala region has experienced significant deforestation, which removes the fruiting trees and canopy the lemurs depend on for food and shelter.
- Hunting / poaching — Lemurs are hunted for bushmeat in parts of Madagascar, and live animals are illegally captured for the exotic pet trade. Distinctive, brightly coloured primates like V. rubra are particularly sought-after.
- Climate change — Madagascar's climate is becoming drier and cyclones are becoming more frequent and severe. Both reduce forest productivity and fruiting, causing food shortages.
- Competition for food / resources — As human populations expand into forest margins, they harvest the same wild fruits the lemurs depend on, depleting food supply.
- New disease — Contact with humans, domestic animals or invasive species exposes lemurs to pathogens they have not co-evolved with, against which they have little immunity.
- Illegal pet / fur trade — Specific to attractive species like V. rubra; wild-caught individuals are sold on international markets.
Any three of these earn full marks.
Key Takeaways
- Critically endangered species usually face multiple, interacting threats — not just one.
- Endemic species with restricted ranges are the most vulnerable because they cannot migrate to alternative habitats.
- Madagascar's lemurs are the most threatened mammal group on Earth; habitat loss and hunting are the dominant drivers.
Common Mistakes
- Writing vague answers such as "human activity" without specifying which activity.
- Repeating the same idea in different words (e.g. "deforestation" and "habitat loss" together) — only one would be credited.
- Failing to make answers specific to a rainforest mammal in Madagascar.
Things to Be Careful About
- "Suggest" questions accept any biologically credible answer; the mark scheme lists the most common ones but is not exhaustive.
- Each marking point must be a distinct idea, not a paraphrase of another.
- Generic phrases such as "loss of biodiversity" or "extinction risk" earn no credit — name the mechanism.
Many zoos around the world operate captive breeding programmes for the red ruffed lemur.
Fig. 9.2 shows the numbers of captive‑born red ruffed lemurs in North American zoos from 1970 to 2020.
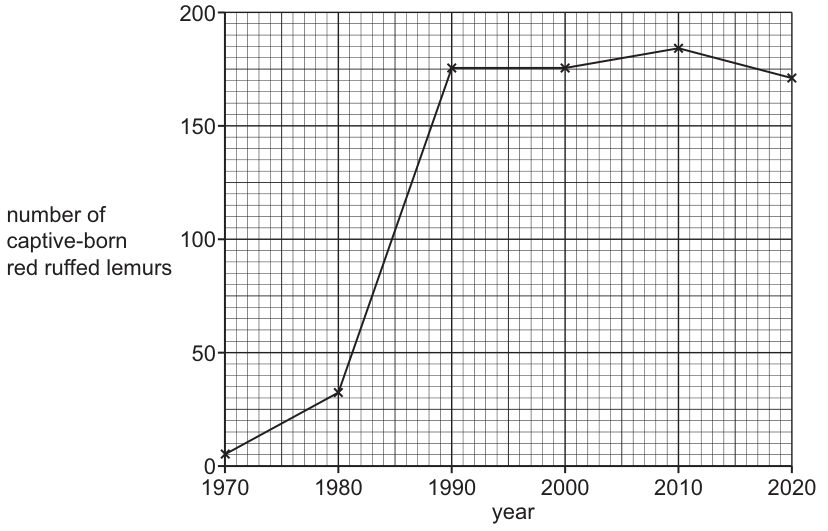
Describe the results shown in Fig. 9.2.
Answer
- Large / steep increase from 1980 to 1990 ;
- From 1990 onwards the number plateaus / remains roughly constant, with only small fluctuations (slight rise to 2010 then small decrease to 2020) ;
- Data quote: e.g. 32 in 1980 rising to 175 in 1990 ; OR 175 in 1990 remaining at 175 in 2000 ; OR 185 in 2010 falling to 170 in 2020.
Steep rise 1980–1990; plateau/fluctuation 1990–2020; e.g. 32 lemurs in 1980 to 175 in 1990.
Background Concept
Captive breeding programmes are run by zoos worldwide as insurance against extinction in the wild, and as a source of individuals for reintroduction programmes. Studbooks, coordinated by bodies such as WAZA (World Association of Zoos and Aquariums) and the regional zoo associations, track the pedigree of every individual in a managed population and recommend pairings to maintain genetic diversity.
Graphs of population data are a standard way to monitor programme success over time. When describing such a graph you should describe:
- the overall trend (general direction of change);
- any key transitions (sharp rises/falls, plateaus);
- a specific data quote to support your description.
Understanding the Question
Fig. 9.2 shows a line graph of the number of captive-born red ruffed lemurs held in North American zoos from 1970 to 2020. You are asked to describe the results — i.e. state what the graph shows, supported with data.
Approach
Identify the shape of the curve segment by segment:
- 1970 → 1980: small, slow rise (from 5 to about 32)
- 1980 → 1990: very steep rise (from 32 to 175) — the most prominent feature
- 1990 → 2010: roughly flat with a small rise to a peak around 2010
- 2010 → 2020: small decrease
Then select a specific data quote that supports one of these features.
Step-by-Step Reasoning
The most descriptive points are:
-
Trend 1 (the dominant feature): The number of captive-born lemurs increased very steeply/rapidly between 1980 and 1990.
-
Trend 2 (the later phase): From 1990 onwards the number remained roughly constant / plateaued, with only small fluctuations — a slight rise to a peak around 2010, then a small decrease by 2020.
-
Data quote — must give two numbers with their years, e.g.:
- "In 1980 there were about 32 captive-born lemurs; by 1990 this had risen to 175."
- "In 1990 there were 175 lemurs; in 2000 the figure was unchanged at 175."
- "At the 2010 peak there were about 185; by 2020 this had fallen slightly to 170."
Each marking point requires its own clear, separate statement.
Key Takeaways
- For "describe a graph" questions: trend → key transition → data quote is the reliable structure for full marks.
- Always pair each number with its year and the unit ("number of captive-born lemurs").
- Comparative language ("increased", "plateaued", "fluctuated", "decreased") is more informative than vague terms like "went up a lot".
Common Mistakes
- Quoting only one number — the mark scheme requires two numbers and two years.
- Only mentioning the start and end values without describing the shape in between.
- Confusing this captive-born dataset with the wild population — the graph is specifically captive-born individuals.
Things to Be Careful About
- The data values from the mark scheme are 1970 = 5, 1980 = 32/33, 1990 = 175, 2000 = 175, 2010 = 184/185, 2020 = 170.
- "Plateau" or "remains constant" is the technical term for the flat region — using it scores the second mark more clearly than "stays the same".
Captive breeding programmes for endangered mammals such as the red ruffed lemur can vary in their success rate.
Suggest problems that may affect the success of captive breeding programmes of mammals like the red ruffed lemur.
Answer
Any three from:
- stress (in captivity) due to confinement / human presence / restricted space ;
- reproductive cycle disrupted (lack of natural cues such as day length / food supply) ;
- may reject mate / refuse to breed / do not show correct courtship behaviour ;
- lack of suitable mates (few unrelated individuals of the right age / sex) ;
- enclosure too small / not a natural environment for an arboreal rainforest lemur ;
- expensive to maintain long term ;
- AVP e.g. inbreeding in a small closed population.
Any three: stress, disrupted reproductive cycle, mate rejection/lack of courtship, lack of suitable mates, enclosure too small/unnatural, cost, inbreeding.
Background Concept
Captive breeding programmes aim to maintain a self-sustaining population of an endangered species in zoos, both as insurance against extinction in the wild and as a source of animals for future reintroduction. In practice, captive breeding is biologically and logistically demanding, and many programmes have lower reproductive success than would occur in the wild.
Three broad categories of problem affect success:
- Behavioural/physiological: stress, disrupted reproductive cycles, mate rejection.
- Demographic/genetic: lack of suitable mates, small population size, inbreeding depression.
- Practical: enclosure design, cost, long-term commitment.
Understanding the Question
The stem reminds you that captive breeding programmes can vary in their success rate. You are asked to suggest problems that may affect this success — i.e. list credible reasons why a mammal like V. rubra might fail to breed well in captivity. You need three distinct ideas.
Approach
Think about what an arboreal, social rainforest mammal needs to breed successfully in the wild, and where a zoo enclosure might fall short:
- Stress: confinement, noise, visitors, lack of hiding places
- Reproductive cues: light cycles, temperature, food availability, social structure
- Mate choice and courtship: compatibility, learned behaviour
- Population size: too few unrelated individuals
- Environment: space, complexity, diet
- Money: long-term funding
Pick the three you can express most precisely.
Step-by-Step Reasoning
- Stress — Captivity is an unnatural environment. Constant exposure to visitors, noise, and confinement causes chronic stress, which elevates cortisol and can suppress reproduction through inhibition of GnRH and downstream hormones.
- Disrupted reproductive cycle — Wild lemur reproduction is timed by cues such as day length, rainfall and food availability, which may be absent or altered in captivity. The result can be anoestrus or failure to ovulate.
- Mate rejection / courtship failure — Lemurs have specific mating behaviours. Hand-reared or captive-born individuals may not have learned the correct courtship displays, or may simply not accept the mate chosen for them.
- Lack of suitable mates — A small captive population may contain no unrelated, sexually mature, genetically compatible individual of the opposite sex.
- Enclosure too small / not natural — Lemurs are arboreal and need a complex vertical environment. A cramped or featureless enclosure causes poor welfare and breeding failure.
- Cost — Long-term programmes require sustained funding for housing, veterinary care, staff and inter-zoo coordination.
- Inbreeding (AVP) — Small closed populations accumulate deleterious alleles through inbreeding depression, lowering fertility and survival.
Any three earn full marks.
Key Takeaways
- Captive breeding is harder than it sounds — biology, behaviour, genetics and logistics all conspire against it.
- Stress and disrupted reproductive cycles are common issues across many captive mammal species.
- Genetic management is critical: without it the captive population can become less fit than the wild one it was meant to conserve.
Common Mistakes
- Vague answers like "they don't breed well" — name the cause.
- Confusing the cause of decline in the wild (part a) with the problem of captive breeding (this part) — they are different.
- Saying "human error" or "not accurate enough" — these aren't specific to captive breeding biology.
Things to Be Careful About
- Each marking point must be a distinct idea; "stress" and "disrupted reproductive cycle" are not the same point.
- The mark scheme accepts "inbreeding" as an AVP; it overlaps with the genetic-diversity idea.
- Stay focused on mammals — predator-recognition problems, for instance, are more relevant to birds or fish.
Occasionally, wild‑caught red ruffed lemurs are introduced into captive breeding programmes.
Suggest why this is done.
Answer
To increase / maintain genetic diversity (heterozygosity / the gene pool), reducing inbreeding depression / homozygosity in the captive population.
To increase/maintain genetic diversity (heterozygosity) and reduce inbreeding depression.
Background Concept
A captive breeding programme is only as healthy genetically as the population it maintains. Small, closed populations lose genetic variation rapidly through genetic drift, and they accumulate deleterious recessive alleles through inbreeding. The result is inbreeding depression — reduced fertility, lower survival and increased susceptibility to disease.
Heterozygosity (having two different alleles at a locus) is the basis of genetic diversity. A population with high heterozygosity has a large gene pool and is more resilient to environmental change and disease.
Understanding the Question
The stem tells you that wild-caught lemurs are occasionally added to captive breeding programmes. You are asked to suggest why. The mark is for a single, precise genetic point.
Approach
Identify what a wild-caught individual brings that a captive-bred one cannot:
- New alleles not currently in the captive gene pool
- Increased heterozygosity
- Reduced risk of inbreeding depression
Express this in one crisp sentence using the mark scheme's vocabulary.
Step-by-Step Reasoning
Captive populations are descended from a small number of founders and have been closed for many generations. Over time, random drift and inbreeding reduce genetic diversity. Introducing a wild-caught individual brings in alleles that may be absent from — or only at very low frequency in — the captive population, which:
- increases / maintains genetic diversity (heterozygosity / the gene pool / hybrid vigour)
- and therefore reduces inbreeding depression / homozygosity.
Either phrasing — or both together — earns the mark. The key word is genetic.
Key Takeaways
- Wild-caught additions are a genetic insurance policy for captive populations.
- Genetic diversity is the raw material for adaptation; without it, a population cannot respond to new diseases or environmental change.
- Studbooks carefully track relatedness and recommend pairings across zoos for exactly this reason.
Common Mistakes
- "To increase the number of animals" — true, but not specific to wild-caught individuals (captive-bred ones also increase numbers).
- "To prevent extinction" — too vague; the precise point is genetic diversity.
- Saying "diversity" without the word "genetic" — too broad to earn the mark.
Things to Be Careful About
- The mark scheme explicitly requires the word "genetic" before diversity, or one of its equivalents (heterozygosity, gene pool, hybrid vigour); alternatively, mention inbreeding depression or homozygosity directly.
- One mark only — one crisp sentence is enough; do not write a paragraph.
Blood glucose concentration is maintained around a set point by homeostasis.
Explain the principles of homeostasis.
Answer
- A change in the factor (stimulus) is detected by a receptor.
- Information is passed via the nervous system to a coordinator (e.g. the brain / CNS / hypothalamus).
- Impulses or a (named) hormone are sent to an effector (muscle or gland).
- The effector carries out a response that returns the factor to its set point / norm.
- This is achieved by negative feedback, so that any deviation from the set point is corrected.
Stimulus → receptor → coordinator (CNS/brain) → effector (muscle/gland) → response → negative feedback returns factor to set point.
Background Concept
Homeostasis is the maintenance of a constant internal environment, even when the external environment changes. For any factor that is regulated (e.g. blood glucose concentration, body temperature, water potential), the body uses the same basic pathway:
- A receptor detects a deviation from the set point (the norm).
- A coordinator (usually part of the central nervous system — the brain, or specifically the hypothalamus for many factors) receives the information and decides on a response.
- A signal is sent to an effector (a muscle or a gland), which carries out a response.
- The response returns the factor to its set point through negative feedback — i.e. the response opposes the original deviation, so the system is switched off once the factor is back to normal.
Negative feedback is the key principle: any rise triggers mechanisms to bring the factor down; any fall triggers mechanisms to bring it up. The factor therefore oscillates around the set point rather than staying perfectly constant.
Understanding the Question
This is a generic 'principles of homeostasis' question. The candidate must give the standard pathway and the idea of negative feedback. Four marks are available, so four clear points are needed. The question stem specifically mentions blood glucose, but the marks are awarded for the general principle, not the glucose-specific example.
Approach
State the pathway in order: stimulus → receptor → coordinator → signal → effector → response. Then add the negative feedback idea — that the response returns the factor to the set point and is then switched off.
Step-by-Step Reasoning
- Receptor — a change in the internal factor (e.g. a rise in blood glucose) is detected by a specific receptor cell.
- Coordinator — information is sent to a coordinator, most commonly the brain / CNS / hypothalamus. This decides on an appropriate response.
- Signal to effector — impulses (along neurones) and/or a hormone (in the blood) are sent to the effector.
- Effector response — the effector (a muscle or a gland) carries out a response that opposes the original change.
- Return to set point — the factor is returned to its set point / norm.
- Negative feedback — because the response opposes the deviation, the system is self-correcting: once the factor is back to normal, the response is switched off. This is what makes homeostatic control stable.
Key Takeaways
- Homeostasis is the maintenance of a constant internal environment.
- The general pathway is: receptor → coordinator → effector.
- Negative feedback returns the factor to its set point and is the key principle that makes the system stable.
Common Mistakes
- Confusing receptor with effector — a receptor detects; an effector acts.
- Saying 'returns the factor to normal' without naming the mechanism (negative feedback) — both points are needed.
- Forgetting to mention the coordinator — the pathway is not receptor → effector directly; information must be processed.
- Writing 'the body responds' without specifying the type of response or the effector — a vague statement does not earn the mark.
Things to Be Careful About
- The mark scheme credits the idea that the response returns the factor to the set point, not just that a response occurs.
- 'Negative feedback' is a specific term and must be used (or described) for the final mark.
- A well-prepared answer mentions both a nervous and a hormonal signal as possible links between coordinator and effector — this matches the 'or (named) hormone' alternative in the mark scheme.
Glycogen phosphorylase catalyses the conversion of glycogen to glucose in liver cells. The production of glycogen phosphorylase is coded for by the gene PYGL.
A mutation in PYGL leads to a condition called glycogen storage disease type VI (GSDVI), in which glycogen is not broken down efficiently.
Suggest and explain why cell signalling by glucagon is likely to be affected in the liver cells of a person with GSDVI.
Answer
- The cell-signalling cascade still occurs: glucagon binds to its receptor on the liver-cell membrane, activating a G protein, which activates adenylyl cyclase, producing cAMP, which activates protein kinase A (PKA) and triggers the enzyme cascade.
- However, because the PYGL gene is mutated, the liver cell produces no (or non-functioning) glycogen phosphorylase, due to a change in the tertiary structure / active site of the enzyme.
- Therefore little or no glycogen can be broken down to glucose, so glycogenolysis is greatly reduced / does not occur.
The cAMP cascade still operates, but glycogen phosphorylase is non-functional (changed active site), so little or no glycogen is converted to glucose.
Background Concept
Glucagon raises blood glucose by binding to a receptor on the surface of liver cells and triggering an intracellular second-messenger cascade:
- Glucagon binds its transmembrane receptor.
- A G protein on the inner face of the membrane is activated.
- G protein activates adenylyl cyclase, which converts ATP to cyclic AMP (cAMP).
- cAMP activates protein kinase A (PKA).
- PKA begins a cascade that ultimately activates glycogen phosphorylase.
- Active glycogen phosphorylase breaks down glycogen to glucose 1-phosphate (glycogenolysis), raising blood glucose.
The PYGL gene codes for glycogen phosphorylase itself. A mutation can change amino acid sequence, which alters the protein's tertiary structure and therefore the shape of its active site, so the enzyme can no longer bind / catalyse its substrate efficiently. This is GSDVI.
Understanding the Question
The candidate is told that the PYGL gene is mutated, so the enzyme it codes for is defective. The question is asking why cell signalling by glucagon is 'likely to be affected'. The key reasoning is: the early signalling steps (receptor, G protein, adenylyl cyclase, cAMP, PKA) are themselves proteins coded by other genes, so they are still functional. What is missing or non-functional is the final target of the cascade — glycogen phosphorylase. The cell-signalling events still happen, but the metabolic end-point is lost.
Approach
First say the cascade still occurs (name two steps to earn the marks). Then state the consequence of the PYGL mutation: glycogen phosphorylase is absent or non-functional, with a change in active site. End with the metabolic outcome.
Step-by-Step Reasoning
- The cascade still happens — glucagon binds to its receptor on the liver cell, activates the G protein, which activates adenylyl cyclase, which converts ATP to cAMP, which activates protein kinase A. The mark scheme accepts any two of these details.
- The mutation affects the target enzyme — because PYGL is mutated, the liver cell produces no / less (functioning) glycogen phosphorylase, OR the glycogen phosphorylase produced is non-functioning.
- Why it is non-functioning — the mutation changes the tertiary structure of the enzyme, so the shape of its active site is altered and it cannot bind glycogen / catalyse glycogenolysis.
- Consequence — little or no glycogen is converted to glucose, so glycogenolysis is impaired and blood glucose cannot be raised by this route.
Key Takeaways
- A gene mutation affects the protein that gene codes for, not the unrelated proteins upstream in a signalling cascade.
- The glucagon cAMP cascade itself is intact in GSDVI; the target enzyme is the one that is defective.
- A change in amino acid sequence alters tertiary structure and the active site, abolishing enzyme activity.
Common Mistakes
- Stating that glucagon cannot bind its receptor — incorrect, because PYGL codes for glycogen phosphorylase, not the glucagon receptor.
- Saying the cascade 'cannot happen' — wrong; the cascade proteins are coded by other genes and are unaffected.
- Forgetting to link the mutation to a change in tertiary structure / active site — this is the underlying reason the enzyme is non-functional.
- Writing vaguely that 'glucagon signalling is reduced' without specifying which step is affected and which is not.
Things to Be Careful About
- The mark scheme explicitly requires naming the consequence of the mutation (no / less / non-functioning glycogen phosphorylase) and the structural reason (changed tertiary structure / active site).
- Note that 'cell signalling' is technically still occurring — the question's wording is a prompt to recognise that the defect is in the downstream enzyme, not in the cascade itself.
- The mark scheme allows credit for the alternative that the enzyme is not activated by the cascade, even if it is structurally intact — both interpretations are acceptable.
Glycogen synthase catalyses the conversion of glucose to glycogen in liver cells. The production of glycogen synthase is coded for by the gene GYS2.
A mutation in GYS2 leads to a condition called glycogen storage disease type 0 (GSD0) in which glycogen is not formed efficiently.
Suggest what the consequences would be if a person with GSD0 has a meal rich in glucose.
Answer
- Because the GYS2 gene is mutated, the liver produces no (functioning) glycogen synthase, so glucose cannot be stored as glycogen efficiently.
- After a glucose-rich meal, blood glucose concentration will remain high (hyperglycaemia) because the normal 'buffer' into glycogen is missing.
- Excess glucose is excreted in the urine (glycosuria), and more glucose is diverted into lipid synthesis, which can lead to raised blood lipid levels and weight gain.
- The high blood glucose inhibits the release of glucagon from the α cells of the pancreas (negative feedback), but because glycogenolysis is also limited, blood glucose may stay elevated for longer.
Blood glucose remains high after the meal, glucose is excreted in the urine, more glucose is converted to lipid, and glucagon release is inhibited.
Background Concept
After a carbohydrate-rich meal, blood glucose rises. The normal response:
- The rise is detected by β cells of the islets of Langerhans in the pancreas.
- Insulin is released.
- Insulin stimulates glucose uptake by muscle and adipose tissue, and in the liver it activates glycogen synthase, which converts glucose to glycogen for storage (glycogenesis).
- As blood glucose returns to normal, insulin release falls.
- The other key regulatory hormone is glucagon, released by α cells when blood glucose is low; glucagon raises blood glucose via glycogenolysis and gluconeogenesis.
Glycogen synthase is coded by GYS2. A mutation in GYS2 means the liver cannot efficiently convert glucose to glycogen, so the body's main short-term storage route for excess glucose is impaired (GSD0).
Understanding the Question
The question is 'suggest' — so the candidate is expected to reason through the consequences of the enzyme defect, not just state one. Three marks require three distinct, sensible points about what would happen if a person with GSD0 ate a glucose-rich meal.
Approach
Start with the immediate effect (glycogen cannot be stored), then think about where the excess glucose goes: it stays in the blood, spills into the urine, or is shunted into other pathways such as lipid synthesis. Finally, mention the hormonal feedback consequence (glucagon release is inhibited by high blood glucose).
Step-by-Step Reasoning
- The defect — GYS2 is mutated, so the liver produces no / less (functioning) glycogen synthase, or the enzyme produced is non-functional. Glycogen cannot be made from the excess glucose.
- Blood glucose remains high — without the glycogen buffer, blood glucose concentration stays elevated after the meal.
- Renal threshold exceeded — once blood glucose exceeds the kidney's transport maximum (~10 mmol dm⁻³), glucose appears in the urine (glycosuria), drawing water with it by osmosis (polyuria, dehydration, thirst).
- Lipid synthesis — excess glucose is diverted into lipogenesis (conversion to fatty acids and then triglycerides in the liver and adipose tissue), potentially leading to raised blood lipid levels and fat deposition.
- Hormonal feedback — the high blood glucose inhibits glucagon release from α cells (negative feedback). Because both glycogenolysis (in part b reasoning) and glycogenesis are impaired, the person has limited ability to control blood glucose either up or down by these routes.
- Other consequences — the mark scheme accepts an AVP such as: affects blood water potential (leading to dehydration, thirst, raised blood pressure), or produces long-term effects (tiredness, coma in severe cases, vascular damage similar to diabetes mellitus).
Key Takeaways
- Glycogen is the body's main short-term store of excess glucose from meals.
- If glycogen synthase is defective, the meal-derived glucose cannot be buffered by the liver.
- The consequences mirror several features of diabetes mellitus: hyperglycaemia, glycosuria, polyuria, raised lipid synthesis, dehydration.
- Loss of the glycogen storage route does not lower blood glucose on its own — it just removes the buffering capacity.
Common Mistakes
- Writing 'blood glucose will decrease' — wrong; with no glycogen storage, the excess glucose stays in the blood.
- Saying 'glucose will not be absorbed' — wrong; absorption in the gut is independent of the liver's storage enzyme.
- Missing the link to lipid synthesis or urine — the question asks for consequences, so several distinct points are needed, not just the hyperglycaemia.
- Confusing the direction of glucagon signalling — high blood glucose inhibits glucagon release (negative feedback); do not write the opposite.
Things to Be Careful About
- 'Suggest' questions require plausible reasoning, not absolute certainty — but the reasoning must still be biologically sound (e.g. linking hyperglycaemia to glycosuria is acceptable; linking it to sudden weight loss is not, since lipid synthesis would tend to increase mass).
- The mark scheme accepts AVP answers such as 'dehydration', 'thirst', 'raised blood pressure' or 'affects blood water potential' — any of these can be used as a third mark if the first three are stronger.
- The answer should be specifically about a person with GSD0, not a generic description of diabetes — phrase each point in the context of the enzyme defect.