Biology 9700/53 — May/June 2024
Cambridge A-Level · Planning, Analysis and Evaluation · worked solutions for every part, with the mark scheme
Topics Planning · Analysis, Conclusions and Evaluation
Blood vessels must be able to withstand and maintain varying blood pressures.
There are several methods that could be used to determine the strength of a blood vessel. One method is called the circumferential tensile strength (CTS) test, as shown in Fig. 1.1.
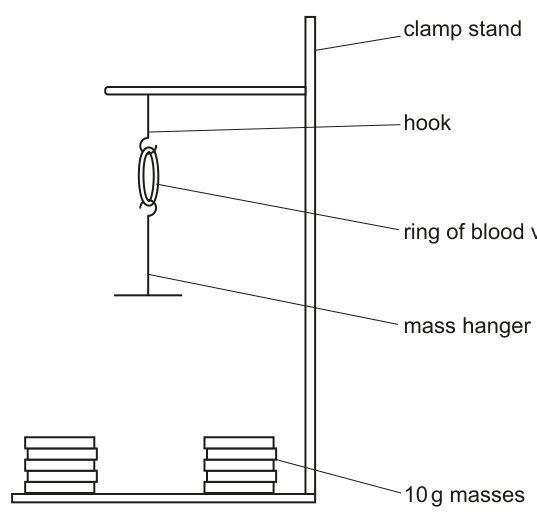
The ring of blood vessel, shown in Fig. 1.1, was cut from a length of artery or vein that was prepared by removing surrounding tissues.
A student wanted to use the apparatus in Fig. 1.1 to determine the mass needed to break an artery and the mass needed to break a vein.
Identify the independent variable and the dependent variable in this investigation.
independent variable = ______
dependent variable = ______
Answer
independent variable = type of blood vessel (artery and vein) ;
dependent variable = mass required to break (the blood vessel)
independent variable = type of blood vessel (artery and vein); dependent variable = mass required to break the blood vessel
Background Concept
Every scientific investigation involves variables that must be identified clearly. The independent variable (IV) is the factor that the experimenter deliberately changes (or selects between different conditions) from one trial to the next. The dependent variable (DV) is the factor that is measured and recorded because it is expected to change in response to the IV. A third category, controlled variables, are all the other factors held constant so they cannot influence the result.
In the CTS (circumferential tensile strength) test, the apparatus, ring dimensions, and procedure are kept the same for every trial. Any difference in the measured value must therefore be due to the factor the experimenter has chosen to vary.
Understanding the Question
The student wants to determine the mass needed to break an artery and the mass needed to break a vein using the CTS test apparatus shown in Fig. 1.1. The question is asking which factor is being changed on purpose between trials (the IV) and which factor is being measured and recorded (the DV).
Approach
Ask two straightforward questions about the experimental set-up:
- What does the student change between trials? → the type of blood vessel being tested (an artery or a vein).
- What does the student measure and record? → the mass at which the ring of blood vessel breaks.
The answer to question 1 is the IV; the answer to question 2 is the DV.
Step-by-Step Reasoning
The student will perform the test on two categories of vessel: an artery and a vein. The choice of which category of vessel to use is the factor the experimenter is deliberately varying, so it is the independent variable. The mass at which the ring breaks under the accumulated weights on the hanger is what the student records as the outcome of each trial, so it is the dependent variable.
Key Takeaways
- Independent variable: type of blood vessel (artery and vein)
- Dependent variable: mass required to break (the blood vessel)
- The IV is what the experimenter varies; the DV is what the experimenter measures
Common Mistakes
- Listing 'length of the blood vessel ring' or 'width of the vessel' as the IV — these are controlled variables in this investigation, not the deliberately varied factor
- Listing 'mass added to the hanger during the test' as the DV — this is a step the experimenter changes, not the outcome being measured at the breaking point
- Saying only 'artery' or only 'vein' as the IV without indicating that both are being compared
Things to Be Careful About
- The IV must name both categories being compared (artery and vein), not just one of them
- The DV must specifically refer to the breaking mass, not the mass added during the test
- 'Type of blood vessel' is accepted because the two categories being compared are 'artery' and 'vein'
The student was provided with lengths of a large artery, lengths of a large vein and standard laboratory apparatus.
Describe how the student could use the CTS test to determine the mass needed to break an artery and the mass needed to break a vein.
Your method should be set out in a logical order and be detailed enough to let another person follow it.
Answer
- Cut rings of the artery and the vein to the same length (e.g. 20 mm) using a scalpel, cutting away from the hand. Measure the length of each ring with a ruler and discard any rings that are damaged (e.g. nicked or crushed).
- Use rings of artery and vein from the same source (e.g. the same animal) to control for variation between individuals.
- Attach a ring to the upper and lower hooks of the CTS apparatus. Note the mass of the empty mass hanger and include it in the total mass.
- Add 10 g masses to the mass hanger one at a time, waiting a few seconds between each addition to see whether the blood vessel breaks.
- Record the total mass (mass of hanger + added masses) at which the ring breaks.
- Repeat the procedure at least three times for each type of blood vessel and calculate a mean breaking mass.
- Safety: wear gloves when handling the blood vessels to avoid contact with blood / pathogens, and cut away from the hand with the scalpel.
- To obtain a more accurate breaking mass, repeat the procedure with smaller mass intervals (e.g. 1–2 g) once the expected breaking mass is approached.
Cut rings of artery and vein to the same length, attach to the CTS apparatus, add 10 g masses in stages, record the total mass (hanger + masses) at break, repeat at least three times for each vessel and calculate a mean; wear gloves for safety; use smaller mass intervals near the breaking point.
Background Concept
The circumferential tensile strength (CTS) test is a mechanical test in which a ring of blood vessel is suspended between two hooks and increasing mass is applied. The mass at which the ring breaks is taken as a measure of the tensile strength of the vessel wall. A valid comparison between an artery and a vein requires that the only difference between the two sets of measurements is the type of blood vessel itself; everything else must be held constant or repeated enough times that random variation can be averaged out.
Understanding the Question
The student has lengths of a large artery and a large vein, and the apparatus in Fig. 1.1. They need a step-by-step method, in a logical order, that another person could follow to determine the mass needed to break an artery and the mass needed to break a vein. The method must be detailed enough to be reproducible.
Approach
A good planning answer for a Paper 5 method question covers, in logical order:
- how the sample is prepared (cutting, measuring, damage control);
- which variables are standardised (length, source, apparatus);
- the procedure itself (how masses are added, how the result is read);
- reliability (repeats and a mean);
- safety (hazard, risk and precaution);
- any refinement to improve the result (e.g. smaller intervals near the break).
The mark scheme lists 11 possible points and any 6 of them earn full marks. Aim to cover all the categories so the candidate cannot be caught out by missing a single one.
Step-by-Step Reasoning
Sample preparation. Rings of artery and vein are cut to the same stated length (e.g. 20 mm) with a scalpel. The length of each ring is measured with a ruler to confirm uniformity. Any rings that are visibly damaged (nicked, crushed, torn) are discarded, because a damaged ring will break at an artificially low mass and bias the result.
Standardising variables. Artery and vein rings should come from the same source (the same animal if possible) so that any difference between them is due to vessel type, not to individual variation, age, or species.
The procedure. A ring is attached to the two hooks of the CTS apparatus. The mass of the empty mass hanger is noted and added to the total. 10 g masses are added one at a time, with a pause of a few seconds between each addition so any break can be observed. The total mass (hanger + masses) at which the ring breaks is recorded.
Reliability. Each type of blood vessel should be tested at least three times and a mean calculated, so the result is not dependent on a single ring. Any anomalous result can be identified.
Safety. A scalpel is sharp, so cut away from the hand. Blood vessels are a biohazard, so wear gloves (and wash hands / disinfect surfaces afterwards) to avoid contact with pathogens.
Refinement. Once an approximate breaking mass is known, the test can be repeated with smaller mass intervals (e.g. 1–2 g) so the breaking mass is determined more accurately.
Key Takeaways
- A reproducible method requires standardising ring length, ring source and the apparatus
- Add masses in fixed steps (10 g) and record the total mass at the moment of break
- Repeat each vessel type at least three times and calculate a mean for reliability
- Safety: gloves for the biohazard and cut away from the hand with the scalpel
- A refinement (smaller mass intervals) improves the accuracy of the result
Common Mistakes
- Failing to specify how the mass is measured (the empty mass hanger must be weighed and added to the total)
- Forgetting to repeat and calculate a mean — a single ring of each type gives an unreliable answer
- Listing safety in general terms ('be careful') without naming the hazard (biohazard / sharp scalpel) AND the precaution (gloves / cut away from hand)
- Comparing rings of different lengths, so the result reflects length rather than vessel type
- Forgetting to include the mass of the mass hanger when reporting the total
Things to Be Careful About
- The mark scheme credits a stated length, not 'the same length' alone — give an example (e.g. 20 mm)
- 'Method to cut the blood vessel' must be named (e.g. scalpel, knife) for the first mark
- A safety mark requires BOTH a hazard AND a precaution — naming only one is insufficient
- Repeats: at least three measurements per vessel type AND a calculated mean are both required for the reliability mark
Another student investigated how the length of a ring of vein and the length of a ring of artery increases as more mass is added.
The student used the apparatus shown in Fig. 1.2 with the ring of vein.
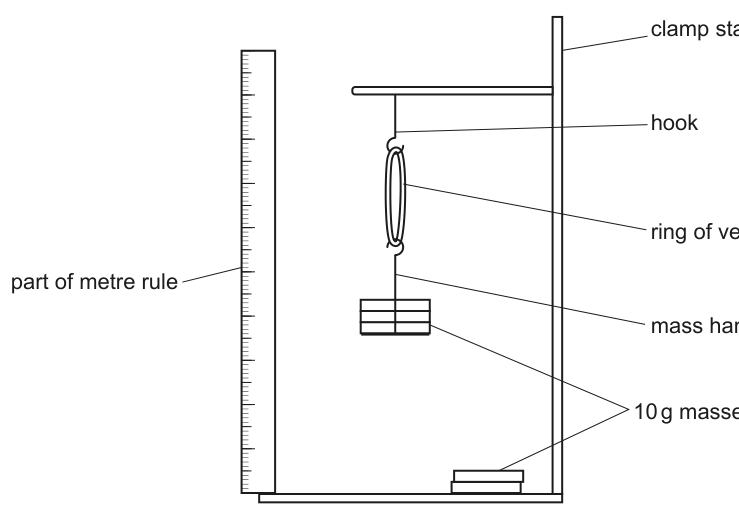
The results for the ring of vein are shown in Table 1.1.
Table 1.1
| mass added / g | length of ring of vein / mm | percentage increase in length of ring of vein |
|---|---|---|
| 0 | 21 | 0 |
| 10 | 36 | ……….. |
| 20 | 38 | 81 |
| 30 | 40 | 90 |
| 40 | 41 | ……….. |
| 50 | 41 | ……….. |
Complete Table 1.1 by calculating the percentage increase in length of the ring of vein for , and .
Working
Percentage increase = (new length − original length) / original length × 100, where the original length (at 0 g) is 21 mm.
At 10 g:
At 40 g:
At 50 g:
Answer
| mass added / g | percentage increase / % |
|---|---|
| 10 | 71 |
| 40 | 95 |
| 50 | 95 |
10 g → 71 %; 40 g → 95 %; 50 g → 95 %
Background Concept
Percentage change expresses how much a measured value has changed relative to its original (starting) value. It is calculated as:
Percentage change is useful when the original values are not all the same, because it standardises every change to a common reference (its own starting value), making different items directly comparable.
Understanding the Question
The table gives the length of the ring of vein at six different added masses. The percentage increase is already calculated for 0 g (0 %), 20 g (81 %) and 30 g (90 %). The three values to be filled in are for 10 g, 40 g and 50 g. The original length (at 0 g) is 21 mm.
Approach
For each of the three missing rows, apply the percentage change formula using the original length of 21 mm as the reference value. Show the substitution and the result, then round to the nearest whole number because the mark scheme accepts integer percentages.
Step-by-Step Reasoning
At 10 g the new length is 36 mm, so the increase is 36 − 21 = 15 mm. As a fraction of the original 21 mm:
Rounded to the nearest whole number: 71 %.
At 40 g the new length is 41 mm, so the increase is 41 − 21 = 20 mm. As a fraction of the original 21 mm:
Rounded to the nearest whole number: 95 %.
At 50 g the length is still 41 mm, so the increase is again 20 mm. The calculation is identical to that at 40 g, giving 95 %.
Key Takeaways
- Percentage change = (new − original) / original × 100
- Round percentage answers to the nearest whole number unless the question specifies otherwise
- When the length stops increasing (40 g and 50 g both 41 mm), the percentage increase also stops increasing (95 % at both)
Common Mistakes
- Dividing by the wrong value (e.g. dividing 15 by 36 instead of 21) — the original is the reference, not the new value
- Reporting a decimal value such as 71.4 % when an integer is expected, or quoting 95.2 % — the mark scheme accepts whole numbers
- Forgetting to multiply by 100, leaving the answer as a fraction or a decimal less than 1
- Using the wrong 'original' (e.g. the length at 10 g as the baseline for the 40 g calculation) — the original is always the value at zero mass
Things to Be Careful About
- The mark scheme awards 2 marks for all three values correct and a maximum of 1 mark for one or two correct — a single error costs only one mark but two errors cost a full mark
- The units of the answer are % (percentage), not mm — these are not lengths, they are relative changes
Explain why the student calculated the percentage increase in length of the ring of vein.
Answer
So that a valid comparison can be made (with other blood vessels), because the initial / starting length of the rings is not constant / may differ between vessels.
To allow a valid comparison because the initial length of the rings is not constant between vessels.
Background Concept
When two samples have different starting values, a direct comparison of their absolute changes can be misleading. A vessel that starts at 21 mm and stretches to 41 mm has gained 20 mm; a vessel that starts at 25 mm and stretches to 45 mm has also gained 20 mm, but the second vessel has stretched less in proportion to its original size. Percentage change normalises every measurement to its own starting value, allowing like-for-like comparison.
Understanding the Question
The student has calculated the percentage increase in length of the ring of vein for each mass added. The question asks the candidate to justify why this was done — i.e. what purpose the processing step serves.
Approach
Identify what the percentage processing overcomes. The candidate should recognise that blood vessel rings may have different starting (zero-mass) lengths, so an absolute change in length is not a fair comparison. Percentage change standardises every measurement to its own starting length.
Step-by-Step Reasoning
If the rings of artery and vein had the same starting length, the absolute change in length could be compared directly. However, the starting lengths of the rings are not necessarily the same, and the student must be able to compare the two vessels fairly. Converting the absolute change in length into a percentage of the original length removes the effect of the different starting lengths. The percentage increase in length can therefore be compared directly between vessels.
Key Takeaways
- Percentage change allows fair comparison when starting values differ
- It is a standard data-processing step in any investigation where the absolute value of a measurement depends on the size of the sample
Common Mistakes
- Saying 'to make the data easier to read' or 'to remove units' — these do not address the actual reason
- Saying 'to compare artery and vein' without explaining why a percentage is needed (the question is specifically about the percentage, not just any comparison)
Things to Be Careful About
- The mark scheme accepts either phrasing: 'to make a valid comparison (with other blood vessels / veins)' or 'allows comparison as initial / starting length is not constant'
- Only one well-articulated point is needed; do not pad the answer with restatements

Answer
Plot on Fig. 1.3:
- X-axis: mass added / g, linear scale from 0 to 50 g (extend to 60 g if the grid allows).
- Y-axis: percentage increase in length of ring of vein / %, linear scale from 0 to 100 %.
- Plot the following six points accurately:
(0, 0), (10, 71), (20, 81), (30, 90), (40, 95), (50, 95). - Draw a smooth curve of best fit through the points. The curve should rise steeply from 0 to 10 g, then more gradually between 10 and 30 g, and level off to a plateau between 40 and 50 g.
Graph plotted on Fig. 1.3 with mass added / g on the x-axis and percentage increase in length of ring of vein / % on the y-axis; six points plotted and a smooth curve drawn through them (see diagram-1).
Background Concept
A line graph in biology is used to show how a continuous variable (here, the percentage increase in length) changes as another variable is altered (here, the mass added). Conventions that must be followed to score full marks:
- The independent variable (the factor that was deliberately changed) goes on the x-axis.
- The dependent variable (the factor that was measured) goes on the y-axis.
- Both axes must be linear (equal spacing for equal numerical intervals) and use at least half the available grid.
- Axes must be labelled with the quantity AND its unit.
- Data points must be plotted accurately (e.g. with a small × or ●) and a smooth curve of best fit drawn through them — do not join points with straight line segments unless the data are clearly linear.
Understanding the Question
The candidate is given the data in Table 1.1 and a blank grid in Fig. 1.3, and must plot a graph of those data. The marks (3) are for the axes (orientation, scale and labels), and for the points and curve. The independent variable is the mass added, and the dependent variable can be either the length of the ring or the percentage increase. The percentage increase is plotted because it allows fair comparison with the artery in part (b)(iv) and the artery curve must start at the same point (0, 0) as the vein curve.
Approach
- Choose which column to plot on the y-axis. The mark scheme requires the y-axis to start at 0 and the artery curve to start at the same point; both work for either column, but the percentage increase is the more biologically meaningful variable for the upcoming comparison.
- Set up the axes with linear scales, label them with quantity and unit, and ensure each scale uses at least half the grid.
- Plot each of the six points accurately.
- Draw a smooth curve through the points.
Step-by-Step Reasoning
Axes and scale. The x-axis carries the mass added in grams, ranging from 0 to 50 g (with 10 g major intervals) and ideally extending to 60 g to use the full grid. The y-axis carries the percentage increase in length, ranging from 0 to 100 % (with 10 % major intervals). Both scales are linear.
Labels. The x-axis label is 'mass added / g'; the y-axis label is 'percentage increase in length of ring of vein / %'.
Points. The six points are (0, 0), (10, 71), (20, 81), (30, 90), (40, 95), (50, 95). Each is plotted carefully with a small cross or filled circle.
Curve. A smooth curve is drawn through the points. The shape is a steep rise from 0 to 10 g, a more gradual rise from 10 to 30 g, and a near-plateau from 40 to 50 g.
Key Takeaways
- Independent variable on x, dependent variable on y
- Linear scales, labels with units, points plotted accurately, smooth curve
- The shape of this curve is a steep initial rise followed by a plateau — characteristic of an elastic structure that is being stretched close to its limit
Common Mistakes
- Swapping the axes (mass on the y-axis, percentage on the x-axis) — the IV must go on the x-axis
- Using a non-linear scale or one that does not use at least half the grid — the graph becomes hard to read and loses marks
- Joining the points with straight line segments — the data are not linear and a smooth curve of best fit is required
- Forgetting the units on the axis labels ('%' is needed on the y-axis, 'g' on the x-axis)
- Omitting the (0, 0) point — the curve must pass through the origin because at 0 g added the length cannot change
Things to Be Careful About
- The mark scheme awards 1 mark for axes (orientation + linear scale), 1 mark for labels + units, and 1 mark for points + line. All three categories must be addressed.
- The y-axis must start at 0 so the artery curve in (b)(iv) can also start at 0
The student carried out the same investigation using a muscular artery instead of a vein.
Predict the shape of the curve you would expect for the muscular artery.
On Fig. 1.3:
- sketch the curve you predicted for the muscular artery
- label this curve with the word artery.
Answer
On Fig. 1.3, sketch a second smooth curve and label it artery. The artery curve must:
- start at the same point (0, 0) as the vein curve (because the y-axis is percentage increase, which is 0 at 0 g added);
- lie entirely below the vein curve;
- not cross or touch the vein curve;
- have a less steep initial rise and plateau at a lower percentage increase than the vein (e.g. around 50–60 % at high masses).
Artery curve sketched on Fig. 1.3: starts at (0, 0), lies below the vein curve throughout, does not cross it, and plateaus at a lower percentage increase than the vein (see diagram-2).
Background Concept
Arteries and veins have different wall structures. A muscular artery has a thick tunica media dominated by smooth muscle and elastic fibres, which gives it high tensile strength and the ability to resist stretching under high blood pressure. A vein has a much thinner wall with less smooth muscle and more collagenous connective tissue, so it stretches more readily under the same load.
Understanding the Question
The vein curve has been plotted in (b)(iii). The candidate must now predict and sketch the curve that would be obtained if the same experiment were carried out using a ring of muscular artery, and label the new curve 'artery'. The two marks are awarded for (1) the artery curve starting at the same point as the vein curve, and (2) the artery curve lying below the vein curve and not crossing it.
Approach
Use biological knowledge of artery structure to predict the shape of the artery curve:
- At 0 g, both vessels have a percentage increase of 0 (the y-axis is a relative change, so both curves must start at the origin).
- As mass is added, the artery should stretch less than the vein because its wall is thicker and contains more smooth muscle. The artery curve therefore lies below the vein curve at every non-zero mass.
- The artery curve should plateau at a lower percentage increase than the vein, but at a similar shape (a steep initial rise, then a plateau).
Step-by-Step Reasoning
Start at the same point. Because the y-axis is percentage increase, every curve must pass through the origin (0, 0) — adding zero mass cannot stretch a vessel.
Below the vein curve. Arteries are designed to withstand high pressures without excessive stretching. A muscular artery has a much thicker tunica media, with more smooth muscle, than a vein of similar lumen diameter. As mass is added, the artery will therefore stretch less (a smaller percentage increase) than the vein at every non-zero mass, so the artery curve lies below the vein curve throughout.
Does not cross. The relative ordering of the curves is determined by the wall structure. Arteries stretch less than veins across the whole range, so the curves never cross.
Plateau at a lower percentage. Both curves flatten as the vessel approaches its elastic limit, but the artery reaches a lower maximum percentage increase because its wall is more resistant to stretching.
Key Takeaways
- Both curves start at (0, 0) because the y-axis is a percentage (zero mass gives zero change)
- The artery curve lies below the vein curve because arteries stretch less than veins under the same load
- The artery curve does not cross the vein curve because the relative ordering holds at every mass
Common Mistakes
- Starting the artery curve above the vein curve — this would imply the artery stretches more, which is the opposite of the true biology
- Allowing the artery curve to cross or touch the vein curve — this implies the relative ordering changes, which it does not
- Forgetting to label the artery curve — the mark scheme requires the label
- Sketching the artery curve as a straight line — both vessels show a steep initial rise and a plateau, so the artery curve should have a similar shape, just lower
Things to Be Careful About
- The mark scheme gives 1 mark for the artery curve starting at the same point as the vein and 1 mark for it lying below the vein and not crossing it. Both marks are required for full credit.
- The label 'artery' must be written next to the new curve, not on the axis
Answer
Any two from:
- The artery curve starts at the same point (the origin) as the vein curve because the y-axis is percentage increase, which is 0 at 0 g added.
- (Muscular) arteries have a thicker wall / tunica media than the vein, or (muscular) arteries have more smooth muscle (in the wall) than the vein.
- Therefore arteries withstand more (blood) pressure and stretch less than the vein under the same added mass.
Artery curve starts at the origin (because percentage increase = 0 at 0 g); arteries have a thicker tunica media / more smooth muscle than veins, so they withstand higher pressure and stretch less.
Background Concept
The walls of arteries and veins are built differently because they have different mechanical jobs.
- A muscular artery has a thick tunica media dominated by concentric layers of smooth muscle with a generous supply of elastic fibres. This is what allows the artery to withstand the high, pulsatile pressure generated by the left ventricle and to recoil elastically between heartbeats.
- A vein has a much thinner tunica media, less smooth muscle and proportionally more collagen. Veins operate under low pressure and are designed to be distensible (to act as a reservoir) rather than to resist stretching.
The mechanical consequence is that, under a given load, an artery stretches much less than a vein of comparable lumen diameter.
Understanding the Question
The candidate has sketched a curve for the muscular artery on Fig. 1.3. The question asks them to explain the shape of that sketched curve. The marks are awarded for any two of: starting point explained; thicker wall / more smooth muscle; less stretching under the same load.
Approach
Combine biological structure (wall thickness, smooth muscle content) with the observed mechanical behaviour (less stretching). Make sure each point pairs a structural reason with a functional consequence, and remember to address the fact that the curve starts at the origin.
Step-by-Step Reasoning
Starting point. The y-axis is percentage increase, so at 0 g added every vessel has a percentage increase of 0. The artery curve therefore starts at the same point (the origin) as the vein curve. This is purely a consequence of the y-axis being a relative (rather than absolute) change.
Why the artery curve lies below the vein curve. A muscular artery has a thicker tunica media than a vein, with more smooth muscle in its wall. This structural difference is what allows the artery to withstand the high blood pressures in the arterial system. Mechanically, a thicker, more muscular wall resists stretching, so when the same mass is added to a ring of artery and a ring of vein, the artery extends by a smaller percentage of its original length. The artery curve therefore lies below the vein curve at every non-zero mass.
Shape (steep rise then plateau). Both vessels show the same general shape — a steep rise followed by a plateau — because both have an elastic limit beyond which the wall cannot extend further. The artery reaches a lower maximum percentage increase because its wall is more resistant to stretching in the first place.
Key Takeaways
- The starting point of the curve is a consequence of the y-axis being a percentage, not a biological difference
- The artery curve lies below the vein curve because arteries have a thicker tunica media with more smooth muscle
- This structural feature is what allows arteries to withstand higher blood pressure than veins
Common Mistakes
- Saying 'arteries are stronger' without naming the structural reason (thicker wall / more smooth muscle / thicker tunica media)
- Saying 'veins have thinner walls' alone — this is the converse and is fine, but the mark scheme credits the positive description of the artery (thicker wall, more smooth muscle)
- Forgetting to mention the y-axis when explaining the same starting point — the origin coincidence is a feature of percentage plotting, not a biological feature
- Saying 'arteries have more blood' or 'arteries carry oxygenated blood' — neither is relevant to tensile strength
Things to Be Careful About
- 'Tunica media' is the precise CIE term for the middle layer of the vessel wall; 'wall' alone is acceptable but less precise
- The mark scheme credits any two of the four points; the candidate does not need all four, but the structural reason AND the functional consequence are the most convincing pair
Another student suggested that the experiment should be repeated with more rings from the same blood vessels.
Suggest two other ways the student could modify the method to improve the quality of the results.
Answer
Any two from:
- Use smaller mass intervals (e.g. 1 g or 2 g) so the breaking mass / length change is measured more accurately.
- Extend the range of masses added (e.g. continue beyond 50 g) so the curve is more fully described, particularly the plateau region.
- Use a force meter / Newton meter / data logger instead of adding masses, so the force is read directly rather than calculated from added masses.
- Attach a pointer / fiducial mark to the ring of blood vessel, so the length can be read against a fixed scale and parallax is reduced.
- Use rings of the same / stated width of blood vessel, so any difference between rings is due to vessel type rather than wall thickness.
Answer
Two improvements: use smaller mass intervals; attach a pointer / fiducial mark to the ring to reduce parallax when measuring length.
Any two of: use smaller mass intervals; extend the range of masses; use a force meter; attach a pointer to the ring to reduce parallax; use rings of the same / stated width.
Background Concept
Improving the quality of experimental results means making the measurements more accurate (closer to the true value) and more precise (less spread between repeats). Common sources of error in this investigation include:
- coarse mass intervals (a ring may break at any point between two masses, so the recorded breaking mass is approximate);
- limited range of masses (the curve is only described up to 50 g, so the maximum stretch may not be reached);
- parallax error when reading the length of the ring against a ruler;
- variation in the width of the blood vessel ring (a wider ring has more wall material and will be stronger).
Each limitation can be addressed by a specific improvement.
Understanding the Question
The question asks for two OTHER ways the student could modify the method to improve the quality of the results, beyond the suggestion of repeating with more rings from the same blood vessels. Two marks are available; the mark scheme credits any two of five listed improvements.
Approach
Think about each step of the procedure and ask: where could the measurement be made more accurate, more precise or less affected by a confounding variable? Then pair each limitation with a specific, practical improvement.
Step-by-Step Reasoning
Smaller mass intervals. A 10 g step means the recorded breaking mass is only accurate to within 10 g. Reducing the step to 1 g or 2 g gives a much more accurate value of the breaking mass. The candidate can also add smaller intervals only once they are close to the expected break point, which saves time and masses.
Extend the range of masses added. The vein in Table 1.1 reaches a plateau at 40–50 g, but we do not know whether further mass would continue the plateau, reverse the trend (which would indicate plastic deformation), or break the vessel. Adding more masses would describe the curve more fully.
Use a force meter / Newton meter / data logger. Reading force directly from a meter removes the need to count masses and to weigh the mass hanger, and the meter can be read continuously rather than in steps. A data logger with a force transducer can record force against extension in real time.
Attach a pointer / fiducial mark to the ring. Reading the length of the ring directly against a ruler is subject to parallax because the observer's eye must align with the ring and the scale. A pointer (a small marker, e.g. a paper tag or a fiducial mark on the hook) gives a single, unambiguous reference point that can be aligned with the ruler.
Use rings of the same / stated width of blood vessel. The rings of artery and vein may have different wall thicknesses (and therefore different widths when cut into rings). Using rings of the same width ensures that any difference in the measured property is due to vessel type, not to wall thickness.
Key Takeaways
- A specific limitation must be paired with a specific improvement — vague 'be more accurate' answers do not score
- Common improvements in CIE Paper 5: smaller intervals, extended range, electronic measurement, parallax reduction, control of an additional variable
- The mark scheme credits any two of five listed improvements; the candidate does not need all five
Common Mistakes
- Restating the suggestion already given in the question (more rings from the same vessels) — the question explicitly says 'two OTHER ways'
- Vague suggestions such as 'be more careful' or 'use better equipment' — these do not name a specific improvement
- Improvements that are not relevant to this practical, e.g. 'use a buffer' or 'control the temperature' — this is a mechanical test, not a biochemical one
- Improvements that change the IV (e.g. 'use a different blood vessel') — this would no longer be a fair test of the same variable
Things to Be Careful About
- Each improvement must be specific. 'Smaller mass intervals' is acceptable; 'be more accurate with the masses' is not.
- The mark scheme requires the candidate to suggest a modification, not just identify a limitation. Naming the limitation alone is insufficient; the modification that addresses it must also be given.
Gibberellins are a group of plant hormones that are involved in the elongation of plant stems.
A student investigated the effect of two different concentrations of a gibberellin, known as , on stem elongation of 10-day old pea seedlings.
The student was given a stock solution of with a concentration of .
Describe a method the student could use to make a solution of with a concentration of and state the dilution factor used.
Working
Answer
Use a pipette to transfer of the stock solution into a volumetric flask, then make up to the mark with distilled water and mix; dilution factor = .
1 cm³ of stock solution to 149 cm³ of distilled water; dilution factor = 150
Background Concept
A serial dilution is a stepwise reduction in the concentration of a solution, used when the required concentration is much lower than that of the available stock. For a single-step dilution, the dilution factor is the ratio of the stock concentration to the final diluted concentration, and is also equal to the ratio of the total final volume to the volume of stock used. The volume of diluent required is therefore:
Understanding the Question
You are given:
- Stock concentration:
- Target concentration:
You must (1) describe how to make the diluted solution in a way the examiner would accept, and (2) state the dilution factor used.
Approach
First calculate the dilution factor by dividing the stock concentration by the target concentration. Then pick a convenient volume of stock (typically for clarity), and work out the corresponding volume of distilled water. Describe the method using standard laboratory glassware.
Step-by-Step Reasoning
- .
- If you use of stock, the final volume must be .
- Volume of distilled water to add = .
- Method: use a pipette to transfer of stock solution into a (or ) volumetric flask, then make up to the mark with distilled water and mix thoroughly.
Key Takeaways
- Dilution factor = for a single-step dilution.
- The diluent volume = (dilution factor − 1) × stock volume.
- Always state the volumes used; "dilution factor of 150" alone is not enough for the second mark.
Common Mistakes
- Adding of water to of stock instead of (the final volume should be , not the water volume).
- Using the reciprocal of the ratio (e.g. dividing the target by the stock).
- Forgetting the factor of when cancelling the powers of 10.
- Failing to mention mixing.
Things to Be Careful About
- Check by computing ✓.
- Mention mixing — without it, the solution will not be uniform and the concentration in any sample taken could be wrong.
- Use the correct glassware: a pipette for the stock (to measure a small volume accurately) and a volumetric flask for the final volume.
In the investigation, the student:
- used the two concentrations of : (high concentration ) and (low concentration )
- applied the high concentration to one batch of 10-day-old pea seedlings
- applied the low concentration to another batch of 10-day-old pea seedlings
- applied distilled water to a third batch of 10-day-old pea seedlings, as a control
- standardised all other variables
- measured the length of the stem of each seedling every two days until the seedlings were 20 days old
- calculated the rate of stem elongation in .
State one way in which the student could standardise the measuring of stem length.
Answer
Measure from a fixed reference point (e.g. from the top of the soil / base of the stem) to the top of the stem each time.
Measure from a fixed reference point (e.g. top of the soil) to the top of the stem each time.
Background Concept
In any comparative experiment, the measurement procedure must be carried out identically for every replicate and every treatment. This avoids introducing a systematic error caused by the way the measurement is taken. For living plant material like pea seedlings, the stem is curved, growing, and has soft tissue — all of which can change how a length is read off a ruler if the procedure is not fixed.
Understanding the Question
The student is measuring the length of the stem of each seedling at two-day intervals using a ruler. You are asked to state ONE way of standardising this measurement so the comparison between treatments is fair.
Approach
Think about what could vary if the student is not careful: where on the stem the ruler is placed, whether the stem is bent, and how the endpoints are defined. Any one of these, if fixed, removes a source of variation.
Step-by-Step Reasoning
- The mark scheme accepts several alternatives; the safest is to fix a reference point and an end point. For example: measure from the top of the soil (or the base of the stem where it meets the soil) to the tip of the apical bud at the top of the stem.
- Other acceptable answers: straighten the stem (gently, against a flat surface) before measuring, or lay a piece of string along the curve of the stem and then measure the length of the string.
- Only one of these needs to be stated for the mark.
Key Takeaways
- Standardisation in measuring means doing the same thing each time: same endpoints, same method, same instrument.
- Curved or flexible material like a stem needs special care — straightening, string tracing, or fixing both endpoints.
Common Mistakes
- Vague answers such as "use a ruler" or "measure carefully" — these do not state how the procedure is standardised.
- Stating multiple answers when only one is required (no extra credit, and may introduce contradictions).
Things to Be Careful About
- Be specific about where the measurement starts and ends. "Measure the stem" on its own is not a standardisation.
The results of the investigation are shown in Table 2.1.
Table 2.1
| age of seedling / days | mean stem length with high concentration added / cm | mean stem length with low concentration added / cm | mean stem length with distilled water added / cm |
|---|---|---|---|
| 10 | 2 | 2 | 2 |
| 12 | 4 | 2 | 3 |
| 14 | 7 | 5 | 4 |
| 16 | 6 | 12 | 7 |
| 18 | 20 | 15 | 8 |
| 20 | 25 | 21 | 8 |
| rate of stem elongation / | 2.3 | ………………… | 0.6 |
Complete Table 2.1 by calculating the rate of stem elongation in for the seedlings with low concentration added.
Working
Answer
1.9 cm day⁻¹
Background Concept
A rate is the change in a quantity per unit time. For the mean stem length of a batch, the rate of stem elongation over the whole experiment is given by:
The time interval here is the entire experiment, from the first measurement (day 10) to the last (day 20), i.e. 10 days.
Understanding the Question
Table 2.1 gives the mean stem length of the low-concentration batch at each two-day point. You need to fill in the rate of stem elongation in for that column.
Approach
Use the formula rate = change in length ÷ change in time. Use the values at the start and end of the experiment, since the rate quoted in the table is the overall rate over the full 10 days.
Step-by-Step Reasoning
- Initial length (day 10) = .
- Final length (day 20) = .
- Time interval = .
- .
Key Takeaways
- Rate = change in quantity ÷ change in time; for an overall rate over an experiment, use the start and end values.
- Always quote units ( here).
- The high-concentration and control rates are and respectively, so the low-concentration value of sits between them, consistent with a graded dose–response.
Common Mistakes
- Using only the last interval (e.g. day 18 → day 20) instead of the whole experiment.
- Using the change in length without dividing by the time interval (giving instead of ).
- Forgetting the unit.
Things to Be Careful About
- The values are means, so the rate you calculate is a mean rate — this is appropriate for the question.
- Note that the high-concentration result actually shows the mean stem length shrinking between day 14 and day 16 (7 → 6 cm), which is impossible biologically; the overall rate calculation averages over this anomaly.
A scientist stated that they did not have enough confidence in the results in Table 2.1 to make any conclusions.
State one reason to support the statement made by the scientist.
Answer
The (mean) stem lengths were measured only to the nearest cm, so the data are too imprecise to allow confident conclusions to be drawn (AW).
Lengths measured only to the nearest cm (low precision) / many anomalies in the results / no statistical test was carried out.
Background Concept
For experimental results to be considered reliable, the data should be:
- Precise — measured to a suitable resolution.
- Reproducible — anomalies absent or explained.
- Tested statistically — a statistical test should be carried out to determine whether observed differences are significant.
If any of these are missing, the scientist's confidence in the conclusions is reduced.
Understanding the Question
You are told the scientist does not have enough confidence in the results in Table 2.1. From the description of the method and the table itself, you must identify one specific reason that supports this lack of confidence.
Approach
Look at the method and the table for: precision of measurement, presence of anomalies, sample size, and whether a statistical test is mentioned. The mark scheme offers three alternative answers; the most obvious from the data is the low precision of the measurement.
Step-by-Step Reasoning
- The data in Table 2.1 are all whole numbers of cm; the problem says the student measured stem length in cm. For a pea seedling this is a very coarse resolution — a few mm of change between days is rounded away.
- Alternatively, the high-concentration data show a clear anomaly: the mean length drops from at day 14 to at day 16, which is impossible (a stem cannot shrink). The student does not appear to have identified or repeated this experiment.
- Also acceptable: no statistical test was performed to determine whether the differences between the treatments are significant.
Key Takeaways
- Low precision in measurement, anomalous data and lack of a statistical test all reduce confidence in results.
- Any one of these is sufficient to support the scientist's statement.
Common Mistakes
- Giving a vague answer such as "the results are not accurate" or "there is human error" — these do not refer to anything specific in the method or data.
- Stating more than one reason when only one is asked for (the mark scheme accepts alternatives, not additions for extra marks).
Things to Be Careful About
- An answer must refer to a specific feature of the method or data, not a general criticism of biology experiments.
Describe how the student could modify the investigation to increase confidence in the results.
Answer
Measure the stem lengths in mm (rather than cm) to increase the precision of the readings.
Measure the stem lengths in mm to increase precision (or: repeat the anomalous high-concentration experiment / increase the number of seedlings / measure at the same time every day).
Background Concept
A modification that increases confidence in results must address the specific weakness identified in (c)(ii). If the issue is low precision, the fix is to measure to a finer resolution. If the issue is an anomaly, the fix is to repeat the experiment. If the issue is no statistical test, the fix is to apply one.
Understanding the Question
You are asked to describe how the student could modify the investigation to increase confidence in the results. The modification should match the limitation identified in (c)(ii).
Approach
Pair the answer to (c)(ii) with an obvious improvement:
- Low precision (cm) → measure in mm.
- Anomalous data → repeat the experiment.
- No statistical test → carry out a suitable test (e.g. t-test, 95% CI).
- Few seedlings → use more.
- Variable time of measurement → measure at the same time each day.
Step-by-Step Reasoning
- The mark scheme accepts any of: measure lengths in mm, repeat the high-concentration experiment, measure at the same time every day (or for more days), or measure more seedlings.
- The most direct response that addresses the imprecision from (c)(ii) is to measure the stem lengths in mm.
- Any ONE of these for one mark is sufficient.
Key Takeaways
- Improvements must be specific and practical (e.g. "use mm" not "be more accurate").
- Improvements should match the limitation; a one-to-one link between problem and fix is the mark-scheme style.
Common Mistakes
- Vague improvements such as "be more careful" or "do more repeats" without saying what to repeat or how many.
- Stating an improvement that does not address the specific limitation (e.g. "use more gibberellin" for a measurement-precision problem).
Things to Be Careful About
- The mark scheme wants a specific, actionable change. "Repeat the experiment" on its own is not enough; you need to say which experiment and why.
The student found a study on the internet that considered the effect of different wavelengths of light on the concentration of two types of gibberellins, and , in pea plants.
In the study, 60 pea seeds were germinated and kept in the dark (no light) for seven days.
The pea seedlings were divided into four batches of 15:
- batch 1 remained in the dark
- batch 2 was exposed to blue light ()
- batch 3 was exposed to red light ()
- batch 4 was exposed to far-red light ().
After 4 hours the concentrations of and in the seedlings were measured.
Table 2.2 shows the results.
Table 2.2
| batch | wavelength of light / nm | colour of light | mean concentration standard deviation / fresh mass | mean concentration standard deviation / fresh mass |
|---|---|---|---|---|
| 1 | – | dark | ||
| 2 | 470 | blue light | ||
| 3 | 680 | red light | ||
| 4 | 750 | far-red light |
The student calculated the standard error (SE) and 95% confidence intervals (95% CI) for the data shown in Table 2.2. The formulae that the student used were:
key to symbols
= standard deviation
= sample size (number of observations)
= mean
Table 2.3 shows the calculated values for SE and 95% CI for the data from Table 2.2.
Table 2.3
| batch | SE for / fresh mass | mean 95% CI for / fresh mass | SE for / fresh mass | mean 95% CI for / fresh mass |
|---|---|---|---|---|
| 1 | 0.186 | 0.026 | ||
| 2 | 0.013 | 0.034 | ||
| 3 | 0.026 | 0.054 | ||
| 4 | ……………….. | ……………….. | 0.186 |
Complete Table 2.3 to show the calculated values for SE and mean 95% CI for the data from far-red light for (batch 4).
Working
Answer
; .
SE = 0.067; 95% CI = 1.38 ± 0.13
Background Concept
The standard error (SE) of the mean is an estimate of how far the sample mean is likely to be from the true population mean. It is calculated as
where is the standard deviation of the sample and is the sample size.
A 95% confidence interval (95% CI) is a range around the sample mean within which we are 95% confident the true population mean lies. The approximation used in CIE biology is
The factor of 2 is the standard approximation for a 95% CI from a normal distribution. If two 95% CIs do not overlap, the difference between the two means is statistically significant at .
Understanding the Question
Table 2.2 gives, for batch 4 (far-red light), the mean concentration (), the standard deviation () and the sample size ( seedlings). You must complete Table 2.3 by calculating the SE and the 95% CI.
Approach
- Apply the SE formula: .
- Multiply the SE by 2 and add / subtract from the mean.
- Round to match the precision of the other rows in Table 2.3 (three significant figures for SE; two decimal places for the CI half-width, matching e.g. , , ).
Step-by-Step Reasoning
- , .
- .
- .
- .
Key Takeaways
- SE decreases as the sample size increases ( in the denominator).
- 95% CI is approximately twice the SE on each side of the mean.
- Compare CIs visually: if they do not overlap, the difference between the two means is significant.
Common Mistakes
- Using (the original number of seeds) instead of (the number of seedlings in each batch).
- Forgetting to multiply SE by 2 for the CI half-width.
- Reporting too many or too few significant figures; the table uses three sig figs for SE (e.g. ) and two decimal places for the CI (e.g. ).
Things to Be Careful About
- The sample size in the SE formula is the size of the group whose mean and SD you are using — here, the 15 seedlings in batch 4, not 60 (the total number of seeds originally germinated).
- Round only at the end of the calculation to avoid rounding error.
Fig. 2.1 shows the bar chart of the results from the study.
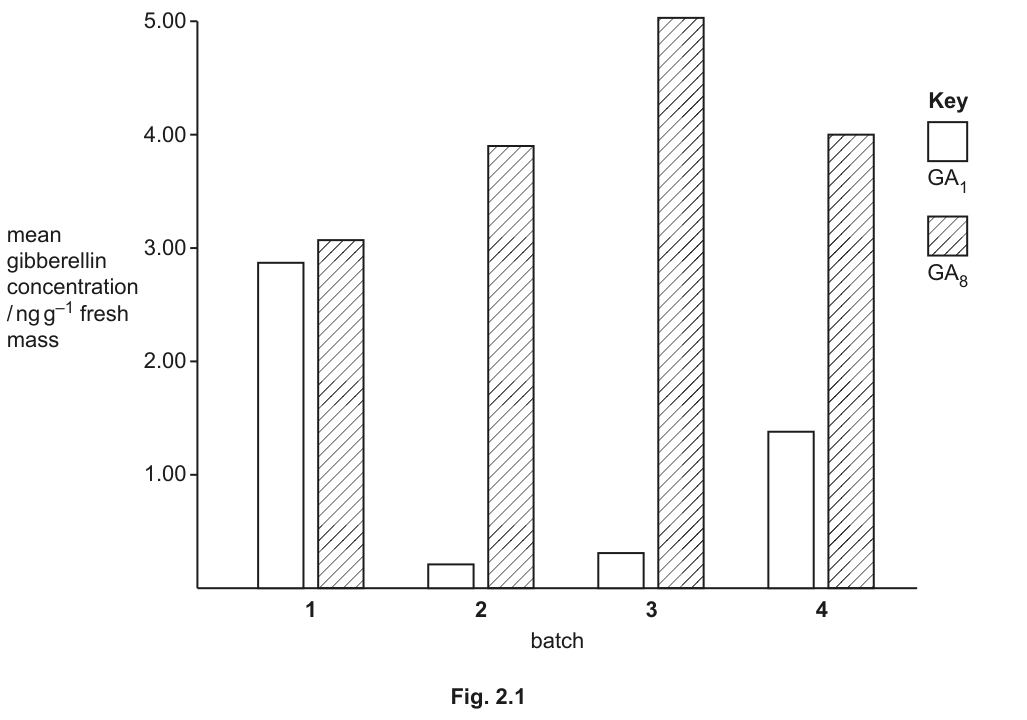
Use Fig. 2.1, Table 2.2 and Table 2.3 to state three conclusions about the effect of different wavelengths of light on the concentrations of and in plants.
Answer
Any three from:
- The highest mean concentration is in the dark () and the lowest is in blue light (); the highest mean concentration is in red light ().
- Under all three wavelengths of light, mean concentration is lower than in the dark and mean concentration is higher than in the dark.
- The 95% CIs for the means under each wavelength of light do not overlap with the dark CI, so the reduction in under light is statistically significant; the 95% CIs for the means under each wavelength of light do not overlap with the dark CI, so the increase in under light is statistically significant.
Three conclusions: (1) extremes (highest GA₁ in dark, lowest in blue; highest GA₈ in red); (2) GA₁ lower and GA₈ higher under all light than dark; (3) 95% CIs do not overlap between dark and each light, so differences are statistically significant.
Background Concept
Conclusions drawn from experimental data must be:
- Specific to the variable and the data shown.
- Comparative when two or more conditions are being contrasted.
- Supported by the statistics provided, in this case the 95% confidence intervals.
A 95% CI is a range within which the true population mean is expected to lie with 95% probability. A simple rule of thumb: if the 95% CIs of two means do not overlap, the difference between those means is statistically significant at . If they do overlap, no significant difference can be claimed from these data alone.
Understanding the Question
Fig. 2.1 and Table 2.2 give the mean and concentrations (with standard deviations) for four batches: dark, blue, red and far-red light. Table 2.3 gives the corresponding 95% CIs. You need to state three conclusions about the effect of wavelength of light on and concentrations in pea seedlings, using all three sources.
Approach
Read off the patterns from the chart and confirm with the numbers:
- The single largest / smallest values (the "extremes").
- The general direction of change between dark and each light treatment.
- Whether the CIs overlap when comparing two conditions — this tells you whether a difference is significant.
Step-by-Step Reasoning
-
Extremes (from Fig. 2.1 / Table 2.2):
- is highest in the dark () and lowest in blue light ().
- is highest in red light () and lowest in the dark ().
These are simple but specific conclusions.
-
General pattern:
- is lower in all three light treatments than in the dark (, , vs ).
- is higher in all three light treatments than in the dark (, , vs ).
This is a second conclusion.
-
Significance (from Table 2.3):
- dark CI: , so the range is approximately to .
- blue CI: , so the range is approximately to .
- These do not overlap, so the decrease in in blue light compared with the dark is significant.
- By the same logic, the CI for red (, range –) and far-red (, range –) do not overlap with the dark CI either, so the decreases under all wavelengths of light are significant.
- Similarly, the CIs under each light treatment (e.g. red light , range –) do not overlap with the dark CI (, range –), so the increases are significant.
This is the third conclusion.
Key Takeaways
- A conclusion should be both quantitative (refer to a value or CI) and comparative (compare conditions).
- Use the 95% CIs to make claims of significance, not just difference.
- When CIs do overlap, no significant difference can be claimed from these data alone.
Common Mistakes
- Vague conclusions: "light affects gibberellins" — too general, not specific to the wavelengths or types of gibberellin.
- Drawing conclusions from the means alone without checking the CIs, so missing the difference between "a difference exists in the means" and "a significant difference exists".
- Confusing and in the conclusions.
- Saying "there is no significant difference" when the CIs do not overlap — this is the opposite of what the data show.
Things to Be Careful About
- The non-overlap rule is a quick visual check; it is conservative (some non-overlapping CIs are just barely non-overlapping, so the difference is real, but a small overlap does not necessarily mean no significant difference). For CIE biology, the simple rule "CIs do not overlap → significant difference" is sufficient.
- Conclusions must refer to the wavelengths tested, not "light in general", because the three light treatments produce quantitatively different effects on (e.g. , , ).