Biology 9700/52 — May/June 2024
Cambridge A-Level · Planning, Analysis and Evaluation · worked solutions for every part, with the mark scheme
Topics Planning · Analysis, Conclusions and Evaluation
Tree plantations are areas where trees are planted for a particular purpose. Some tree plantations increase the supply of wood for construction and fuel. In many plantations, fast-growing, alien tree species are planted.
Undergrowth is found in and around plantations, increasing plant biodiversity. Undergrowth is mainly made up of indigenous (native) small plants and shrubs.
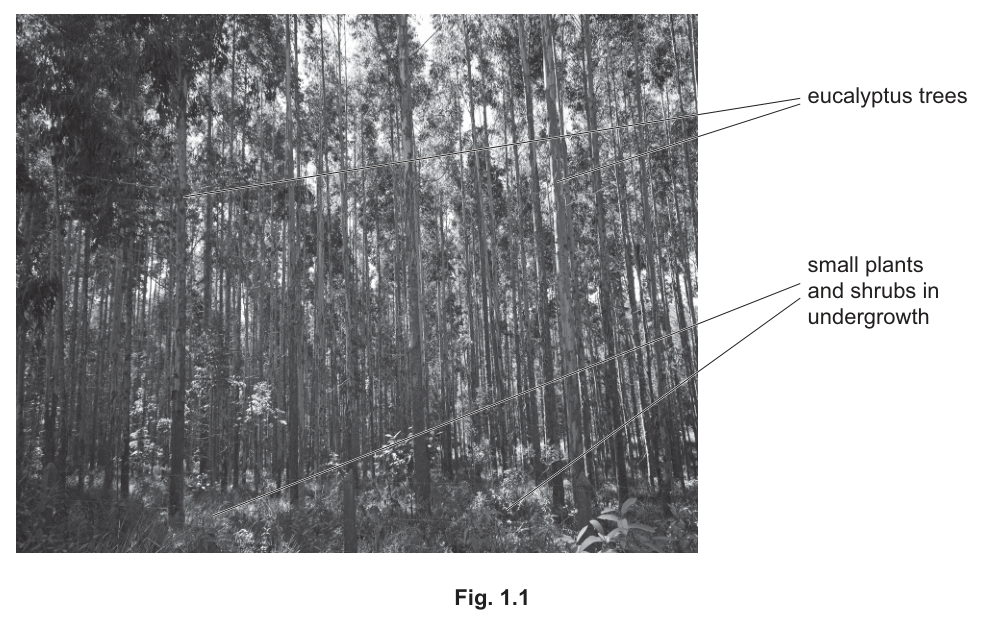
Fig. 1.1 shows part of a plantation of eucalyptus trees.
Bangladesh has many tree plantations as part of a national tree-planting programme.
Two fast-growing, alien tree species planted in Bangladesh are acacia, Acacia auriculiformis, and eucalyptus, Eucalyptus camaldulensis.
Acacia and eucalyptus are considered to be invasive species as they outcompete indigenous tree species such as sal tree, Shorea robusta, and mango, Mangifera indica.
Scientists carried out an investigation into the biodiversity of plant species in the undergrowth in plantations of alien trees compared with the undergrowth in plantations of indigenous trees.
The hypothesis that the scientists tested was stated as:
The undergrowth in plantations of alien tree species will have a lower biodiversity of plant species than the undergrowth in plantations of indigenous tree species.
Answer
Species of tree / type of tree.
Species (of tree) / type (of tree).
Background Concept
A scientific investigation has three types of variables. The independent variable (IV) is what the investigator deliberately changes between the experimental groups. The dependent variable (DV) is what is measured to see the effect of that change. Standardised (controlled) variables are kept the same so any difference in the DV can be attributed to the IV rather than to other factors.
Understanding the Question
The scientists compared the undergrowth plant biodiversity in plantations of four different tree species — two alien (acacia, eucalyptus) and two indigenous (sal tree, mango). The question asks which of these was the systematic factor the scientists deliberately varied.
Approach
Identify the factor that differs between the experimental groups while everything else about the plots (region, plot size, method, season) is held constant. That factor is the IV.
Step-by-Step Reasoning
The plantations are of four different species, and the scientists wanted to compare the undergrowth biodiversity in each. Species of tree is the only thing the scientists deliberately chose to vary; plot size, location, sampling method, and time of year were all held constant. Therefore the species of tree is the independent variable.
Key Takeaways
The IV is what the experimenter changes on purpose. The DV is what is measured (here, Simpson's index of diversity of the undergrowth). All other factors should be standardised.
Common Mistakes
Confusing the IV with the DV. Biodiversity (Simpson's index) is the DV, not the IV. Also, the region, season, plot size, and method are standardised, not the IV.
Things to Be Careful About
The mark scheme accepts the short answer 'species of tree' or 'type of tree'. There is no need to write 'alien vs indigenous tree species' — that is a description of the levels of the IV, not the IV itself.
For the investigation, plantations were selected within the same region of Bangladesh with the same environmental conditions.
• Three plantations of each tree species were selected: acacia, eucalyptus, sal tree and mango.
• A plot measuring by was studied within each plantation.
• For each plot, belt transects were used to collect the data needed to determine Simpson’s index of diversity ().
For each type of plantation, Simpson’s index of diversity () was calculated for the plant species in the undergrowth.
Each plot was studied in April, July and November.
Identify two variables the scientists standardised in this investigation.
Answer
Any two from:
- the (same) number / three of plantations for each tree species;
- the (same) size / area of plot ( / );
- (used a) belt transect — same method in all plots/plantations;
- (same) month(s) / season(s) (April, July, November) of the year / sampling at the same time(s).
Any two from: number of plantations (3 per species); size of plot (36 m × 36 m); same belt-transect method; same months/seasons of sampling.
Background Concept
A standardised (or controlled) variable is anything other than the independent variable that the experimenter deliberately keeps the same for every experimental unit. The point of standardisation is to ensure a fair test: if the only thing that differs between groups is the IV, then any difference in the dependent variable can be attributed to the IV rather than to a confounding factor.
Understanding the Question
The stem lists the design choices the scientists made: three plantations per species, plots of , all sampled with belt transects, each in April, July and November. The task is to pick two of these features that were deliberately held constant so that any difference in biodiversity could be linked to tree species rather than to the design itself.
Approach
Re-read the bullet points in the stem and identify the features that were identical for every plot. The mark scheme accepts any two from a short list, so choose the ones that are most clearly stated in the stem.
Step-by-Step Reasoning
- Same number of plantations: the scientists chose three plantations of each of the four species, so each species had an equal number of replicate plots. This rules out differences in sample size as an explanation for differences in .
- Same plot size: each plot was (). A larger or smaller plot would contain more or fewer species by chance, so standardising plot size removes this as a confounding factor.
- Same sampling method: belt transects were used in every plot, with the same data-processing (Simpson's index). Using different methods would change which species are detected.
- Same months of sampling (April, July, November): sampling at different times of year would catch plants at different growth stages, so the same months ensure all plots are compared at equivalent points in the seasonal cycle.
Any two of these earn the marks.
Key Takeaways
Standardised variables are the design choices that make a comparison fair. In a biodiversity investigation the most important ones are usually: number of replicates, plot size, sampling method, and timing.
Common Mistakes
Listing the independent variable (tree species) as a standardised variable. The IV is the thing that is varied, not held constant. Also, listing the DV (Simpson's index) — that is the response being measured, not something that is being standardised.
Things to Be Careful About
The stem gives precise values (, three plantations, three named months) and these are exactly the items the mark scheme credits. The phrasing 'any two from' means that two correct, distinct answers are required for both marks.
The scientists used belt transects to investigate the undergrowth of each plot.
Describe how you could use belt transects to collect the data needed to determine Simpson’s index of diversity () of the undergrowth in each of the plots.
Your method should be set out in a logical order and be detailed enough to let another person follow it.
Answer
- Stretch a tape (measure) / line / string across the plot to act as the transect line. Place a quadrat of the same size at regular (or stated) intervals along the tape, or use a continuous belt transect.
- In each quadrat, identify every plant species present (using a key, reference specimens, or expert help).
- Count the number of individuals of each plant species (n) in each quadrat — or estimate the percentage cover of each species.
- Repeat the process with at least three different belt transects in each plot (to obtain a representative sample).
- Safety: e.g. wear gloves, long trousers and a hard hat to protect against thorns and falling branches; work in a group / with a guide to avoid getting lost in the plantation.
Set up a belt transect (tape + quadrats at regular intervals) across each plot; identify every plant species in each quadrat; count individuals (n) or estimate percentage cover of each species; use ≥3 transects per plot; take a named safety precaution.
Background Concept
A belt transect is a line (tape, rope or string) laid across a sampling area, with quadrats placed along it at regular intervals (or a continuous strip). It samples an area in a systematic, repeatable way, which makes it suitable for comparing species composition between sites. Simpson's index of diversity () needs, for each species, the number of individuals in a sample of total individuals. So a belt transect must give the researcher a way to identify every species present and to count (or estimate the cover of) each one.
Understanding the Question
The stem already names the tool (belt transect) and the output (Simpson's for the undergrowth). The task is to describe a procedure in enough detail that another person could carry it out, including set-up, sampling, recording, replication and safety.
Approach
Plan a method with the following components: how the transect is laid; how the quadrats are placed; what is recorded in each quadrat; how replication is achieved; and a sensible safety precaution. State the practical steps in the order they would actually be done in the field.
Step-by-Step Reasoning
- Set up the transect. Lay a tape measure / line / string across the plot. This defines the transect line.
- Sample along the transect with a quadrat. Place a quadrat of the same size at regular (or stated) intervals along the tape — e.g. every 2 m — so that the same total area is sampled each time. A continuous belt (a strip of fixed width along the whole line) is an acceptable alternative.
- Identify each species. In each quadrat, identify every plant species present. Identification can be done with a published key, a reference herbarium, photographs, or local expertise. Identifications must be made consistently across plots.
- Record abundance. For each species in each quadrat, either count the number of individuals () — needed to compute Simpson's — or, if counting is impractical, estimate the percentage cover of each species. Simpson's strictly requires for each species, so counting is the more rigorous option.
- Replicate. Use at least three different transects within each plot so the sample is representative and anomalies can be spotted.
- Safety. In an unfamiliar plantation there are real hazards — thorns, falling branches, snakes, getting lost. State one specific precaution (gloves / long trousers / hard hat / walking stick / working in a group / guide / map / GPS / first-aid kit). The mark scheme gives a mark only when a hazard, a risk AND a precaution are all named.
Key Takeaways
A good ecological method has: a defined sampling unit, consistent placement of that unit, consistent identification, a numerical record per species, replication, and a risk assessment. Belt transects give a systematic sample; Simpson's needs the count (n) of each species, so identification plus counting is the core data collection.
Common Mistakes
- Describing the method without mentioning how Simpson's will actually be calculated — i.e. forgetting to count individuals or estimate cover.
- Using a quadrat without a transect, or vice versa — a belt transect needs both.
- Not stating that the quadrat size is constant or that placement is regular.
- Saying 'be careful' or 'wear PPE' as the only safety point — the mark scheme requires a named hazard, a named risk, AND a named precaution.
Things to Be Careful About
For safety marks, follow the format: hazard (e.g. thorny plants) → risk (e.g. cuts / skin punctures) → precaution (e.g. wear thick gloves). One coherent set earns the mark; vague generalities do not. The mark scheme also lists several valid combinations, so any of those will be accepted.
Table 1.1 shows the Simpson’s index of diversity () values the scientists obtained for the different plantations during April, July and November.
Table 1.1
| month | Simpson’s index of diversity () for undergrowth plant species in plantation | |||
|---|---|---|---|---|
| acacia | eucalyptus | sal tree | mango | |
| April | 0.90 | 0.87 | 0.94 | 0.90 |
| July | 0.86 | 0.86 | 0.94 | 0.86 |
| November | 0.87 | 0.83 | 0.94 | 0.88 |
| mean | 0.88 | 0.85 | 0.94 | 0.88 |
State and explain whether the data in Table 1.1 support the hypothesis:
The undergrowth in plantations of alien tree species will have a lower biodiversity of plant species than the undergrowth in plantations of indigenous tree species.
Answer
The data only partially support the hypothesis. The sal tree plantation (indigenous) has a higher mean () than both alien species (acacia , eucalyptus ), so this comparison supports the hypothesis. However, the mango plantation (indigenous) has the same mean as the acacia plantation (), so this comparison does not support the hypothesis.
The data only partially support the hypothesis: sal tree (indigenous) has a higher than both alien species, but mango (indigenous) has the same as acacia.
Background Concept
Drawing a conclusion from data means comparing the results to the original hypothesis and stating whether the data support it, partially support it, or do not support it. The conclusion must be specific to the data presented, not a general statement. Simpson's index of diversity () is a measure of biodiversity: higher means more diverse. Standard deviation () gives an idea of the spread of the three monthly values around the mean.
Understanding the Question
The hypothesis is: alien plantations will have a lower in their undergrowth than indigenous plantations. The data give the mean for four species. The task is to decide whether the data support this hypothesis, and to explain why.
Approach
Compare the means for each indigenous species with each alien species, paying attention to whether the ranges overlap. State the conclusion that the overall pattern supports.
Step-by-Step Reasoning
- Sal tree (indigenous) has mean . This is higher than acacia () and eucalyptus (). The standard deviations are small (0.00, 0.02, 0.02) and the ranges do not overlap, so the difference is real. This comparison supports the hypothesis.
- Mango (indigenous) has mean . This is the same as acacia () and higher than eucalyptus () — in the opposite direction to what the hypothesis predicts for at least one alien species. This comparison does not support the hypothesis.
- Overall, the data only partially support the hypothesis: one indigenous species (sal tree) shows a higher than the alien species, but the other (mango) does not.
The mark scheme accepts either direction of argument (does-not-support, OR partially-supports) provided it is correctly justified with a specific comparison from the table. The most defensible conclusion, given both comparisons, is 'partially supports'.
Key Takeaways
A conclusion must be supported by the data and qualified where the data are mixed. Comparing mean values alongside their standard deviations is a standard way to judge whether differences are likely to be meaningful. The mark scheme allows either 'not supported' or 'partially supported' as a 1-mark conclusion, provided the justification is correct.
Common Mistakes
- Saying 'the data support the hypothesis' without qualification, ignoring the mango-vs-alien comparison.
- Comparing only one pair of species and ignoring the others.
- Treating standard deviations as if they were standard errors and over-interpreting small differences.
Things to Be Careful About
The conclusion must be justified by the data — quoting the actual values and (if relevant) the values. Vague statements such as 'the indigenous values are higher' do not earn the mark on their own. The mark scheme gives credit for either the 'not supported' argument (acacia = mango) or the 'partially supports' argument (sal tree highest).
In China, a different group of scientists investigated whether the roots of invasive plant species produce chemicals that have an effect on the growth of other plants.
The scientists prepared an extract of the roots of staghorn sumac, Rhus typhina. Staghorn sumac is an invasive plant species.
The scientists prepared a stock solution of the root extract with a concentration of . The scientists then used the stock solution to prepare solutions with different concentrations of root extract.
Describe how the scientists could use the stock solution to prepare of solutions of the root extract with concentrations of and .
Answer
Apply with (stock) and (final volume):
| required concentration / | volume of stock solution / | volume of distilled water / |
|---|---|---|
7.5 mg cm⁻³: 37.5 cm³ stock + 12.5 cm³ water; 2.5 mg cm⁻³: 12.5 cm³ stock + 37.5 cm³ water.
Background Concept
A dilution reduces the concentration of a stock solution by adding solvent (here, distilled water). The relationship is , where and are the concentration and volume of the stock being diluted, and and are the concentration and volume of the diluted solution. Because the final solution has a fixed total volume (), the volume of solvent added is .
Understanding the Question
A stock solution of must be used to make of two new solutions: and . The question is how much stock and how much distilled water to mix for each.
Approach
Apply for each required concentration, then subtract the stock volume from to get the volume of water.
Step-by-Step Reasoning
- For :
Volume of water . - For :
Volume of water .
These two new solutions are part of a dilution series between the control () and the stock ().
Key Takeaways
is the workhorse equation for any dilution. The total volume is the sum of the stock volume and the diluent volume, so the diluent volume is always . Double-check that concentrations and volumes are in the same units throughout.
Common Mistakes
- Forgetting to subtract the stock volume from to obtain the water volume.
- Using as the final volume (confusing the and terms).
- Mixing up the two solutions — the solution needs MORE stock, not less.
Things to Be Careful About
Present the answer as a clear table with units on every entry, or as two clearly labelled statements ('for … and for …'). The mark scheme gives one mark per correct row, so both rows must be correct.
In some regions of China, marigold plants, Tagetes erecta, are grown commercially.
In the investigation into the effect of staghorn sumac root extract on the growth of marigolds, the scientists carried out the procedure described in step 1 to step 5.
step 1 Prepare five containers, each with five marigold plants grown from seed.
step 2 Add of distilled water to one of the containers. This is the control.
step 3 Add of the root extract concentrations to the other four containers, so that each container has a different concentration of root extract.
step 4 Repeat step 2 and step 3 each day for 60 days.
step 5 After 60 days, remove the marigold plants from the soil and untangle the roots. Measure the length of the longest root for each plant.
The scientists replicated this procedure twice and calculated the mean maximum root length for the control and for the root extract concentrations.
The results are shown in Table 1.2.
Table 1.2
| root extract concentration / | mean maximum root length after 60 days / |
|---|---|
| control | 163.0 |
| 2.5 | 153.2 |
| 5.0 | 156.4 |
| 7.5 | 152.0 |
| 10.0 | 141.6 |
Using the data in Table 1.2, calculate the percentage change in the mean maximum root length between the control and the roots treated with root extract concentration.
Show your working and record your answer to 3 significant figures.
percentage change = ______
Working
Answer
percentage change = -13.1%
-13.1%
Background Concept
Percentage change measures how much a value has increased or decreased relative to its starting value:
The result is positive if the value increased, negative if it decreased. The sign is important: a 'minus' answer means a decrease. To 3 significant figures means three digits after the first non-zero digit (e.g. 13.1, not 13).
Understanding the Question
The starting value is the control (). The final value is the treatment (). The question asks for the percentage change between these two, to 3 significant figures, and to indicate whether the root length decreased.
Approach
Substitute the two values into the formula, evaluate, and round to 3 s.f. The expected sign is negative because the treatment value is lower than the control.
Step-by-Step Reasoning
- Initial (control) = .
- Final () = .
- Difference = .
- Percentage change .
- To 3 significant figures: — and the sign confirms a decrease.
The mark scheme awards one mark for the correct process and correct figures, one for the answer to 3 s.f. (with ecf if the figures were wrong), and one for the negative sign (decrease).
Key Takeaways
Percentage change always uses the original value as the denominator. The sign tells the direction of change. To 3 significant figures means three meaningful digits, not three decimal places — so is correct here, not or .
Common Mistakes
- Dividing by the final value instead of the initial value.
- Giving a positive answer (dropping the minus sign) — losing the 'decrease' mark.
- Rounding to 2 s.f. () or 4 s.f. () instead of 3 s.f. ().
Things to Be Careful About
Show the full working — the mark scheme credits 'correct process AND correct figures'. Even with the right answer, omitting the working loses the process mark. The negative sign is worth a separate mark, so write it explicitly.
A student suggested that this investigation could be improved.
With reference to the method used and the data in Table 1.2, state and explain three ways to improve confidence in the results.
Answer
- Use more intermediate concentrations (e.g. between and ): this would give a clearer picture of the trend / pattern between root length and root-extract concentration, since the data at are anomalously high.
- Repeat the readings for the concentrations (e.g. , and ): to check for / exclude anomalous results and improve reliability.
- Calculate standard error / 95% confidence intervals / carry out a statistical test (e.g. -test) on the means: to determine whether the differences between the control and each treatment are statistically significant.
(Other accepted improvements: use marigold clones to remove genetic variation; use Vernier callipers for more precise root-length measurements; measure the mass of all the roots as well as the length.)
Three improvements: (1) use more intermediate concentrations to clarify the trend; (2) repeat the readings to check for anomalies and improve reliability; (3) apply a statistical test / standard error to judge whether differences are significant.
Background Concept
'Improving confidence in the results' means increasing either the reliability (consistency — can the result be reproduced?) or the validity (does the result actually answer the question?). Typical routes are: more replicates, more values of the independent variable, excluding anomalies, more precise measurement, controlling an uncontrolled variable, and using statistics to test whether observed differences are likely to be real. The mark scheme also accepts controlling a confounding variable (e.g. genetic variation between seedlings).
Understanding the Question
The data in Table 1.2 are:
| concentration / | mean root length / |
|---|---|
| control | 163.0 |
| 2.5 | 153.2 |
| 5.0 | 156.4 |
| 7.5 | 152.0 |
| 10.0 | 141.6 |
The pattern is not monotonic — at the mean is higher than at — which suggests either noise in the data or a real non-monotonic effect. The method used only five concentrations, measured root length with a simple ruler, and used seedlings that may differ genetically.
Approach
Identify three weaknesses in either the method or the data presentation, and for each suggest a specific, credible improvement that addresses it.
Step-by-Step Reasoning
- Concentrations are too widely spaced and the trend is unclear. Add more intermediate values (e.g. , , , ). This would reveal whether the point is genuinely anomalous or whether the dose–response is genuinely non-monotonic.
- No anomalies excluded, no sense of variability. The mean is given for each concentration, but the underlying variability is not. Repeat the readings, identify and exclude any anomalous values, and report a measure of spread (e.g. standard deviation, standard error, 95% confidence intervals) so it is clear how reliable each mean is.
- No statistical test. Calculate standard error and / or carry out a -test to check whether the differences between the control and each treatment, and between treatments, are statistically significant. A difference of may be real or may be within the natural variability of the seedlings.
- (Alternative) Genetic variation between seedlings. The marigolds were grown 'from seed' (step 1), so each plant will differ genetically. Use marigold clones (vegetative cuttings from one parent plant) to remove genetic variation as a confounding factor.
- (Alternative) Measurement precision. Root length is presumably measured with a ruler. Use Vernier callipers for a more precise reading.
- (Alternative) Single endpoint. Only root length is measured. Measuring the mass of all the roots gives a second, independent variable and improves the overall picture of growth.
Any three of these, each clearly linked to a weakness in the method or the data, earn the three marks.
Key Takeaways
'Improving confidence' is a specific kind of evaluation: it asks for both the improvement AND a brief justification (often 'to improve reliability' or 'to check for significance'). Vague answers like 'repeat the experiment' are worth less than a precise suggestion such as 'repeat with marigold clones' or 'calculate 95% confidence intervals'.
Common Mistakes
- Saying only 'repeat the experiment' without saying what to repeat or how many times.
- Suggesting improvements that do not address a weakness in the data or method (e.g. 'use a better lab').
- Ignoring the apparent anomaly at and the absence of any measure of variability in the data.
- Confusing improvements to the method with improvements to the hypothesis — the question is about confidence in the results, not the hypothesis.
Things to Be Careful About
Each improvement must come with a brief justification. The mark scheme pairs an improvement with an impact (e.g. 'more intermediate values → better idea of the trend'). Also, the candidates are restricted to suggestions based on the method used and the data given — improvements that require a completely different experiment do not earn credit.
To investigate the effect of the different root extract concentrations on the diversity of the microorganisms in soil, the scientists:
• took samples of soil from each of the containers
• identified and counted the number of species of microorganism present in the samples
• calculated the Simpson’s index of diversity () values for the species of microorganism in each of the soil samples.
State two variables the scientists should have standardised when taking the soil samples.
Answer
Any two from:
- the (same) mass of soil;
- sample from the same depth (in the container);
- sampled at the same time (of day / of the 60-day period);
- sample from the same distance from the (marigold) roots / same position in the pot.
Any two from: same mass of soil; same depth of sample; sampled at the same time; same distance from the roots / same position in the pot.
Background Concept
In a comparative investigation, every variable other than the independent variable should be standardised, so that any difference in the dependent variable can be attributed to the IV. When taking soil samples for a comparison of microbial diversity, the amount of soil, the location within the container, the time of sampling, and the depth all affect which microorganisms are picked up and in what numbers.
Understanding the Question
The scientists take soil samples from each container, identify and count the microbial species, and calculate Simpson's . The question asks which variables should be standardised so the comparison between containers is fair.
Approach
Think about what could differ between soil samples — mass, depth, time, location relative to the roots — and pick the two most important to standardise.
Step-by-Step Reasoning
- Same mass of soil: a larger sample contains more microorganisms by chance, so the same mass must be taken from each container.
- Same depth: microbial communities differ between the surface (oxygen-rich, exposed to light) and deeper layers (more anaerobic, in the root zone). Sampling at the same depth ensures each container is compared at the same level.
- Same time of sampling: if one container is sampled in the morning and another in the evening, temperature, moisture and microbial activity will differ. Sampling all containers at the same time removes this as a confounding factor.
- Same distance from the marigold roots / same position in the pot: the rhizosphere (soil immediately around the roots) has a different microbial community from bulk soil further away. Sampling at a consistent distance from the roots removes this effect.
Any two of these earn the marks.
Key Takeaways
In sampling designs, the four 'D's that often need standardising are: Depth, Distance, Date/time, and Dose (mass). The mark scheme here lists the relevant variants for soil sampling.
Common Mistakes
- Listing the IV (root-extract concentration) as something to standardise — that is the thing being varied, not standardised.
- Suggesting variables that cannot be controlled (e.g. 'the species of microorganism present' — that is what is being measured).
- Being too vague: 'take samples the same way' is not specific enough; 'take the same mass from the same depth at the same time' is.
Things to Be Careful About
The mark scheme offers four acceptable answers, of which any two earn the two marks. The variables must be ones that can realistically be held constant between containers — e.g. 'same soil type' is not relevant because the soil is presumably the same starting material in all containers.
Tumours may be described as benign or malignant. Malignant tumours can lead to greater complications for the person with the tumour.
Early identification of tumours, particularly malignant tumours, is important for effective treatment. Benign tumour cells and malignant tumour cells can look similar when viewed using a light microscope.
Some scientists wanted to develop a diagnostic test to identify tumour cells as benign or malignant. The scientists investigated whether the diameter of the cell nucleus could be used to identify the type of tumour cell as benign or malignant.
The scientists used a light microscope with a calibrated eyepiece graticule to measure the diameter of the nuclei of stained tumour cells.
Fig. 2.1 shows a photomicrograph of stained tumour cells viewed using a light microscope.
An eyepiece graticule was placed across the nucleus of one of the tumour cells.
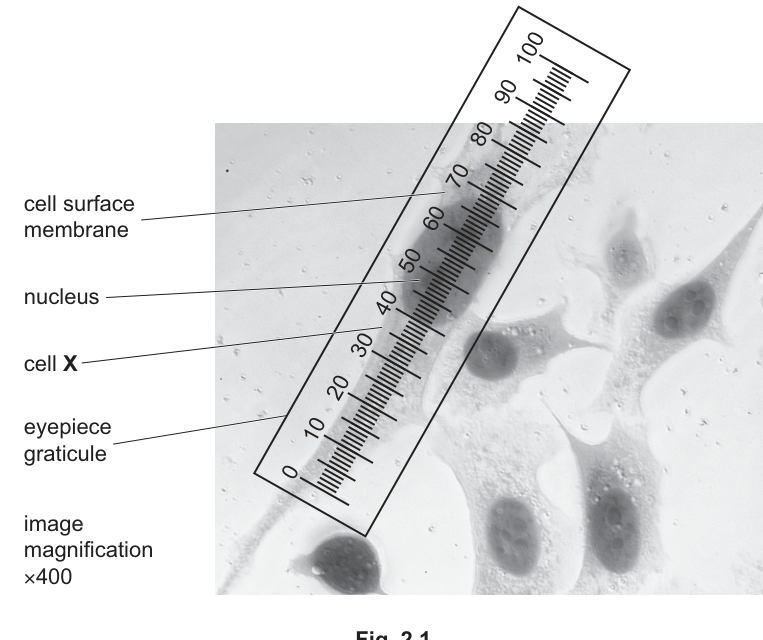
The calibration of the eyepiece graticule scale is:
one eyepiece graticule division =
Use the calibration of the eyepiece graticule scale to calculate the actual diameter of the nucleus of cell X, shown in Fig. 2.1.
Show your working and state your answer in .
actual diameter of the nucleus of cell X = ______
Working
Number of eyepiece graticule divisions across the nucleus of cell X = 28
Convert to μm:
Answer
actual diameter of the nucleus of cell X =
8.96 μm
Background Concept
The eyepiece graticule is a small glass disc, marked with a scale of (usually) 100 divisions, that fits inside the eyepiece of a light microscope. Because it sits in the eyepiece, the apparent size of each division depends on the objective lens in use. To convert graticule divisions into real (actual) distances, the graticule must be calibrated against a stage micrometer at every magnification used. Once calibrated, the graticule can be laid across a structure and the divisions counted to give the real size.
Unit conversions to remember:
Understanding the Question
The scientists have already calibrated their eyepiece graticule at the magnification used () so that one division on the graticule = . The candidate's task is to count the divisions spanning the nucleus of cell X in Fig. 2.1 and convert this into micrometres.
Approach
- Read the number of graticule divisions across the nucleus of cell X from Fig. 2.1.
- Multiply by the calibration value () to obtain the actual diameter in nm.
- Convert nm to μm by dividing by 1000.
Step-by-Step Reasoning
- The nucleus of cell X in Fig. 2.1 spans about 28 divisions on the eyepiece graticule (the mark scheme accepts any reading in the range 26–30, since judging the edge of a stained structure on a scale involves a small reading error).
- Each division represents at magnification, so:
- Convert to μm (divide by 1000):
The accepted range – corresponds to the divisions tolerance in reading the graticule.
Key Takeaways
- An eyepiece graticule must be calibrated (against a stage micrometer) at each magnification before it can be used to measure real lengths.
- Actual size = (number of divisions) × (real size of one division).
- Always quote the answer with the units requested and convert between nm, μm and mm as needed.
Common Mistakes
- Forgetting to convert nm into μm, leaving the answer as 8960 nm (the mark scheme rejects this if the question specifies μm).
- Reading the scale wrongly — e.g. counting from the wrong zero or using the wrong end of the nucleus.
- Trying to incorporate the magnification () into the calculation as well, double-counting it (the 320 nm calibration already accounts for the magnification).
Things to Be Careful About
- The calibration () is specific to this microscope at this magnification; it is not a universal value.
- Match the requested unit. The question asks for μm.
- Quote the answer to an appropriate number of significant figures (two sig figs here is sensible, matching the precision of the 320 nm calibration).
For the investigation into whether the diameter of the nucleus could be used to identify the type of tumour cell, tumours of the thyroid gland (an endocrine gland) were used.
For the diagnostic test the scientists carried out a procedure using two different stains.
step 1 50 people diagnosed with benign tumours and 24 people diagnosed with malignant tumours were selected.
step 2 A sample of tumour cells was removed from the thyroid gland of each person.
step 3 The cells were stained with either Papanicolaou stain (Pap) or haematoxylin and eosin stain (H&E).
step 4 Samples were viewed using a light microscope with a magnification of .
step 5 In each sample, the diameters of 100 nuclei were measured.
step 6 The measurements were made by one of the scientists who did not know the type of tumour cell they were measuring.
Table 2.1 shows the results of the investigation.
Table 2.1
| category | mean nuclear diameter / | standard deviation / | standard error / |
|---|---|---|---|
| total benign cells (50 people) 5000 cells: | 7.3 | ||
| • Pap-stained cells (41 people) 4100 cells | 7.3 | ||
| • H&E-stained cells (9 people) 900 cells | 7.2 | ||
| total malignant cells (24 people) 2400 cells: | 9.0 | ||
| • Pap-stained cells (18 people) 1800 cells | 9.0 | ||
| • H&E-stained cells (6 people) 600 cells | 8.8 |
Suggest how the scientists can standardise the method of measuring the diameter of the 100 nuclei in step 5, so that valid comparisons can be made between benign and malignant tumour cells.
Answer
Always measure the longest (widest) diameter of each nucleus.
Always measure the longest (widest) diameter of each nucleus.
Background Concept
A nucleus is roughly spherical, so its true diameter is the same in any direction. But on a microscope slide a nucleus may appear slightly oval, or the cut through it may be off-centre, so different 'diameters' can be measured. To make results from different nuclei (or from different scientists) directly comparable, the same dimension must be measured each time.
Understanding the Question
The procedure in step 5 says simply that 100 nuclei are measured per sample. To make valid comparisons between the benign and malignant samples, every nucleus must be measured in the same way. The question asks for a specific, observable way to standardise that measurement.
Approach
Pick a single, unambiguous dimension of the nucleus that can be identified by eye, and instruct the scientist to always measure that one. The longest (widest) axis is the easiest to identify and is therefore the standard choice.
Step-by-Step Reasoning
- A nucleus is not always perfectly circular, so several 'diameters' are possible.
- The longest (widest) axis is the most reproducible landmark: a scientist can quickly decide where the nucleus is widest and place the graticule there.
- If everyone measures the same dimension, any difference in mean diameter between samples reflects a real difference between the cells, not a difference in how they were measured.
Key Takeaways
- Standardisation in a measurement procedure is about removing a source of variation that has nothing to do with the variable being studied.
- Choosing a clear, reproducible landmark (the widest point) eliminates one source of error and makes inter-sample comparisons valid.
Common Mistakes
- Vague answers such as 'measure carefully' or 'be precise' — these don't tell the scientist what to do differently.
- Suggesting that 100 nuclei are measured (this is already in the procedure, not a standardisation).
Things to Be Careful About
- The mark scheme requires a specific, measurable feature (widest / narrowest / longest axis), not a general statement about being consistent.
Identify one variable that the scientists have standardised in step 1 to step 6, other than details of the method of measurement of the nuclei.
Answer
The same magnification () was used for all measurements.
The same magnification (×400) was used for all measurements.
Background Concept
A controlled (standardised) variable is anything the scientists kept the same across every sample so that it could not be the cause of any difference in mean nuclear diameter. Anything deliberately fixed in the procedure counts as a control.
Understanding the Question
The question asks for ONE variable that has already been standardised in steps 1–6, but is not about the method of measuring nuclei itself. The procedure list (steps 1–6) contains many standardisations — magnification, number of nuclei measured, source organ, the scientist measuring, the scientist being blind to the diagnosis. Any one of these is acceptable.
Approach
Pick the most obvious, easily quoted one. Using the same magnification for every sample is the most important standardisation for a microscope-based measurement, because the calibration of the eyepiece graticule changes with magnification.
Step-by-Step Reasoning
- Step 4 states that all samples are viewed at magnification. This is a deliberate control: if the magnification varied, the apparent size of nuclei would change and the comparison would be meaningless.
- The 100 nuclei measured per sample (step 5) is also a control, but the question excludes measurement-method details — using 100 nuclei is part of the measurement method, so not a good choice here.
- Using the same scientist (step 6) and not telling the scientist the tumour type (step 6) are also valid answers, as is using thyroid tissue for every sample (step 2).
Key Takeaways
- In a controlled experiment, almost every step that fixes a parameter is a control. The mark scheme accepts any one of them.
- Choose the one that is most clearly stated in the procedure and is not the excluded category (method of measurement).
Common Mistakes
- Quoting a measurement-method detail (e.g. '100 nuclei per sample') — the question explicitly excludes these.
- Quoting an uncontrolled factor as if it were standardised (e.g. 'the age of the patients' is not standardised in the procedure).
Things to Be Careful About
- Make sure your answer is a true standardisation, not an unmentioned assumption.
The scientists used a -test to compare the mean nuclear diameter of the Pap-stained cells and the H&E-stained cells in Table 2.1.
State a null hypothesis for the -test.
Answer
There is no significant difference in the (mean) nuclear diameter of the Pap-stained cells and the H&E-stained cells.
There is no significant difference in the mean nuclear diameter between the Pap-stained and H&E-stained cells.
Background Concept
A t-test compares two sample means to decide whether the difference between them is statistically significant (i.e. likely to reflect a real difference between the populations) or simply due to random sampling variation. To use it, the scientist must first state a null hypothesis (H₀) and an alternative hypothesis (H₁). The null hypothesis always says that there is NO difference (or no effect) in the populations from which the samples were drawn; the alternative says there IS a difference.
In this case the two samples are:
- Pap-stained cells (mean , for benign, 1800 for malignant, etc.)
- H&E-stained cells (mean for benign, for malignant)
The t-test will give a p-value: the probability of obtaining a difference at least as large as the one observed, assuming the null hypothesis is true.
Understanding the Question
The candidate must write a null hypothesis for the t-test that compares the mean nuclear diameter of Pap-stained cells with the mean nuclear diameter of H&E-stained cells, using only the data for the relevant category (the question doesn't specify which category, but the t-test is presumably run for benign or malignant — the same wording works for both).
Approach
A null hypothesis has two essential ingredients:
- State that there is no difference between the two groups.
- Identify the two groups being compared (Pap-stained and H&E-stained cells) and the variable being measured (nuclear diameter).
Step-by-Step Reasoning
- The variable being compared is mean nuclear diameter.
- The two groups are Pap-stained and H&E-stained cells.
- A correctly phrased null hypothesis therefore says: there is no (significant) difference in the (mean) nuclear diameter of Pap-stained cells and H&E-stained cells.
- The word 'significant' is optional — both 'no difference' and 'no significant difference' are accepted.
Key Takeaways
- A null hypothesis is a statement that there is no effect or no difference — it is the hypothesis that the statistical test is designed to test against.
- It must mention both the variable being measured and the two groups being compared.
- The wording 'no significant difference' is more precise than 'no difference' but both are accepted in CIE mark schemes.
Common Mistakes
- Writing the alternative hypothesis ('there IS a difference') instead of the null hypothesis.
- Failing to mention which two groups are being compared.
- Adding qualifiers that make the statement untestable (e.g. 'there might be a small difference').
Things to Be Careful About
- The null hypothesis is always about the populations, not the samples — so the wording should be in terms of the underlying populations, although CIE mark schemes usually accept sample-based wording.
The -value the scientists calculated had a probability () value greater than 0.25 ().
State one conclusion that can be made about the effect of using the two stains, Pap and H&E, on the mean nuclear diameter of the cells.
Answer
The null hypothesis is accepted — there is no significant difference in the mean nuclear diameter of Pap-stained cells and H&E-stained cells (the type of stain used does not significantly affect the mean nuclear diameter measured).
There is no significant difference; the null hypothesis is accepted.
Background Concept
A p-value is the probability of obtaining a test statistic at least as extreme as the one observed, assuming the null hypothesis is true. The conventional cut-off in biology is : if we reject the null hypothesis (the difference is statistically significant); if we accept the null hypothesis (no significant difference).
In this question , which is much greater than 0.05. There is therefore a very high probability (>25%) of obtaining a difference at least as large as the one observed by chance, even if the null hypothesis is true. This is strong evidence in favour of the null hypothesis.
Understanding the Question
The candidate must convert the p-value given () into a one-sentence conclusion about the effect of the two stains on mean nuclear diameter.
Approach
- Compare the p-value to the conventional 0.05 cut-off. , so the result is not significant.
- State the conclusion in plain biological language: the type of stain does not significantly affect the mean nuclear diameter measured.
Step-by-Step Reasoning
- means the null hypothesis (no difference between Pap and H&E means) is consistent with the data.
- Therefore the null hypothesis is accepted.
- In biological terms: the choice of stain (Pap or H&E) does not significantly affect the measured mean nuclear diameter. This is useful — it means the data from Pap-stained and H&E-stained cells can be pooled for the comparison of benign and malignant cells.
Key Takeaways
- A large p-value () supports the null hypothesis; a small p-value () supports the alternative.
- The further p is from 0.05, the stronger the support. is very strong evidence for the null.
- Accepting the null does not prove the null is true — only that the data are consistent with it.
Common Mistakes
- Saying 'reject the null hypothesis' because the difference is not exactly zero.
- Saying 'there is no difference' as an absolute statement (the data are consistent with no significant difference, not with absolutely no difference).
- Adding biological meaning that is not supported (e.g. 'the stains are the same' is too strong).
Things to Be Careful About
- The wording should be in terms of accepting the null, not in terms of p-value alone.
State and explain one conclusion that can be made from the data in Table 2.1 when comparing the results for the 5000 benign cells and the 2400 malignant cells.
Answer
State: The mean nuclear diameter of benign cells is smaller than that of malignant cells, so measuring nuclear diameter can be used to distinguish (identify) benign from malignant tumour cells.
Explain: The mean standard errors for benign cells ( to ) and for malignant cells ( to ) do not overlap, indicating a significant difference in the mean nuclear diameters of benign and malignant cells.
Benign cells have a smaller mean nuclear diameter than malignant cells, so the technique can distinguish them; the mean ± 2 SE ranges do not overlap, showing a significant difference.
Background Concept
The standard error (SE) of a mean estimates how much the sample mean would vary if the experiment were repeated. The 95% confidence interval for the true population mean is approximately mean SE. If the 95% confidence intervals of two groups do not overlap, the difference between the means is statistically significant (roughly equivalent to ). If they do overlap, the difference is not significant.
For the total benign cells (): mean = , SE = .
For the total malignant cells (): mean = , SE = .
The 95% CIs are:
- Benign: to .
- Malignant: to .
The gap between and shows that the two intervals are nowhere near each other, so the difference is highly significant.
Understanding the Question
The candidate must state a single conclusion and explain it, comparing the 5000 benign cells with the 2400 malignant cells. The 'state' mark is for the biological conclusion; the 'explain' mark is for the statistical justification.
Approach
- State the conclusion: benign cells have a smaller mean nuclear diameter than malignant cells, so nuclear diameter measurement can be used to identify the tumour type.
- Justify it statistically by applying the SE rule to the two total means and pointing out the non-overlap.
Step-by-Step Reasoning
- The mean for benign cells is ; for malignant cells it is — a difference of .
- Calculate the SE range for each: benign –; malignant –.
- The two intervals are separated by over — they do not overlap at all.
- Non-overlap of mean SE is equivalent to the difference being statistically significant at approximately .
- Therefore, the difference is real, and measuring nuclear diameter CAN be used to distinguish benign from malignant tumours.
Key Takeaways
- The rule of thumb for two independent means: if mean SE do not overlap, the difference is significant.
- The greater the gap between the two ranges, the stronger the evidence of a real difference.
- This kind of analysis is a quick alternative to a formal t-test when the standard errors are reported in a table.
Common Mistakes
- Only stating the conclusion without giving the statistical reason (loses the 'explain' mark).
- Comparing the standard deviations instead of the standard errors — the spread of individual measurements (SD) is not the right measure for comparing means.
- Quoting a p-value or referring to a t-test when none is calculated here — the data are simply two means with their SEs.
Things to Be Careful About
- Use mean SE (or the 95% CI), not mean SD, when comparing means.
- The 'state' and 'explain' are two separate marks, so both must be clearly present.
At the end of the investigation, the scientists evaluated their procedure and results. They identified some disadvantages of using the procedure as a diagnostic test.
Suggest and explain two disadvantages of this procedure as a diagnostic test.
Answer
-
Disadvantage: The procedure is time-consuming and labour-intensive (preparing, counting and measuring 100 nuclei per person).
Impact: This would delay treatment / diagnosis. -
Disadvantage: The procedure is invasive — a sample of tumour cells must be surgically removed from the thyroid gland of each patient.
Impact: This carries a risk of infection, bleeding, pain or tissue damage.
- Time-consuming / labour-intensive → delayed treatment; 2. Invasive procedure → risk of infection, pain or tissue damage.
Background Concept
A 'diagnostic test' is something that can be applied to a patient to identify a disease quickly, safely, cheaply and reliably. A useful diagnostic test should ideally be:
- Fast (so treatment is not delayed)
- Non-invasive (so it does not harm the patient)
- Cheap and easy to perform (so it can be widely applied)
- Accurate
- Widely applicable to different tissues and patient groups.
When evaluating a proposed test, look for ways the procedure falls short of these criteria. A 'disadvantage' must be specific to this procedure; the 'impact' is what the disadvantage would mean for the patient or the health service.
Understanding the Question
The question asks for two disadvantages of the procedure as a diagnostic test, each with an explanation of its impact. The mark scheme gives 1 mark per disadvantage-with-impact, so two clearly paired statements are needed.
Approach
Pick two of the most credible disadvantages from the procedure and pair each with a real consequence for the patient or the diagnostic process:
- Time/labour issue — preparing, counting and measuring 100 nuclei is a lot of work; the consequence is delayed treatment.
- Invasiveness — taking a sample from the thyroid is a surgical procedure; the consequence is risk of infection, pain or tissue damage.
Step-by-Step Reasoning
- For each disadvantage, identify ONE step in the procedure that is the source of the problem and ONE realistic consequence.
- The procedure requires (a) surgically removing a sample, (b) staining it, (c) measuring 100 nuclei per person. Each of these has a drawback.
- A 'disadvantage-with-impact' pair would be: invasive → infection; time-consuming → delayed treatment; one tissue only → may not be true of other tumours.
- A general statement such as 'it is not accurate' is not acceptable without a specific reason.
Key Takeaways
- An effective evaluation identifies a SPECIFIC feature of the procedure that limits its use as a diagnostic test, then explains the practical impact.
- A 'human error' answer must say what causes the error (small / very close values, large numbers counted) — the mark scheme rejects the bare phrase 'human error'.
- An 'only thyroid used' answer must say why this matters (may not be true of other tumour types).
Common Mistakes
- Vague phrases like 'human error' or 'it could be inaccurate' without a specific source.
- Disadvantages that are not really disadvantages (e.g. 'it uses a microscope' — every diagnostic test for cells does).
- Disadvantages that contradict the data (e.g. 'the results overlap too much' — Table 2.1 shows the means differ significantly).
- Listing more than two disadvantages; the question asks for exactly two.
Things to Be Careful About
- Each disadvantage must be paired with its impact — an unsupported disadvantage is only half a mark at most.
- Make the disadvantage procedure-specific: 'time-consuming to measure 100 nuclei per person' is much more credible than just 'time-consuming'.