Biology 9700/51 — May/June 2024
Cambridge A-Level · Planning, Analysis and Evaluation · worked solutions for every part, with the mark scheme
Topics Planning · Analysis, Conclusions and Evaluation
A student investigated the effect of wind speed on the rate of transpiration. The student used the flowering plant Japanese spiraea, Spiraea japonica.
The student used the apparatus shown in Fig. 1.1 to measure the rate of transpiration.
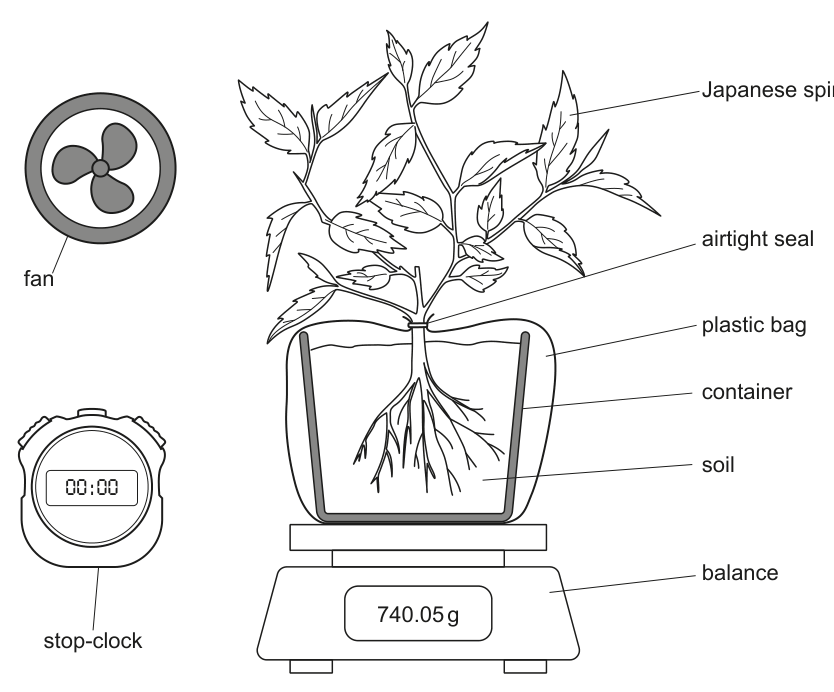
To set up the apparatus the student:
• obtained a Japanese spiraea plant growing in a container of soil
• added of water to the soil
• placed a plastic bag around the container of soil to prevent water loss from the soil
• placed the plant and container on the balance
• switched on the fan to a low setting.
The roots of the Japanese spiraea plant absorbed water from the soil. Water was carried in the xylem and water vapour was lost by transpiration from the leaves of the plant. This caused the reading on the balance to decrease during the investigation.
Answer
Wind speed (produced by the fan).
wind speed
Background Concept
In any experiment three categories of variable must be identified. The independent variable (IV) is the factor the experimenter deliberately changes between trials to test its effect. The dependent variable (DV) is the factor the experimenter measures to see how it responds. The remaining controlled variables are kept constant so any change in the DV can be attributed to the IV.
In this investigation the apparatus is set up with a potted plant on a balance, a fan and a stop-clock. The student will deliberately vary the fan's setting and observe how this affects the rate at which the plant loses mass. The IV must therefore be the quantity that changes with the fan setting — the wind speed the fan produces.
Understanding the Question
The stem describes the apparatus and the procedure already used at a 'low' fan setting. The question is the simplest planning question: 'what is the independent variable?' — i.e. what is the student deliberately changing between trials.
Approach
Re-read the stem and identify the only factor the student varies between repeats. The fan is the only piece of apparatus whose setting is being changed. The faster the fan, the higher the wind speed, so wind speed is the IV.
Step-by-Step Reasoning
- The investigation is described as studying the effect of wind speed on transpiration — the stem itself names the IV.
- The fan is the device used to change the wind speed, confirming the IV.
- The balance and stop-clock are used to measure the DV (mass loss per unit time), so they are not the IV.
- The temperature, light intensity, humidity, plant species and soil water content are all kept the same between trials — these are controlled variables, not the IV.
Key Takeaways
- Always state the IV as a named, measurable quantity, not as the piece of equipment that varies it.
- 'Wind speed' is more precise than 'fan' or 'fan speed'; the mark scheme usually requires the underlying physical variable.
- The IV must be something the experimenter can deliberately set; the DV is what is measured.
Common Mistakes
- Writing 'fan' or 'fan speed' rather than 'wind speed' — the mark scheme wants the variable, not the device.
- Writing 'amount of air movement' or 'air flow' — these are too vague to score.
- Confusing the IV with the DV — the DV here is rate of transpiration (or rate of mass loss), not wind speed.
Things to Be Careful About
- In Paper 5 the mark scheme usually accepts 'wind speed' exactly, with little tolerance for paraphrases.
- The fan is the tool for varying the IV, not the IV itself.
The student carried out the investigation in a laboratory with standard laboratory apparatus.
Describe a method, using the apparatus shown in Fig. 1.1, that the student could use to investigate the effect of wind speed on the rate of transpiration by Japanese spiraea.
Your method should be set out in a logical order and be detailed enough to allow another person to follow it.
Details of how to set up the apparatus shown in Fig. 1.1 should not be included.
Answer
-
Acclimatise the plant. Leave the plant and apparatus in the laboratory for about 10 minutes before starting so the leaves reach a steady rate of transpiration at room temperature and humidity.
-
Vary the wind speed. Use the fan at a minimum of five different speed settings. At each setting, record the actual wind speed using an anemometer held at leaf height.
-
Standardise the fan. Keep the distance and the angle between the fan and the plant constant for every setting.
-
Control other variables. Keep the temperature constant (e.g. in an air-conditioned room, monitored with a thermometer) and keep the light intensity constant (e.g. the same laboratory lamp, the same position of the plant).
-
Measure the dependent variable. At each wind speed, record the initial mass on the balance, start the stop-clock, leave the apparatus for a fixed time (e.g. 5 minutes) and record the final mass. The decrease in mass is the water lost by transpiration in that time.
-
Repeat and average. Repeat the mass-loss measurement at least three times at each wind speed and calculate a mean rate of mass loss (mean decrease in mass per fixed time).
-
Replace water lost. Between trials add water to the soil to replace the water the plant has lost, so that the soil water content is comparable at each wind speed.
Safety
| Hazard | Risk | Precaution |
|---|---|---|
| Japanese spiraea plant | Irritant / allergy | Wear gloves |
| Soil | Biohazard / pathogens | Wear gloves |
| Fan | Hair or loose clothing caught in the blades | Tie back hair; secure loose clothing |
See working
Background Concept
Transpiration is the loss of water vapour from a plant, mainly through the stomata in the leaves. Its rate depends on the water potential gradient between the air inside the leaf and the air outside, and is influenced by:
- Wind speed — moving air removes water vapour from the layer of humid air (the boundary layer) close to each stoma. With a steeper gradient between leaf and air, more water diffuses out, so higher wind speed → higher transpiration (until stomatal aperture or soil water supply becomes limiting).
- Temperature — higher temperature speeds up evaporation and lowers the relative humidity of the surrounding air, so transpiration increases.
- Light intensity — in most species light stimulates stomatal opening, so increasing light increases transpiration.
- Humidity — high humidity reduces the water potential gradient and slows transpiration.
To investigate the effect of wind speed alone, every other factor must be kept the same between trials. Any change in the measured transpiration rate can then be attributed to the change in wind speed. This is the controlled variable principle in experimental design.
A reliable method also:
- uses enough different values of the IV (at least five) to see a trend rather than just two points;
- repeats each value multiple times and averages, to reduce the effect of random error;
- equilibrates the plant to the new conditions before each measurement (acclimatisation), so the rate has stabilised;
- monitors a real, quantitative measure of the IV (e.g. wind speed with an anemometer) — not just 'low' or 'high';
- includes a safety assessment of the equipment and biological materials.
Understanding the Question
The stem tells us the apparatus is already set up (Fig. 1.1) and the question explicitly says not to describe that set-up. We are to write a method that uses the apparatus to investigate the effect of wind speed on the rate of transpiration. The method must be:
- in a logical order so a reader could carry it out;
- detailed enough to be reproducible;
- worth 6 marks, so it must cover at least 6 of the mark scheme's 10 possible points.
The mark scheme offers more points than marks; a strong answer covers as many as possible within the available space.
Approach
Plan a logical sequence that mirrors the way a real experiment would run:
- Equilibrate the plant to the laboratory.
- Decide on the wind speeds to test (at least 5 different fan settings, measured with an anemometer).
- Standardise everything that could affect transpiration except wind speed (fan position, temperature, light intensity, plant, soil moisture).
- At each wind speed: record the initial mass, start the stop-clock, leave for a fixed time, record the final mass. Repeat and average.
- Refill water lost between trials.
- Note any safety precautions.
For each step, write a single sentence that includes the specific detail the mark scheme credits (e.g. 'at least three repeats' rather than 'repeat the test').
Step-by-Step Reasoning
Going through the mark scheme's 10 possible points in the order a method would be written:
-
Acclimatisation — Leave the plant and apparatus in the laboratory for ~10 minutes before starting so the plant is at room temperature and the leaves have reached a steady transpiration rate.
-
Wind speeds — Use the fan at a minimum of five different speed settings (e.g. settings 1–5) to give a range of wind speeds.
-
Measure the wind speeds — Use an anemometer placed where the leaves are to record the actual wind speed at each fan setting.
-
Standardise the fan — Keep the distance between the fan and the plant constant (e.g. 30 cm) and at the same angle, so the only change is the fan speed.
-
Control temperature — Carry out the investigation in a room with air conditioning / closed windows, and monitor with a thermometer to confirm temperature stays the same.
-
Control light intensity — Keep the same laboratory lighting and the plant in the same position relative to the light source for every trial.
-
Measure the DV — At each wind speed, record the initial mass on the balance, start the stop-clock, run for a fixed time (e.g. 5 minutes), then record the final mass. The mass loss in that time is a measure of transpiration rate.
-
Repeats and mean — Repeat the mass-loss measurement at each wind speed at least three times, and calculate a mean rate of mass loss for each speed.
-
Replace water — Between trials, add water to the soil to replace the water lost (so soil water content is the same for each trial).
-
Safety — A specific hazard–risk–precaution triplet is needed:
- Plant: irritant/allergy → wear gloves.
- Soil: biohazard/pathogens → wear gloves.
- Fan: hair/loose clothing can be caught → tie back hair and secure loose clothing.
Key Takeaways
- A planning answer should always include: what to vary (IV with at least 5 values), what to measure (DV with a precise method and units), what to keep constant (the controlled variables), replication (at least 3 repeats and a mean), and safety (a hazard–risk–precaution pair).
- Always include an acclimatisation / equilibration step when the experimenter is changing a physical condition (here, wind speed) that the plant must respond to.
- The mark scheme usually has more points than marks (10 here, 6 marks) — write a method that hits as many as possible within the word limit, but cover the essentials first.
Common Mistakes
- Forgetting to measure the wind speed (just saying 'change the fan setting' without quantifying it).
- Forgetting the acclimatisation step — the plant needs time to respond to a new condition.
- Describing the apparatus set-up, which the question explicitly tells you not to do.
- Vague safety: 'be careful' or 'human error' — the mark scheme wants a specific hazard and a specific precaution.
- Only doing the experiment at two wind speeds — the mark scheme requires at least five.
- Not mentioning that mass loss (or rate of mass loss) is the dependent variable — the student must state what is actually measured.
Things to Be Careful About
- The DV is rate of transpiration (mass per unit time), so the method must include both mass and time, and the time must be fixed across trials.
- The student must replace the water the plant has lost between trials, otherwise the soil water content (and therefore the rate of transpiration) will not be comparable.
- 'Standardise the fan' is best answered as the distance of the fan from the plant; this is the controlled variable that prevents the fan's location adding to the effect.
- 'Safety comment with hazard and precaution' — both parts must be present to score.
Predict the effect of wind speed on the results of the investigation using the method you have given in (a)(ii).
Answer
As wind speed increases, the rate of transpiration (the rate of decrease in mass per fixed time) will increase.
As wind speed increases, the rate of transpiration will increase.
Background Concept
Transpiration rate depends on the water potential gradient between the air inside the leaf and the air outside. When the air around the leaf is still, a layer of humid air (the boundary layer) builds up at each stoma; this reduces the gradient and slows further evaporation. A current of air (wind) sweeps that layer away, so the gradient is maintained and evaporation continues. The faster the wind, the more effectively the humid boundary layer is removed — until other factors (stomatal aperture, soil water supply) become limiting.
Understanding the Question
The question asks us to predict what will happen to the results (the rate of transpiration, measured as rate of mass loss) when the wind speed is increased. The mark scheme accepts the prediction either as a change in the rate of transpiration or as a change in the raw observation (mass loss per fixed time, or time for a fixed mass loss).
Approach
State the relationship between the two variables qualitatively, in the direction the biology suggests. The mark scheme wants a one-sentence prediction that is unambiguous about which way the result moves.
Step-by-Step Reasoning
- As wind speed increases, the boundary layer of humid air at the leaf surface is removed more quickly.
- This maintains a steeper water potential gradient between the air spaces inside the leaf and the outside air.
- More water molecules therefore diffuse out of the stomata per unit time.
- So the rate of transpiration (mass lost from the pot per unit time) increases.
The reverse — that increasing wind speed decreases the rate — would contradict the biology. The mark scheme accepts 'ora' (or reverse argument) for the opposite case, but the correct biology gives the answer above.
Key Takeaways
- A 'predict' question on a planning paper should give the direction of the relationship, not the magnitude, and tie it to the variable the student is changing.
- The mark scheme accepts a prediction phrased in terms of either the calculated rate or the raw measurement (mass change in a fixed time), so you can give whichever feels more natural.
Common Mistakes
- Writing 'transpiration will increase' without saying what the increase is in response to (must link it to 'as wind speed increases').
- Predicting that wind speed has no effect, which is biologically wrong.
- Predicting a decrease (the boundary layer is one of several controls, but the net effect of moving air is to speed up transpiration).
- Giving a numerical prediction (e.g. 'mass loss will increase by 5 g per minute') — the question only asks for the trend.
Things to Be Careful About
- 'ora' on the mark scheme means a candidate can state the opposite trend and still score, but the correct biology here is 'rate increases as wind speed increases'.
- The phrase 'rate of transpiration' is the preferred wording; 'amount of transpiration' is too vague.
The student used a different method to measure the rate of transpiration of Japanese spiraea.
Fig. 1.2 shows the apparatus used. The leaf remained attached to the plant during the investigation.
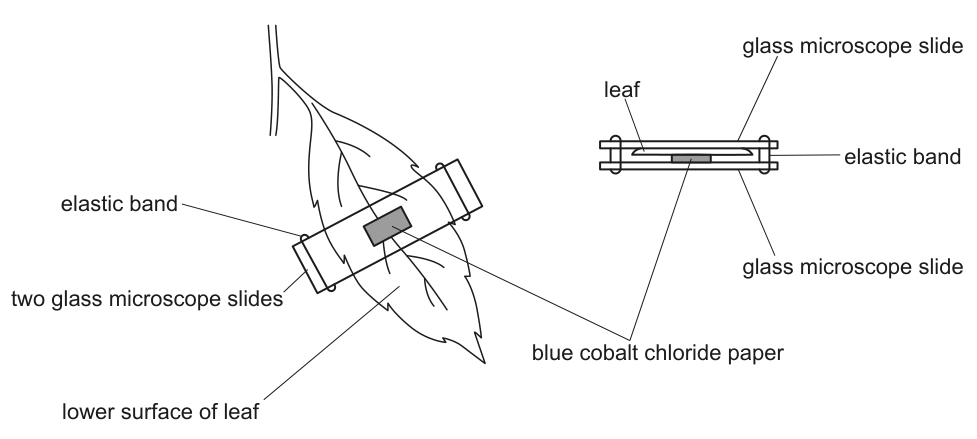
A piece of blue cobalt chloride paper was attached to the lower surface of a leaf, as shown in Fig. 1.2. Blue cobalt chloride paper changes colour to pink if water is added.
The student measured the time taken for the blue cobalt chloride paper to change colour.
This procedure was repeated with two more leaves of the Japanese spiraea plant. The plant was kept in controlled conditions at all times.
Table 1.1 shows the results obtained using blue cobalt chloride paper.
Table 1.1
| leaf tested | time taken for blue cobalt chloride paper to change colour/s |
|---|---|
| 1 | 122 |
| 2 | 137 |
| 3 | 74 |
Fig. 1.3 shows the formula the student used to calculate the rate of transpiration in units of .
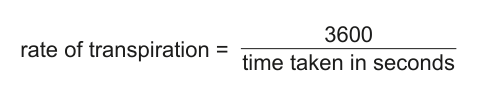
Using the information given in Table 1.1 and Fig. 1.3, calculate the rate of transpiration for leaf 2 of the Japanese spiraea plant.
Give your answer to three significant figures.
rate of transpiration = ______
Working
Answer
rate of transpiration = 26.3
26.3 h⁻¹
Background Concept
The student has used a different method: a piece of blue cobalt chloride paper is pressed against the underside of a leaf. The paper is anhydrous cobalt(II) chloride, which is blue when dry; when it absorbs water it becomes hydrated cobalt(II) chloride, which is pink. The time taken for the colour change is therefore a measure of how quickly the leaf is losing water — i.e. the rate of transpiration. Faster transpiration → less time to change colour.
The formula given (Fig. 1.3) takes the time in seconds and turns it into a 'rate' with units of . This is a relative rate: the number of times per hour the change would occur, not a mass-based rate. The 3600 converts seconds to hours (there are 3600 s in 1 h).
Understanding the Question
We are asked to apply the formula to leaf 2, whose time is (Table 1.1). The answer must be in units of and to three significant figures.
Approach
Substitute 137 s into the formula, evaluate, and round the result to 3 sig figs.
Step-by-Step Reasoning
The formula is:
For leaf 2, time , so:
To three significant figures:
- 26.2 is two sig figs; 26.3 is three sig figs.
- The fourth sig fig is 7, which rounds the third sig fig (2) up to 3.
- So rate .
Key Takeaways
- A 'rate' can be expressed as the reciprocal of time when the underlying quantity is dimensionless or normalised — here the formula gives a value with units .
- Always state the unit on the answer line and quote the result to the number of significant figures the question asks for.
- '3 sig figs' means three digits from the first non-zero digit, so 26.3 (not 26.27).
Common Mistakes
- Writing 26.27 (not rounded to 3 sig figs as requested) or 26.28 (rounded the wrong way).
- Forgetting the unit .
- Dividing the time by 3600 instead of 3600 by the time.
- Using the value from the wrong leaf (leaf 1 = 122, leaf 3 = 74).
Things to Be Careful About
- The formula is dimensionless — it gives a number with units . The higher the number, the faster the transpiration.
- Always check the question: here it asks for the rate for leaf 2, not the mean of the three leaves.
To improve the validity of the results, the student decided to measure the time taken for blue cobalt chloride paper to change colour on a greater number of leaves of the Japanese spiraea plant.
State one other change the student could make to the method to improve the validity of the results.
Answer
Use the same size of (blue) cobalt chloride paper for every leaf tested.
Use the same size of cobalt chloride paper for each leaf.
Background Concept
'Validity' in this context means the experiment actually measures the rate of transpiration of the leaves, and the comparison between leaves is fair. The mark scheme offers four credible changes; any one of them scores. The underlying theme is that the method has sources of variation (different leaf sizes, different positions on the leaf, observer bias in choosing leaves, subjective judgement of the pink end-point) that should be removed or quantified.
Understanding the Question
The student has already decided to increase the sample size. The question now asks for one further change that will improve validity. It is a 1-mark item with four alternative answers, so the student only needs to write one credible change.
Approach
Choose the most obvious or easiest-to-implement change from the list:
- Standardise the size of the cobalt chloride paper (a smaller or larger paper will pick up different total amounts of water and so change the time).
- Use a colour standard to judge the end-point (the same person may see the change at slightly different shades; a reference standard makes the end-point objective).
- Test several positions on the lower surface of the leaf (stomatal density varies across a leaf, so different positions may give different rates).
- Pick the leaves in an unbiased way (e.g. randomly, or the same position on the plant, rather than only the biggest leaves).
Step-by-Step Reasoning
Any one of the four answers is sufficient. They all improve validity by removing a source of variation in either the leaf being tested or in the judgement of the end-point.
Key Takeaways
- Validity ≠ reliability. Validity is about whether the experiment actually tests what it claims to test; reliability is about whether the same result is obtained on repetition. The two often need different improvements.
- 'Use a colour standard' is a classic improvement for any indicator-based end-point (cobalt chloride, Universal Indicator, iodine, etc.) — it removes subjective judgement.
Common Mistakes
- Writing a change that only improves reliability (e.g. 'repeat three times') — the question has already said the sample size is being increased, and the point is to go beyond that.
- Vague answers such as 'be more careful' or 'use better equipment' — the mark scheme wants a specific, identifiable change.
- Suggesting changes that would alter what the experiment measures (e.g. 'use a different species' — this changes the biology being tested, not the validity).
Things to Be Careful About
- 'Same size of cobalt chloride paper' is usually the simplest answer; specifying a size (e.g. 1 cm × 1 cm) makes the answer more concrete.
- 'Colour standard' does not have to mean a colorimeter — a pre-made pink reference paper is sufficient.
The responses of plant species to water stress can be classified as either isohydric or anisohydric.
• Isohydric plant species close stomata during times of water stress. This behaviour minimises water loss by transpiration but also reduces carbon dioxide uptake for photosynthesis.
• Anisohydric plant species do not close stomata during times of water stress. This behaviour maximises carbon dioxide uptake for photosynthesis but also increases water loss by transpiration.
A biologist studied 10 tree species from Australia. The biologist studied the effect of water stress and high environmental temperatures on five isohydric tree species and five anisohydric tree species.
For each tree species studied:
• The biologist obtained 20 young trees.
• The young trees were grown in containers of soil in controlled conditions in a glasshouse.
• The environmental conditions in the glasshouse were chosen to represent summer conditions in Australia. The mean glasshouse temperature was .
• All the young trees were given a good supply of water for 10 weeks, so that the young trees acclimatised to the environmental conditions in the glasshouse.
State three environmental conditions in the glasshouse that should be standardised in the 10-week period of acclimatisation, other than the temperature of the glasshouse.
Answer
Any three from:
- light intensity;
- duration / hours of light;
- volume of water (added to soil);
- type / pH of soil;
- mineral (ion) concentration (in soil);
- humidity;
- carbon dioxide concentration.
light intensity; duration/hours of light; volume of water added to soil
Background Concept
A controlled experiment relies on changing only one variable at a time (the independent variable) while keeping every other relevant factor the same across all groups. If a second factor varies, the investigator can no longer be sure that the observed difference in the dependent variable is caused by the treatment — it might be caused by the unwanted variable. Such factors are called standardised (or controlled) variables, and the mark scheme here is asking for the abiotic, environmental conditions that must be held constant in the glasshouse.
The dependent variable in this experiment is stomatal conductance, which is influenced by many abiotic factors: light intensity and photoperiod affect photosynthesis and the light-dependent opening of stomata; humidity and air movement affect the diffusion gradient for water vapour; atmospheric concentration affects the demand for stomatal opening; soil water potential, soil type/pH and mineral availability affect the plant's water status and physiology. Any of these, if allowed to vary, could mask the effect of the planned water-stress and high-temperature treatments.
Understanding the Question
The question is restricted to the 10-week acclimatisation period (before the experimental treatments of water supply and temperature begin). The biologist wants every young tree to experience the same set of growing conditions during this period so that any later differences are attributable to the experimental treatments and not to the acclimatisation environment. The temperature is excluded from the answer because it is given in the stem.
Approach
List the abiotic factors that affect stomatal conductance and plant growth, then pick the three that are most relevant to a glasshouse experiment and most commonly credited by the mark scheme. The list should focus on things that the biologist can in practice set and maintain.
Step-by-Step Reasoning
Each of the seven items accepted by the mark scheme is a sensible, controllable, abiotic glasshouse factor:
- Light intensity — the amount of photosynthetically active radiation reaching the leaves. A difference here would change photosynthesis rate and stomatal opening.
- Duration / hours of light (photoperiod) — the length of the day. Longer days give more time for photosynthesis and stomatal opening.
- Volume of water added to the soil — controls soil water potential. This will later become an independent variable, but during acclimatisation it must be the same for all trees.
- Type / pH of soil — different soils hold different amounts of water and have different nutrient availabilities.
- Mineral (ion) concentration in soil — affects general plant health and the ion concentrations in the xylem sap that drive stomatal guard-cell movement.
- Humidity — affects the water potential gradient between the leaf air spaces and the atmosphere, and therefore the rate of transpiration and the plant's water status.
- Carbon dioxide concentration — affects photosynthesis and indirectly stomatal aperture.
A high-scoring answer gives any three, with the correct biological term and the unit where relevant (e.g. "light intensity", not just "light").
Key Takeaways
- Standardising variables means making them identical across all experimental groups.
- Standardisation applies to all abiotic factors that could influence the dependent variable, in this case stomatal conductance.
- A good answer lists factors that are biologically relevant AND practically controllable in a glasshouse.
Common Mistakes
- Naming water supply as something to be standardised during the experimental period (after acclimatisation): the experiment deliberately varies water supply in groups 3 and 4.
- Listing biotic factors (e.g. pests, competition): these are valid concerns but the mark scheme rewards abiotic ones.
- Vague answers such as "the soil" or "the environment" — these are not creditworthy because they are too imprecise.
Things to Be Careful About
- Read the wording carefully: the question asks for conditions in the glasshouse, so factors that can be set in a glasshouse (light, humidity, , soil type) are appropriate; things that cannot be easily set (e.g. wind speed) are not the expected answers.
- "Light" alone is too vague — "light intensity" or "duration of light" is required.
After the 10-week period of acclimatisation, the biologist divided the young trees from each species into four groups of five trees.
Table 2.1 shows the experimental conditions used by the biologist for the next five weeks.
Table 2.1
| group | experimental conditions |
|---|---|
| 1 | The young trees were given a good supply of water for five weeks. The mean glasshouse temperature during weeks 1 to 5 was . |
| 2 | The young trees were given a good supply of water for five weeks. The mean glasshouse temperature during weeks 1 to 4 was . During week 5, the mean glasshouse temperature was increased to . |
| 3 | The young trees were given a reduced supply of water for five weeks (water stress). The mean glasshouse temperature during weeks 1 to 5 was . |
| 4 | The young trees were given a reduced supply of water for five weeks (water stress). The mean glasshouse temperature during weeks 1 to 4 was . During week 5, the mean glasshouse temperature was increased to . |
At the end of week 5, the biologist measured the stomatal conductance of three leaves from each young tree at 12:00 (midday).
Stomatal conductance is a measure of water vapour loss from the intercellular air spaces of leaves to the atmosphere through the stomata.
The biologist processed the data to compare the results from the isohydric and anisohydric tree species in the four experimental conditions, as shown in Table 2.1.
The results are shown in Fig. 2.1.
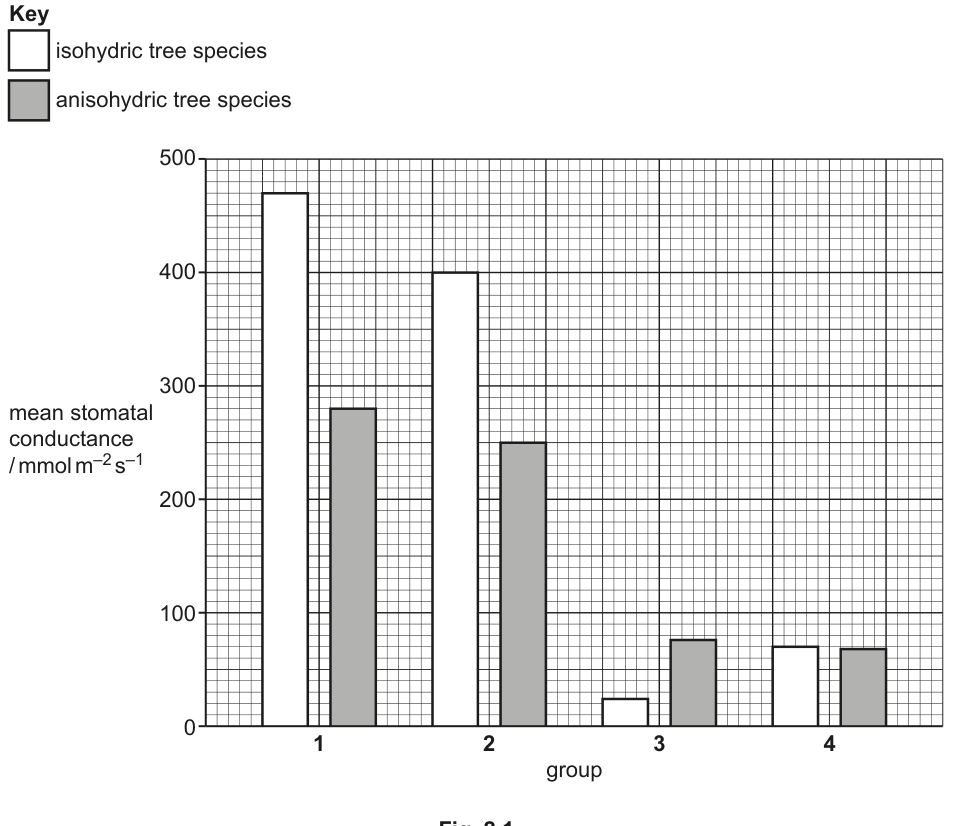
Using Fig. 2.1, state the effect of a high mean temperature on the mean stomatal conductance of young trees that were given a good supply of water.
Answer
A high mean temperature leads to a lower mean stomatal conductance in both isohydric and anisohydric tree species given a good supply of water.
High mean temperature decreases mean stomatal conductance in both isohydric and anisohydric species (with a good water supply).
Background Concept
Stomatal conductance is a measure of the rate at which water vapour passes from the wet cell walls inside a leaf, through the stomatal pores, to the atmosphere outside. It depends on (i) the number of open stomata, (ii) the average size of their pores and (iii) the water-vapour concentration gradient between the leaf interior and the air. The first two of these are under plant control, while the third is largely set by atmospheric humidity and temperature.
In well-watered plants, the dominant short-term control on stomatal opening is light (via photosynthesis in guard cells) and intercellular concentration. As the leaf temperature rises, the saturation water-vapour pressure of the air inside the leaf rises faster than that of the air outside, steepening the diffusion gradient and so increasing evaporative demand. Many species respond to this by partially closing their stomata to limit transpiration (and so limit the risk of xylem cavitation), even when soil water is plentiful. This is the response we see in the data.
Understanding the Question
Fig. 2.1 shows mean stomatal conductance in for two species (isohydric, white; anisohydric, grey) under four experimental conditions. The question asks specifically about the effect of high mean temperature (group 2 vs group 1) with a good supply of water (groups 1 and 2 are both well-watered). This is the only valid comparison; we must not mix in the water-stressed groups (3 and 4), because the question is about temperature, not water stress.
Approach
Read the height of the white bar in group 1 and group 2, then the grey bar in group 1 and group 2, and describe what happens to both species.
Step-by-Step Reasoning
From Fig. 2.1:
- Isohydric species: group 1 ≈ ; group 2 ≈ . Conductance falls.
- Anisohydric species: group 1 ≈ ; group 2 ≈ . Conductance falls.
Both bars are lower in group 2 than in group 1, so the conclusion is that high mean temperature decreases mean stomatal conductance in both species when water is not limiting. The mark scheme explicitly requires the word "both" (or the equivalent "isohydric and anisohydric") to award the mark, because the candidate must recognise that the same effect is seen in each species.
Key Takeaways
- Reading a bar chart is a basic data-handling skill; the candidate must specify the comparison being made.
- A "state the effect" question expects a short, descriptive statement, not an explanation.
- The answer must be drawn from the correct pair of groups — here, groups 1 and 2 only.
Common Mistakes
- Comparing groups 1 and 4 (which confounds temperature AND water supply).
- Saying that "conductance increases" or that "only the isohydric species show a change" — both are wrong, as Fig. 2.1 shows a decrease in both.
- Adding an explanation (about evaporation or guard cells) — the question is "state", not "explain", and explanations do not earn the mark.
Things to Be Careful About
- The question deliberately isolates one variable at a time. Group 1 vs group 2 = effect of temperature; group 1 vs group 3 = effect of water stress; group 3 vs group 4 = effect of temperature on water-stressed trees. Pick the right pair.
The biologist then compared the young trees from group 3 and group 4 that were exposed to water stress.
The biologist carried out statistical tests on the data to see if the difference between the mean stomatal conductance of young trees in group 3 and the mean stomatal conductance of young trees in group 4 was significant.
Table 2.2 shows the probability values () from the results of the statistical tests.
Table 2.2
| tree species | value of | significance |
|---|---|---|
| isohydric tree species | 0.046 | significant |
| anisohydric tree species | 0.788 | not significant |
With reference to Fig. 2.1 and Table 2.2, suggest and explain the conclusions that can be made about the effect of water stress and a high environmental temperature on isohydric and anisohydric tree species.
Answer
- Water stress (group 3 vs group 1) reduces mean stomatal conductance in both isohydric and anisohydric species, which reduces water loss by transpiration.
- In isohydric species under water stress, a high mean temperature (group 4 vs group 3) causes a statistically significant increase in mean stomatal conductance; the increased conductance has a cooling effect (transpirational cooling) on the leaves.
- In anisohydric species under water stress, a high mean temperature (group 4 vs group 3) does not cause a significant change in mean stomatal conductance; the unchanged conductance allows continued uptake for photosynthesis.
- Paired data quotes to support the conclusions, e.g. isohydric: ~ (p = 0.046, significant); anisohydric: ~ (p = 0.788, not significant).
Water stress reduces stomatal conductance (and water loss) in both species; high temperature then significantly raises conductance only in isohydric species (cooling effect) while anisohydric species show no significant change (preserving CO2 uptake).
Background Concept
Stomatal conductance is the rate at which water vapour escapes through the stomata. It is also a useful proxy for the rate at which enters the leaf, because the same open pores admit both gases. The opening of stomata therefore creates a trade-off: more open stomata → more for photosynthesis, but also more water loss.
Isohydric species are "water-status regulators": they close their stomata as the soil dries, so their leaf water potential stays roughly constant. This is safe for the xylem (low risk of cavitation) but costs carbon because photosynthesis drops. Anisohydric species are "carbon maximisers": they keep their stomata open to keep photosynthesising, allowing leaf water potential to fall as the soil dries. This maximises growth when water is plentiful but risks hydraulic failure if the drought is severe.
The p-value is the probability of obtaining the observed difference (or a more extreme one) if the null hypothesis of no real difference is true. Conventionally, is taken as evidence that the difference is unlikely to be due to chance and is "statistically significant".
Understanding the Question
The biologist is comparing group 3 (water stress, 28 °C throughout) with group 4 (water stress, 35 °C in week 5). The p-values in Table 2.2 tell us whether the difference between group 3 and group 4 is significant for each species:
- Isohydric: → significant.
- Anisohydric: → not significant.
The candidate is asked to suggest and explain conclusions from these data, drawing also on Fig. 2.1 for the actual values.
Approach
Build four linked points: two about the effect of water stress (group 3 vs 1) and two about the effect of adding a high temperature on top of water stress (group 4 vs 3). For each, give a conclusion and a brief biological explanation, and back the conclusions with the p-values and at least one pair of numbers from Fig. 2.1.
Step-by-Step Reasoning
Point 1 (effect of water stress, both species):
From Fig. 2.1, group 1 (no water stress) has much higher conductance than group 3 (water stress) for both species:
- Isohydric: ~.
- Anisohydric: ~.
So water stress reduces stomatal conductance in both. The biological reason is that closing stomata reduces water loss by transpiration, helping the plant to conserve water.
Point 2 (effect of high temperature on isohydric species under water stress):
- Isohydric: group 3 ≈ ; group 4 ≈ . Conductance increases.
- , so the increase is statistically significant.
Why would an isohydric species open its stomata when water-stressed? Because the heat load at 35 °C threatens the leaf with overheating. The plant sacrifices some water in order to lose heat by evaporative (transpirational) cooling. The "isohydric" strategy gives way to a thermal-damage-avoidance strategy when temperature becomes the greater threat.
Point 3 (effect of high temperature on anisohydric species under water stress):
- Anisohydric: group 3 ≈ ; group 4 ≈ . Conductance is essentially unchanged.
- , so any apparent difference is not significant.
Anisohydric species already keep their stomata open during water stress to maintain uptake for photosynthesis, so adding heat stress does not produce a further meaningful change. This makes biological sense: an anisohydric species is a "carbon maximiser" — its strategy is to keep photosynthesising even when the soil is dry.
Point 4 (paired data quote):
The mark scheme requires a paired numerical quote from Fig. 2.1 to support the conclusion. For example, for the isohydric comparison: "mean stomatal conductance increases from ~ to ~ (, significant)"; for the anisohydric comparison: "mean stomatal conductance changes from ~ to ~ (, not significant)".
Key Takeaways
- Always state the direction of the effect (increase / decrease / no change) and whether it is statistically significant.
- The biological explanation should connect the data to the plant's overall strategy (water conservation vs photosynthesis vs cooling).
- Isohydric and anisohydric species can give opposite responses to a combined stress — don't be tempted to give a single unified conclusion.
- A p-value alone does not explain biology; pair it with the direction and magnitude of the change.
Common Mistakes
- Stating only the direction of the change without the biological reason (the mark scheme explicitly requires both).
- Confusing isohydric and anisohydric — the increase on adding heat is in the isohydric species, not the anisohydric.
- Saying the result is "significant" or "not significant" without quoting the p-value or comparing it to .
- Forgetting to make the comparison within the water-stressed groups (group 3 vs group 4), and instead comparing group 1 to group 4 (which mixes two variables).
- Leaving the answer generic ("it shows a difference") rather than specific to the species.
Things to Be Careful About
- "Suggest" allows biological reasoning; it is not restricted to what the data literally show.
- The mark scheme credits conclusions and explanations — both halves must be present for the full mark.
- Use the exact term "mean stomatal conductance" (not just "stomatal conductance") in the conclusion.
The biologist noticed that the young trees in group 4 had some dead leaves at the end of week 5.
The biologist determined the percentage of leaves on the young trees that were dead at the end of week 5.
The results from the isohydric tree species and the anisohydric tree species are shown in Table 2.3.
Table 2.3
| type of tree species | group 4: water stress + high mean temperature | |
|---|---|---|
| mean percentage of leaves that were dead | standard error (SE) | |
| isohydric | 19.0 | 8.3 |
| anisohydric | 3.5 | 1.3 |
The biologist then analysed these data using a -test to compare the mean percentage of leaves that were dead on the young trees of the isohydric and anisohydric species.
State a null hypothesis for the -test.
Answer
There is no (significant) difference between the mean percentage of leaves that were dead on the young trees of the isohydric species and the mean percentage of leaves that were dead on the young trees of the anisohydric species.
There is no (significant) difference between the mean percentage of dead leaves on the isohydric trees and on the anisohydric trees.
Background Concept
A null hypothesis () is the statistical assumption that there is no real difference between the populations being compared. The whole purpose of a significance test is to calculate the probability of obtaining the observed data if is true. If that probability (the p-value) is small, we reject and conclude that a real difference is likely to exist; if it is large, we accept and conclude that the data do not provide evidence of a difference.
The null hypothesis is always a statement of equality / no difference / no effect. The "alternative hypothesis" () is the one we are actually trying to find evidence for — in a two-tailed test, it says there is a difference, without specifying the direction.
Understanding the Question
The biologist is comparing two means from Table 2.3: the mean percentage of dead leaves on isohydric trees () and on anisohydric trees () in group 4. The two populations are: isohydric trees of this species group, and anisohydric trees of this species group. The variable being compared is "mean percentage of dead leaves".
Approach
Construct a single sentence of the form: "There is no significant difference between [mean of population 1] and [mean of population 2]." Use the correct biological name of each population (isohydric and anisohydric species) and the correct variable (percentage of leaves that were dead).
Step-by-Step Reasoning
- Identify the two groups being compared: young trees of isohydric species vs young trees of anisohydric species.
- Identify the variable: percentage of leaves that were dead (or "mean percentage of leaves that were dead").
- State that the null hypothesis assumes no difference between the two means.
- Add "(significant)" to make it explicit that the test is for a significant difference, which is the convention in CIE mark schemes.
Key Takeaways
- A null hypothesis is always a statement of "no difference" / "no effect" / "no association".
- It must reference both populations in the comparison and the same variable for each.
- The wording "(significant)" is preferred by the mark scheme to make the statistical framing explicit, but "(real)" is also accepted in many CIE schemes.
Common Mistakes
- Stating the alternative hypothesis instead ("there IS a difference") — this is the hypothesis we test against, not the null.
- Forgetting to name the two populations clearly.
- Naming the wrong variable (e.g. "stomatal conductance" instead of "percentage of dead leaves").
- Using vague language such as "the means are similar" — the null hypothesis is a definite statement of equality.
Things to Be Careful About
- The null hypothesis refers to the populations from which the samples were drawn, not the specific samples used in the experiment. However, the CIE mark scheme wording in this style of question normally refers to the samples, and both phrasings are accepted.
The formula for the -test is:
key to symbols:
= mean
= sample standard deviation
= sample size (number of observations)
The biologist calculated
Use this value and Table 2.3 to calculate the value of for these data.
Show your working.
= ______
Working
With , and :
Answer
(to 3 s.f.)
t = 1.883
Background Concept
The t-test compares two means and asks whether the difference between them is large enough, relative to the spread of the data, to be unlikely to have arisen by chance. The test statistic
is the difference between the two means divided by the standard error of the difference between the means. The denominator is the pooled uncertainty in the two means, calculated by combining each sample's variance and sample size. The absolute value is used because the t-test is conventionally two-tailed: it only asks whether the means differ, not which is bigger.
A large |t| means the two means are far apart relative to the noise in the data, so the difference is unlikely to be due to chance. A small |t| means the two means are close together compared with the spread, so a difference of this size is very plausible under the null hypothesis.
Understanding the Question
The candidate is given Table 2.3 with two means ( and ) and told that the denominator has already been calculated. The candidate just has to plug the two means and the denominator into the t-test formula.
Approach
Substitute the two means into the numerator, then divide by the given denominator. The vertical bars | … | mean "take the absolute value", so always subtract the smaller from the larger (or take the magnitude of the result).
Step-by-Step Reasoning
- Numerator: .
- Denominator: already given as .
- Round to 3 significant figures: .
The mark scheme shows the working as "" — the same calculation, just written using the percentage values as whole numbers. The final answer is .
Key Takeaways
- The t-test is a calculation, not a description — write the formula, substitute, and evaluate.
- The denominator is a measure of the combined uncertainty in the two means.
- Always use the absolute difference in the numerator so that the sign of the t-statistic does not depend on the order of the two means.
- Quote the answer to the same number of significant figures as the data (3 s.f. here).
Common Mistakes
- Forgetting the absolute-value signs, giving a negative t (a t-statistic is always non-negative in this form).
- Rounding too early (e.g. rounding to loses the required precision).
- Mixing up the means (subtracting in the wrong order is fine here because of the absolute value, but writing the wrong values would lose the mark).
- Failing to show the working — the mark scheme requires both the calculation and the final value.
Things to Be Careful About
- The denominator is given in the question; the candidate must not try to recompute it from (which are not all provided in the table).
- The "1883" written in the published mark scheme corresponds to 1.883 — the decimal point is implicit.
The degrees of freedom for this -test are 48. Table 2.4 shows the probability table for the -test.
Table 2.4
| degrees of freedom | critical values | ||
|---|---|---|---|
| (10%) | (5%) | (1%) | |
| 48 | 1.677 | 2.011 | 2.682 |
Using Table 2.4 and the calculated value of from (d)(ii), describe what the biologist can conclude from the results shown in Table 2.3.
Answer
- The calculated value of (1.883) is less than the critical value of at (and also less than at ).
- The null hypothesis is accepted at both and .
- There is no significant difference between the mean percentage of leaves that were dead on young trees of the isohydric species and the mean percentage of leaves that were dead on young trees of the anisohydric species at (and at ).
t (1.883) is less than the critical value at p = 0.05 (2.011), so the null hypothesis is accepted and there is no significant difference between the mean percentages of dead leaves on the two species.
Background Concept
Once a t-statistic has been calculated, it is compared with critical values from a table that depend on the degrees of freedom and the chosen significance level (p-value). The critical value is the minimum |t| required to reject the null hypothesis at that significance level. If critical value, the result is significant at that level and is rejected. If critical value, the result is not significant at that level and is accepted (or, more cautiously, "not rejected").
The degrees of freedom for a two-sample t-test is approximately (one df is lost for each sample mean used). The question states degrees of freedom = 48, so the two samples together contain observations. At df, the critical values are (), () and ().
Understanding the Question
The candidate has calculated in part (d)(ii) and now has to interpret it using Table 2.4. The question asks what the biologist can conclude from the data in Table 2.3 (the percentages of dead leaves on isohydric and anisohydric trees in group 4). The conclusion is in three parts: (1) compare the t-statistic with the critical values, (2) state what is done to the null hypothesis, and (3) state the conclusion in plain biological language.
Approach
Compare with each of the three critical values in turn:
- ? No.
- ? Yes.
- ? Yes.
So the calculated t is too small to reach significance at or , but it is large enough to reach significance at . In conventional CIE biology, the standard cut-off is , so we accept and conclude that there is no significant difference.
Step-by-Step Reasoning
- Comparison: (critical value at ). Therefore the result is not significant at the 5% level. By the same token , so it is also not significant at the 1% level.
- Decision on : Because the result is not significant at , the null hypothesis is accepted. (Note: "accept" here is the CIE convention; many textbooks prefer "fail to reject", which is logically equivalent.)
- Conclusion in words: There is no significant difference between the mean percentage of dead leaves on the isohydric trees and on the anisohydric trees, at the level.
The candidate should also note that although the means look very different ( vs ) and the SE bars are wide (especially for isohydric, where ), the spread within each sample is too large for us to be confident that the populations are really different.
Key Takeaways
- Always compare the calculated t-statistic to the critical value at the chosen significance level before drawing a conclusion.
- A p-value smaller than the chosen → reject ; a p-value larger than → accept .
- A large difference between two sample means is not enough to claim a significant difference; the spread of the data also matters.
- The conclusion must be stated in plain language at the end — it is not enough to leave the answer as a numerical comparison.
Common Mistakes
- Saying "the null hypothesis is rejected" because the two means are very different ( vs ) — this ignores the spread, which is what the t-test takes into account.
- Comparing t with the wrong critical value (e.g. at instead of at ).
- Omitting the final plain-language conclusion — the mark scheme requires it as a separate point.
- Saying the result is "significant at the level" because is a familiar number; this is the wrong direction — we need to claim significance at the level.
Things to Be Careful About
- The conclusion is about the populations of isohydric and anisohydric trees, not the specific samples used.
- "No significant difference" is not the same as "the means are equal" — we have only failed to demonstrate that they differ.
- The candidate can also note that although the means differ, the result is not statistically significant because the standard errors are large.
Female mosquitoes feed on human blood. Some species of mosquitoes are vectors of human pathogens. For example, female mosquitoes of the species Aedes aegypti transmit the pathogen that causes the disease yellow fever.
Mosquitoes have sensory receptors that can detect chemicals in the air. Mosquito repellents contain chemicals that are sprayed onto the skin of humans to prevent mosquitoes taking blood meals.
Some scientists investigated the effectiveness of different mosquito repellents using a human volunteer. The scientists carried out the investigation on this person in a laboratory.
Fig. 3.1 is a diagram of the experiment before the start of the investigation.
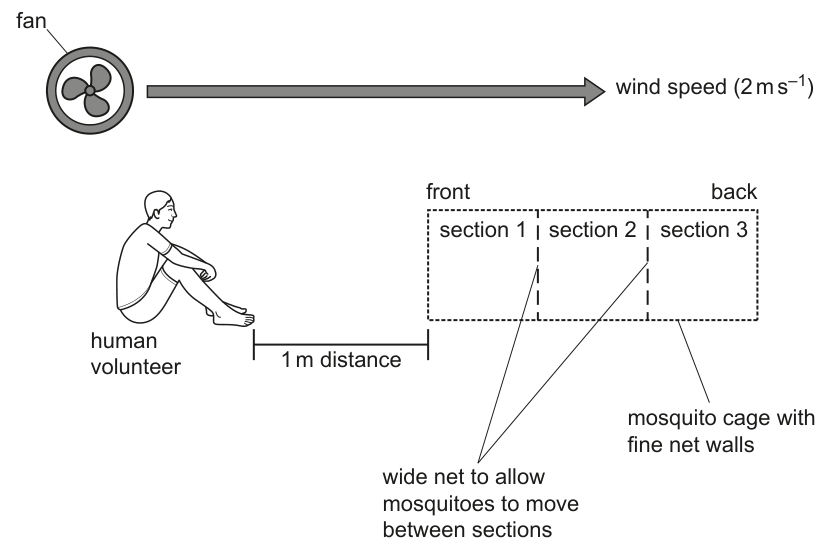
The same procedure was used for each mosquito repellent studied.
• A human volunteer sat from a mosquito cage, as shown in Fig. 3.1.
• The person sprayed some mosquito repellent onto the skin of both arms.
• A fan was turned on so that air moved from the person towards the mosquito cage. The moving air carried chemicals, including the mosquito repellent, from the person into the mosquito cage.
• The scientists added 100 female mosquitoes of A. aegypti to section 2 of the mosquito cage.
• The mosquitoes were left in the mosquito cage for 15 minutes. The walls of the mosquito cage were made of fine net to prevent mosquitoes leaving the cage. The mosquitoes moved freely between sections 1, 2 and 3.
• After 15 minutes, the scientists counted the number of mosquitoes in each section of the mosquito cage. The percentage of mosquitoes in section 1 of the mosquito cage was calculated.
• This procedure was then repeated three times on different days, using the same person.
Answer
Repeat the procedure with the human volunteer but do not spray any repellent (or spray only water, or spray only the solvent) onto the arms. This gives a baseline percentage of mosquitoes in section 1 against which each repellent can be compared.
Repeat with the volunteer not spraying any repellent (or spraying only water / only solvent) on the arms.
Background Concept
A control is a treatment in an experiment that is identical to the experimental treatment in every way EXCEPT the variable being tested. It provides a baseline against which the experimental treatment can be compared, so that any difference in the outcome can be attributed specifically to the variable being investigated. Without a control it is impossible to tell whether the result is an effect of the treatment or whether the same result would have occurred anyway.
The two main types of control are:
- Negative control: the variable is absent (e.g. no drug, no repellent). This is the typical control for a repellent test.
- Positive control: the variable is present and known to have an effect (e.g. a proven repellent). This validates that the assay can detect an effect.
In this experiment the variable being tested is the presence (and identity) of a mosquito-repellent chemical. The control must therefore remove the repellent but keep everything else identical.
Understanding the Question
The procedure has one human volunteer sitting 1 m from a cage, with air blown from the volunteer toward the cage. The percentage of mosquitoes found in section 1 (closest to the volunteer) is the measure of attraction: a lower percentage in section 1 means the mosquitoes are being repelled. Without a control, you cannot tell whether a low percentage in section 1 is genuinely due to the repellent or whether mosquitoes would not have approached the volunteer anyway.
The command word is state, so the answer simply needs to identify the control treatment that is run for comparison.
Approach
Identify what the experimental treatment involves (volunteer + repellent) and then strip out the variable being tested (the repellent) while keeping everything else identical. A water-only or no-repellent spray is a valid control because it is identical to the test in every respect except the active chemical.
Step-by-Step Reasoning
- The variable being investigated is the presence (and identity) of a mosquito-repellent chemical.
- The control must remove the repellent but keep the rest of the procedure identical.
- The mark scheme accepts: no repellent, water (spray) only, or solvent (the carrier liquid of the spray) only.
- All three are valid because each keeps the volunteer's skin sprayed, ensuring the only difference from the experimental treatment is the absence of the active repellent ingredient.
Key Takeaways
- A control tests the experiment without the variable of interest.
- For a repellent bioassay, the control is a spray with no active ingredient (water, solvent, or nothing at all).
- Without the control you cannot tell whether the percentage of mosquitoes in section 1 would have been different anyway.
Common Mistakes
- Confusing the control with a repeat: a repeat is a second run of the same treatment; a control is a different treatment that lacks the variable.
- Stating only "no repellent" without specifying that the person is still there and the rest of the procedure is unchanged — examiners usually still credit this, but the more complete answer is better.
- Adding an extra variable to the control (e.g. changing the distance, the fan, or the mosquito species) — this no longer isolates the effect of the repellent.
Things to Be Careful About
The mark scheme accepts several alternatives: no repellent, water spray, or solvent spray. Pick whichever fits the experimental design; all are worth the single mark.
Suggest one risk to the scientists when carrying out this investigation and state a suitable precaution they should take.
Answer
Risk: the mosquitoes could bite the scientists (or transmit a disease such as yellow fever).
Precaution: the scientists should wear protective clothing / gloves / masks / PPE (or use disease-free mosquitoes, or be vaccinated against yellow fever).
Risk: mosquito bite or disease transmission. Precaution: wear protective clothing/PPE (or use disease-free mosquitoes, or vaccination).
Background Concept
A risk assessment identifies hazards in a procedure and matches each hazard to a sensible precaution that reduces the likelihood or impact of harm. In a Cambridge paper the risk and the precaution must be linked — a generic risk with an unrelated precaution will not score, and a precaution with no risk will not score.
The experiment involves live Aedes aegypti mosquitoes, which are blood-feeding insects and vectors of the yellow fever virus. Anything that bites through skin or transmits a pathogen is a hazard. The repellent chemicals themselves can also be irritants or allergens, and the solvent in a spray is flammable and can be irritant on contact or inhalation.
Understanding the Question
The experiment places 100 live female mosquitoes in a cage close to a person. The mosquitoes are contained by a fine net but a scientist is in the same room for 15 minutes at a time and handles the cage. The command word suggest means an appropriate, context-specific risk is needed along with a precaution that would sensibly address it. One mark is awarded for a risk AND its matching precaution.
Approach
Look at each element of the experiment in turn and ask: what could go wrong? Then ask: what would minimise that specific risk?
- Mosquitoes → bites, blood-feeding, disease transmission.
- Repellent chemicals → irritation, allergy, toxicity on skin or by inhalation.
- Working in a closed lab with chemicals → inhalation of solvent.
For each, name the specific hazard and pair it with a specific control measure.
Step-by-Step Reasoning
- Bites: female mosquitoes probe skin to find blood. The scientist's bare arms or hands could be bitten. Precaution: wear long sleeves / gloves / other PPE; keep the cage's fine net intact; never put hands inside the cage.
- Disease transmission: Aedes aegypti transmits yellow fever virus. If a mosquito is infected, a bite could infect the scientist. Precaution: use disease-free (pathogen-free) laboratory mosquitoes; or the scientist should be vaccinated against yellow fever before the experiment; or wear PPE so the mosquito cannot reach the skin.
- Chemicals: many repellent sprays contain solvents (alcohol, oils) that are irritant or toxic. Precaution: wear gloves; avoid inhalation; work in a well-ventilated area.
Key Takeaways
- Always link the risk to the precaution — the precaution must reduce the named risk specifically.
- The risks here are biological (mosquitoes) and chemical (repellent / solvent).
- The most efficient answer picks one strong, fully linked risk–precaution pair.
Common Mistakes
- Listing a risk without a precaution, or a precaution without a risk — each alone scores zero.
- Stating "be careful" or "human error" as a risk — these are not biological/chemical hazards.
- Giving a precaution that does not match the risk (e.g. vaccination in response to a mosquito bite rather than to disease transmission).
- Forgetting that mosquitoes and repellent chemicals are TWO separate categories of hazard.
Things to Be Careful About
- The mark scheme credits one mark for risk + matching precaution, so a single complete pair is enough.
- "PPE" alone is acceptable, but the specific item (gloves, mask, long sleeves) is more precise and shows understanding.
Table 3.1 shows the results of the investigation.
Table 3.1
| chemical in mosquito repellent | percentage concentration of chemical in mosquito repellent | percentage of mosquitoes in section 1 of the mosquito cage mean ± standard error (SE) |
|---|---|---|
| DEET | 40 | |
| DEET | 98 | |
| lemon eucalyptus oil | 30 | |
| picaridin | 10 |
The results of this investigation were published in a scientific paper.
A student who read this paper concluded that the most effective mosquito repellents contained DEET or lemon eucalyptus oil.
The student was planning to travel to a country where malaria is present. The student decided to use a mosquito repellent that contained DEET to prevent malaria infection.
Explain whether the procedure and the data in Table 3.1 support or do not support this decision to use a mosquito repellent that contained DEET.
Answer
The data and procedure only partially support the decision to use a DEET-based repellent against malaria:
- 98% DEET is an effective repellent — only 33.70% of mosquitoes entered section 1, much lower than the 68.55% for 40% DEET, and the standard errors do not overlap, so the difference is statistically meaningful.
- The standard errors for 98% DEET (33.70 ± 4.06) and 30% lemon eucalyptus oil (29.62 ± 6.31) overlap, so these two repellents are not significantly different; lemon eucalyptus oil is equally effective at a lower concentration, so the student's preference for DEET is not the best-supported choice from the data.
- 40% DEET is not particularly effective (68.55% in section 1) — concentration matters, so the claim "DEET works" is only true at high concentrations.
- Aedes aegypti transmits yellow fever, not malaria, so the data cannot be used directly to judge effectiveness against malaria-transmitting mosquitoes. The procedure only measured mosquito attraction; the mosquitoes were not allowed to take a blood meal, so the experiment does not directly show that DEET prevents mosquito bites or malaria transmission.
Overall, the data show that 98% DEET is an effective repellent against A. aegypti, but neither the species tested nor the measure taken supports the specific decision to use DEET to prevent malaria.
Partially supports: 98% DEET is effective, but the wrong mosquito species (yellow fever, not malaria) was tested and only attraction — not biting — was measured, so the data do not fully justify using DEET specifically to prevent malaria.
Background Concept
Evaluating a published experiment against a new application requires three checks:
- Read the data correctly — what the numbers actually say.
- Check the statistics — do differences lie outside the variability of the measurements?
- Check the relevance — is the experimental system (species, outcome measured) appropriate for the new application?
A standard error (SE) is a measure of how precisely the sample mean estimates the true population mean. Two means with non-overlapping SE bars can be considered significantly different at the 5% level; means with overlapping SE bars may not be. Here, the mean ± SE for each repellent can be compared visually.
Vector specificity matters: different mosquito species transmit different diseases. Aedes aegypti is the principal vector of yellow fever, dengue, Zika and chikungunya. Malaria is transmitted by Anopheles species (mainly Anopheles gambiae in Africa). A repellent effective against Aedes aegypti is not automatically equally effective against Anopheles.
Attraction vs. biting: a mosquito that is repelled before reaching the host cannot bite, so reducing attraction should reduce biting and disease transmission. But an experiment that only measures attraction (e.g. which section of a cage the mosquito moves to) does not directly test whether biting is prevented. The link is biologically reasonable but is not demonstrated by the data themselves.
Understanding the Question
The student read that 98% DEET repels mosquitoes effectively and concluded that DEET is the most effective repellent. The student is going to a malaria-endemic country and decides to use DEET. We are asked to evaluate whether the procedure and Table 3.1 actually support this specific decision.
The data in Table 3.1 are:
- DEET 40%: 68.55 ± 6.42% in section 1 (less effective — more mosquitoes near the person)
- DEET 98%: 33.70 ± 4.06% in section 1 (more effective)
- Lemon eucalyptus 30%: 29.62 ± 6.31% in section 1 (most effective)
- Picaridin 10%: 78.65 ± 6.00% in section 1 (least effective)
Section 1 is closest to the human volunteer, so a LOWER percentage in section 1 means the mosquito is being repelled more strongly. The command word is explain, which means we must give reasons (not just conclusions) and link each reason back to the data and the procedure.
Approach
First, read what the data say about DEET's effectiveness. Second, look at the statistics — does the difference between 98% DEET and lemon eucalyptus oil lie outside the SE? Third, check whether the experiment is even appropriate for the student's stated application (malaria).
A complete 4-mark answer addresses:
- A point that supports the decision (98% DEET does work).
- A point that qualifies the support (40% DEET does not work, and lemon eucalyptus is equally effective).
- A point that shows the experiment may not apply to malaria (wrong mosquito species).
- A point that shows the procedure measured attraction, not biting, so it does not directly demonstrate prevention of disease transmission.
Step-by-Step Reasoning
Point 1 — 98% DEET is an effective repellent.
A mean of 33.70% of mosquitoes in section 1 is much lower than the 40% DEET result (68.55%). Their SEs do not overlap (40% DEET: 62.13–74.97; 98% DEET: 29.64–37.76), so this difference is statistically meaningful. 98% DEET clearly repels A. aegypti.
Point 2 — Lemon eucalyptus oil is equally effective, so DEET is not uniquely the best choice.
The SEs for 98% DEET (29.64–37.76) and 30% lemon eucalyptus oil (23.31–35.93) overlap. The means are marginally different (33.70% vs 29.62%) but the difference is not statistically significant — and lemon eucalyptus oil achieves it at a much lower concentration. The student's conclusion that "the most effective repellents are DEET or lemon eucalyptus oil" is supported, but the implied preference for DEET over lemon eucalyptus is not.
Point 3 — Concentration matters: 40% DEET is not effective.
40% DEET gives 68.55% in section 1, similar to picaridin (78.65%) and only marginally lower. The claim that "DEET works" is therefore not universally true — only at high concentration. A consumer buying a "DEET repellent" might pick up a low-concentration product that performs poorly.
Point 4 — Relevance to malaria.
Aedes aegypti transmits yellow fever, not malaria. Malaria is transmitted by Anopheles mosquitoes. The data show that 98% DEET repels Aedes aegypti, but they do not show that DEET repels Anopheles to the same degree. The student's decision to use DEET against malaria is therefore based on extrapolation, not on these data.
Point 5 — The experiment measured attraction, not biting.
The mosquitoes in the cage were separated from the volunteer by 1 m of moving air. They could not land on or bite the volunteer. The experiment only shows that mosquitoes are less likely to fly toward a person wearing DEET. It does not directly show that biting is prevented. A field trial measuring actual bites or disease incidence would be more relevant.
Point 6 — Limitations of the data.
Only one human volunteer was used, so the result depends on that person's individual skin chemistry and attractiveness to mosquitoes. No formal statistical test (e.g. t-test) was carried out — the SE overlap is a useful visual guide but not a substitute for a test of significance. The three repeats were on different days using the same person, so day-to-day variation in mosquito behaviour is averaged but person-to-person variation is not.
Key Takeaways
- A claim from data must be evaluated against both the numbers and the experimental design.
- SE overlap is a quick visual proxy for "significantly different or not" but is not a substitute for a formal statistical test.
- Mosquito species matters: repellents effective against one vector species are not automatically effective against another.
- "Attraction" and "biting" are linked but distinct — a repellent test that only measures attraction cannot directly claim to prevent disease.
- The student's general claim ("DEET is a good repellent") is partially supported; the specific claim ("DEET will prevent malaria") is not directly supported by this experiment.
Common Mistakes
- Saying "the data support the decision" without checking that the species and the measure are right for malaria.
- Concluding that all DEET concentrations are equally effective — 40% DEET is clearly much less effective than 98%.
- Stating "there is no significant difference" without pointing to the SE overlap that supports the claim.
- Quoting the wrong section of the cage: section 1 is closer to the volunteer, so a HIGHER percentage in section 1 means LESS effective repellence.
- Forgetting that only one human volunteer was tested, so the data may not generalise to other people.
Things to Be Careful About
- The mark scheme accepts up to four points from a list of nine. Pick the most relevant and well-justified ones.
- The malaria point (A. aegypti does not transmit malaria) is the single most important limitation of the experiment for the student's specific decision — do not omit it.
- Mention "standard error overlap" rather than "the values are similar"; precise statistical language scores the mark.
- A good evaluation ALWAYS combines a "what the data support" with a "what the data do not support" answer, because the question asks for both.