Biology 9700/42 — May/June 2024
Cambridge A-Level · A Level Structured Questions · worked solutions for every part, with the mark scheme
Topics Homeostasis · Inheritance · Selection and Evolution · Genetic Technology · Energy and Respiration · Photosynthesis · +2 more
Osmoregulation is the control of the water potential of body fluids such as blood.
Osmoreceptors and antidiuretic hormone (ADH) have an important role in osmoregulation.
Answer
Hypothalamus
Hypothalamus
Background Concept
Osmoregulation is the homeostatic control of the water potential of body fluids. Cells take up or lose water by osmosis if the water potential of their surroundings changes, so the body must keep the water potential of blood and tissue fluid within narrow limits. Osmoreceptors are specialised sensory cells that detect these changes. The hypothalamus, located in the floor of the diencephalon just above the pituitary gland, is the major integrative centre for homeostasis, including osmoregulation and temperature control.
Understanding the Question
The question stem introduces osmoregulation as the control of blood water potential, and the (a) stem notes that osmoreceptors and ADH have an important role in it. Part (a)(i) is a one-mark "name" question that requires the anatomical location of the osmoreceptors. The mark scheme rewards the single word "hypothalamus"; no further detail is required for the mark.
Approach
Recall that osmoreceptors sit in the same brain region that synthesises ADH. The hypothalamus is both the site of the osmoreceptors and the source of ADH production (although ADH is released from the posterior pituitary).
Step-by-Step Reasoning
- The question asks for the location of osmoreceptors.
- Osmoreceptors are sensory cells in the hypothalamus that monitor the water potential of blood.
- The single-word answer is "hypothalamus".
Key Takeaways
- Osmoreceptors are located in the hypothalamus.
- The hypothalamus also synthesises ADH; the posterior pituitary stores and releases it.
- These two facts are commonly tested together.
Common Mistakes
- Writing "pituitary gland" — this is where ADH is released, but not where the osmoreceptors are.
- Writing "cerebrum" or "medulla oblongata" — these are not the specific location.
- Naming a structure rather than its location (e.g. "receptor") — this scores zero.
Things to Be Careful About
Make sure you name the location, not the structure that responds to the signal. The hypothalamus is the location; the posterior pituitary (in part (a)(iii)) is the structure that releases ADH.
Answer
(Changes in) water potential (of the blood)
(Changes in) water potential (of the blood)
Background Concept
Osmoreceptors are sensory cells that detect changes in the water potential () of blood. Water potential measures the tendency of water to move from one place to another, expressed in kilopascals (kPa); pure water has , and any solution has a negative . A fall in blood (becoming more negative) means the blood is more concentrated, e.g. after sweating or eating salty food; a rise in blood means the blood is more dilute, e.g. after drinking a large volume of water.
Understanding the Question
The (a) stem introduces the role of osmoreceptors in osmoregulation. Part (a)(ii) is a one-mark "state" question asking what stimulus the osmoreceptors detect. The mark scheme accepts either the words "water potential" or the symbol .
Approach
Recall the precise physiological property monitored by osmoreceptors and use the correct scientific term.
Step-by-Step Reasoning
- Osmoreceptors respond to a specific physical property of the blood.
- That property is the water potential.
- The stimulus is a change in blood water potential away from the set point.
- State the answer using the precise term: "(changes in) water potential (of the blood)".
Key Takeaways
- The stimulus is water potential, not "sodium concentration", "osmotic pressure" or "water content".
- The mark scheme also accepts the symbol as a shorthand.
Common Mistakes
- Writing "osmotic pressure" or "osmolarity" — these are related but not the mark-scheme terms.
- Writing "salinity" or "sodium concentration" — the receptor responds to water potential, not specifically to ion concentrations.
- Writing "concentration of water" — too vague; the precise term is "water potential".
Things to Be Careful About
- Use the term "water potential" rather than just "water" or "concentration".
- The mark scheme wording includes "changes in" — the receptors detect a deviation from the set point, not an absolute value.
Answer
Posterior pituitary (gland)
Posterior pituitary (gland)
Background Concept
Antidiuretic hormone (ADH), also known as vasopressin, is a small peptide hormone. It is synthesised by neurosecretory cells whose cell bodies lie in the hypothalamus, and the hormone is transported down their axons to the axon terminals in the posterior pituitary. When an action potential arrives at the terminal, ADH is released by exocytosis into the capillaries of the posterior pituitary and enters the systemic circulation. The posterior pituitary is therefore the storage and release site, while the hypothalamus is the site of synthesis.
Understanding the Question
The (a) stem introduces the role of ADH in osmoregulation. Part (a)(iii) is a one-mark "name" question asking for the structure that secretes ADH into the blood. The mark-scheme answer is "posterior pituitary (gland)".
Approach
Recall that ADH is produced in the hypothalamus but is released from the posterior pituitary into the bloodstream.
Step-by-Step Reasoning
- ADH is a peptide hormone carried in the blood.
- It is made by neurosecretory cells whose cell bodies are in the hypothalamus.
- The axons of these cells project into the posterior pituitary.
- The hormone is stored in the axon terminals in the posterior pituitary and released into the blood there.
- The structure that secretes ADH into the blood is therefore the posterior pituitary gland.
Key Takeaways
- ADH is stored in and released from the posterior pituitary, but synthesised in the hypothalamus.
- Both "posterior pituitary" and "posterior pituitary gland" earn the mark.
- The alternative name "neurohypophysis" is also accepted in CIE marking.
Common Mistakes
- Writing "anterior pituitary" — wrong; the anterior pituitary stores and releases different hormones (GH, ACTH, TSH, FSH, LH, prolactin).
- Writing "pituitary" alone — too vague; you must specify "posterior".
- Writing "hypothalamus" — partial credit is unlikely because the question asks for the gland that secretes ADH into the blood; the hypothalamus is where it is made, not where it enters the circulation.
Things to Be Careful About
- "Pituitary gland" alone is too vague; you must specify "posterior". "Posterior pituitary" earns the mark.
ADH acts on the cells of the collecting duct, resulting in changes in the volume and concentration of urine.
Fig. 1.1 shows the relationship between the concentration of ADH in the blood and the rate of production of urine by the kidneys.
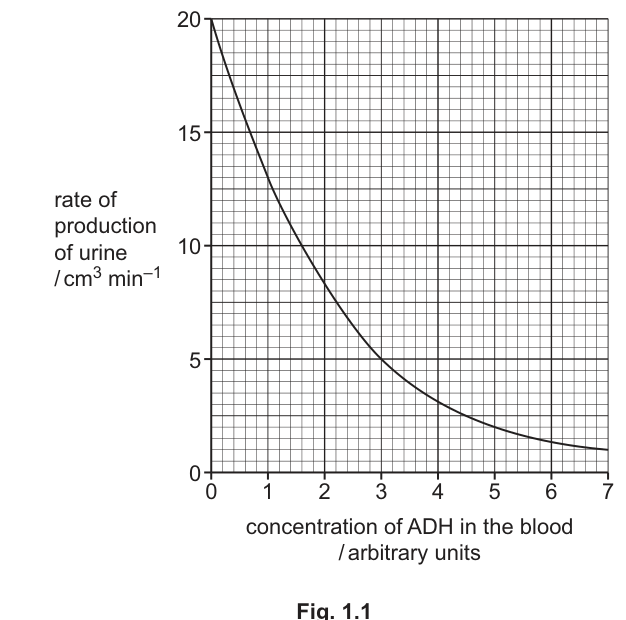
As the concentration of ADH in the blood increases, the rate of production of urine decreases.
Using Fig. 1.1, calculate the percentage decrease in the rate of production of urine between ADH concentrations of 1 and 3 arbitrary units.
Show your working.
Give your answer to one decimal place.
answer = ______
Working
From Fig. 1.1:
- At ADH = 1 arbitrary unit, rate of urine production = 13 cm³ min⁻¹
- At ADH = 3 arbitrary units, rate of urine production = 5 cm³ min⁻¹
Answer
61.5%
61.5%
Background Concept
Percentage change is calculated as (difference ÷ original) × 100. For a decrease, the original value is the starting (higher) value and the new value is the ending (lower) value. Reading values from a graph requires looking carefully at where the curve crosses the gridlines, and where the values lie between gridlines you must estimate to a sensible precision. The denominator in a percentage change is always the original (starting) value, not the smaller one.
Understanding the Question
Fig. 1.1 (introduced in the (b) stem) shows how the rate of urine production changes as blood ADH concentration rises from 0 to 7 arbitrary units. Part (b)(i) asks you to calculate the percentage decrease in the rate of urine production when ADH rises from 1 to 3 arbitrary units. Show your working and give the answer to one decimal place.
Approach
- Read the two values off the graph.
- Apply the percentage-decrease formula using the lower-ADH (starting) value as the denominator.
- Round to one decimal place.
Step-by-Step Reasoning
- At an ADH concentration of 1 arbitrary unit, the curve passes through y ≈ 13 cm³ min⁻¹.
- At an ADH concentration of 3 arbitrary units, the curve passes through y ≈ 5 cm³ min⁻¹.
- Apply the formula:
- Substitute:
- Compute:
- Round to one decimal place: 61.5%.
Key Takeaways
- Use the lower-ADH (starting) value (13) as the denominator, not the higher one.
- Read graph values carefully: small reading errors lead to wrong percentages, so check the gridlines.
- Always include the % sign with the final answer.
- The mark scheme awards one mark for the unrounded value 61.538 (or equivalent) and a second mark for correctly rounding to one decimal place.
Common Mistakes
- Using the wrong denominator: (13 − 5) / 5 × 100 = 160% — this is the percentage increase from 5 to 13, not the decrease from 13 to 5.
- Reading the wrong y-values: at ADH = 1 the value is about 13, not 14 (using 14 would give about 64.3%, which is wrong).
- Not rounding to one decimal place (the mark scheme awards one mark for the unrounded value and the second mark for the rounded value).
Things to Be Careful About
- Use the value at the starting (lower ADH) concentration as the denominator when calculating a decrease.
- Show your working; you score one mark for an unrounded correct value and the second mark for rounding to one decimal place.
- Always quote the unit (%).
Answer
- (Increased ADH results in) aquaporins added to the cell surface membrane / luminal membrane / plasma membrane of the collecting duct cells
- More water leaves the filtrate / collecting duct, entering the blood / tissue fluid (i.e. more water is reabsorbed)
- So the volume of urine decreases and the concentration of urine increases
Increased ADH inserts aquaporins into the collecting duct cell membrane, increasing water reabsorption by osmosis; urine volume decreases and urine becomes more concentrated.
Background Concept
ADH (antidiuretic hormone, also called vasopressin) controls how much water the kidneys reabsorb from the filtrate. It acts on cells of the distal convoluted tubule and, more importantly, the collecting duct. ADH binds to a specific membrane receptor (V2 receptor) on the basolateral side of these cells, activating a cAMP second-messenger cascade. This cascade triggers vesicles containing aquaporin-2 water channels to fuse with the luminal (apical) membrane. With more aquaporins in the membrane, the cell becomes much more permeable to water. Because the tissue fluid surrounding the collecting duct has a higher (less negative) water potential than the filtrate inside the duct, water moves out of the duct by osmosis and is reabsorbed into the blood. When ADH is removed, the aquaporins are retrieved by endocytosis and the membrane becomes impermeable again.
Understanding the Question
The (b) stem tells us that ADH acts on collecting duct cells, changing the volume and concentration of urine, and Fig. 1.1 shows the inverse relationship between blood ADH concentration and urine production rate. Part (b)(ii) is a three-mark "explain" question asking you to account for the trend in Fig. 1.1. The mark scheme accepts any three of four marking points: aquaporin insertion, more water reabsorption, change in urine volume and concentration, or an additional valid point (AVP) such as ADH binding to a receptor or water moving by osmosis.
Approach
Build a logical chain that links the molecular event to the macroscopic observation:
- ADH triggers aquaporin insertion in the collecting duct cell membrane.
- This increases water reabsorption from the filtrate.
- The result is a smaller volume of more concentrated urine.
- (Optional) Add the receptor / osmosis detail as a third mark if needed.
Step-by-Step Reasoning
- Higher blood ADH causes more ADH to bind to receptors on collecting duct cells.
- This triggers the insertion of aquaporin water channels into the luminal (cell surface) membrane, increasing membrane permeability to water.
- As a result, more water leaves the filtrate inside the collecting duct and enters the surrounding tissue fluid and blood — i.e. more water is reabsorbed.
- Therefore the volume of urine decreases and its concentration (of solutes) increases.
- The water moves down a water potential gradient (the tissue fluid has a higher than the filtrate) by osmosis.
Key Takeaways
- ADH's molecular action is on aquaporin-2 trafficking, not on the membrane lipids directly.
- More ADH → more aquaporins → more water reabsorbed → less, more concentrated urine.
- Less ADH (e.g. after drinking water) → aquaporins removed → less water reabsorbed → more, dilute urine.
- Always state both the molecular event (aquaporin insertion) and the renal outcome (smaller volume of more concentrated urine) for full marks.
Common Mistakes
- Writing "ADH makes the collecting duct permeable" — too vague; you must specify aquaporins.
- Writing "ADH causes more water to be removed" — the action is on water reabsorption, not on urine concentration in the bladder.
- Saying ADH "reabsorbs water" — ADH does not itself reabsorb water; it changes membrane permeability so that water can be reabsorbed by osmosis.
- Forgetting to mention both the change in volume AND the change in concentration of urine.
- Writing only descriptions of the graph (e.g. "the curve goes down") — the mark scheme explicitly ignores descriptions.
Things to Be Careful About
- The mark scheme specifically says "aquaporins added to cell surface / luminal / plasma membrane" — you must name the molecule, not just "channels" or "pores".
- Water movement is by osmosis (down a water potential gradient) — this is an alternative marking point (AVP) if you do not cover all three main points.
- Be careful to describe both the cellular event (aquaporin insertion) and the renal outcome (less urine, more concentrated).
Variation exists in populations of a species and this may provide the opportunity for evolution to occur.
Phenotypic variation exists in many forms and has a number of possible causes.
Describe the main factors that are the cause of phenotypic variation.
Answer
- Genetic factors: differences in genotype / alleles, arising from mutation, crossing over, independent assortment of homologous chromosomes and pairs of homologues during meiosis, random fertilisation and random mating.
- Environmental factors: climate, disease, food availability, soil pH and selection pressures affect phenotype.
- Interaction of genes and environment: gene expression is modified by the environment, so the phenotype is the product of both genotype and environment.
Genetic, environmental, and the interaction of genes with environment.
Background Concept
Phenotype is the observable characteristic of an organism (its morphology, physiology, biochemistry or behaviour). It is not determined by genotype alone; the environment also acts on the developing and adult organism to produce the final phenotype. For this reason, phenotypic variation in a population arises from three distinct sources, and the mark scheme tests whether the candidate can name each one and supply a credible example.
The three sources are:
- Genetic (genotypic) variation – different alleles or different combinations of alleles at the same loci. The ultimate source of new alleles is mutation (gene mutations and chromosomal mutations). During meiosis, crossing over between non-sister chromatids of homologous chromosomes and the independent assortment of homologous chromosomes (and of maternal/paternal chromosome pairs at metaphase I) reshuffle existing alleles into new combinations. Random fertilisation and random mating then determine which combinations actually come together in a zygote.
- Environmental variation – abiotic and biotic factors in the organism's surroundings act on individuals of the same genotype to produce different phenotypes. Common examples the mark scheme credits include climate, disease, food availability, soil pH and selection pressures.
- Gene–environment interaction – many genes are expressed only under particular environmental conditions. The same genotype can produce different phenotypes in different environments (e.g. the Agouti mouse coat-colour gene produces yellow fur only on a high-vitamin diet), and the same environment can be read differently by different genotypes. The mark scheme explicitly credits the wording "gene (expression) is modified by environment".
Understanding the Question
Part (a) is a 3-mark "describe" item worth three independent credit points. The candidate must name one cause of variation and supply an example for each. The mark scheme allows either a category label (e.g. "genetic") or a specific example (e.g. "mutation") to score the point, but a generic statement such as "variation is caused by genes" without an example does not unlock the mark for the example strand.
Approach
Treat the answer as three short, parallel statements: genetic cause + example, environmental cause + example, interaction of the two + example. Use precise CIE terminology — "alleles", "mutation", "crossing over", "independent assortment" — rather than colloquial substitutes ("genes mix up").
Step-by-Step Reasoning
- Mark 1 (genetic): Name genetic variation and give one process that creates it. Mutation is the source of all new alleles, so it is the strongest example; crossing over, independent assortment, random fertilisation and random mating are also credited.
- Mark 2 (environmental): Name environmental variation and give one factor. Any of climate, disease, food availability, soil pH or selection pressure is credited. "Diet" alone is usually insufficient without the example being clearly environmental.
- Mark 3 (interaction): State that phenotype results from genes and environment acting together. The mark scheme accepts either "combination / interaction, of genes and environment" or the example "gene (expression) is modified by environment".
Key Takeaways
- Phenotype = genotype + environment + their interaction.
- Mutation is the only source of new alleles; the other genetic mechanisms only reshuffle existing alleles.
- Continuous variation is usually polygenic and strongly affected by the environment; discontinuous variation is usually controlled by one or few genes with little environmental influence.
Common Mistakes
- Saying "genes" without naming alleles, genotypes or a process — this loses the example mark.
- Confusing discontinuous and continuous variation with their causes; the question asks about causes, not patterns.
- Omitting the gene–environment interaction. Many candidates list only genetic and environmental causes and forget that the two interact, so they score only 2 of the 3 marks.
- Writing "natural selection causes variation" — natural selection acts on variation; it does not create it.
Things to Be Careful About
- The mark scheme credits either a category label or an example for each point, not both required.
- "Selection pressure" is listed as an environmental example; do not write "selection causes variation".
- For the interaction mark, the wording "genes and environment work together" is too vague to score — explicitly state that gene expression is modified by the environment, or use the mark scheme's wording.
Answer
- New species arise from pre-existing species / share a common ancestor.
- Characteristics / phenotypes of organisms change over time / across generations.
- The mechanism of change is natural selection (and genetic drift).
- As a result, the gene pool / allele frequencies of a population change from generation to generation.
Evolution is the change in allele frequencies of a population over generations, driven by natural selection, producing new species from pre-existing species.
Background Concept
The modern theory of evolution synthesises Darwin and Wallace's idea of natural selection with Mendelian genetics and population genetics. The three core statements are:
- Descent with modification – all living organisms share common ancestors; new species arise by divergence from pre-existing ones.
- Natural selection – in a population showing heritable variation, individuals with phenotypes better suited to the environment survive and reproduce more (differential survival and reproduction), passing their alleles to the next generation. This is Darwin's mechanism.
- Change in gene pools – because selection (and processes such as genetic drift, gene flow and mutation) changes allele frequencies between generations, populations evolve. Evolution is therefore defined as a change in the allele frequency of a gene pool over time.
The mark scheme credits five statements from this body of theory; the candidate only needs any three.
Understanding the Question
Part (b)(i) is a 3-mark "outline" item. "Outline" means sketch the key points without going into great detail — three crisp sentences covering the substance of evolutionary theory will earn full marks.
Approach
Pick the three strongest points from the mark scheme's list: (1) common ancestry and speciation, (2) change in phenotype over generations, (3) natural selection as the mechanism, and optionally (4) gene-pool / allele-frequency change. Any three suffice, so choose the ones the candidate can state most precisely.
Step-by-Step Reasoning
- Speciation / common ancestor: "New species form from pre-existing species / share a common ancestor." This is the descent-with-modification idea.
- Change over time: "Characteristics (phenotypes) change over time / over generations." Without this the rest of the theory has nothing to act on.
- Natural selection: state it as the mechanism. A common weak phrasing is "animals adapt"; the correct phrasing is that selection acts on pre-existing variation among individuals, and differential survival and reproduction of better-adapted phenotypes changes the population.
- Gene-pool change (alternative): "The allele frequencies in the gene pool change" — this is the modern, measurable definition of evolution and scores the third mark if natural selection has already been credited, or vice versa.
- Genetic drift (alternative): in small populations, allele frequencies can change by random sampling effects; this is credited alongside natural selection.
Key Takeaways
- Evolution = change in allele frequencies over generations.
- Natural selection requires heritable variation, differential survival/reproduction and inheritance.
- A "theory of evolution" answer must include speciation, change over time, and a mechanism (natural selection and/or drift).
Common Mistakes
- Writing "animals adapt to their environment" — adaptation implies an intentional, individual-level change, which Lamarckian explanations are. CIE expects selection on pre-existing variation.
- Failing to mention that evolution occurs in populations (over generations), not in individual organisms.
- Omitting the common-ancestry point and presenting evolution as a linear "ladder of progress"; modern theory is branching.
- Describing natural selection without linking it to a change in allele frequencies.
Things to Be Careful About
- "Theory" here means the scientific body of explanation, not "guess"; use precise terms such as "natural selection", "allele frequency" and "gene pool".
- "Outline" allows brief statements — three short sentences are sufficient.
- The five-point mark scheme lets the candidate drop any two; choose the strongest three.
The theory of evolution is supported by DNA sequence data.
Explain how DNA sequences are used to show evolutionary relationships between species.
Answer
- DNA sequences are compared between species.
- The more similar the DNA sequences, the more closely related the species and the more recent their common ancestor (and vice versa).
- Over time, mutations accumulate in DNA; species that diverged longer ago have had more time to accumulate different mutations.
- Bioinformatics software / databases (e.g. GenBank, BLAST) are used to align sequences and quantify similarity.
- A phylogenetic tree / molecular clock can be built from the percentage similarity of the sequences.
DNA sequences are compared using bioinformatics; the more similar the sequences, the more recently the species shared a common ancestor, because mutations accumulate with time.
Background Concept
All organisms share a common genetic code, so homologous genes can be aligned across species. Because mutations occur at a roughly constant rate over evolutionary time, the number of nucleotide differences between two species' versions of the same gene is proportional to the time since they last shared a common ancestor. This idea is the molecular clock, and the practical work of comparing sequences at scale is done with bioinformatics — software such as BLAST, ClustalW and MEGA, together with databases such as GenBank and Ensembl.
Understanding the Question
Part (b)(ii) asks the candidate to explain how DNA sequence data support evolutionary relationships — not just to describe a method. The marks reward (a) the act of comparison, (b) the inference about relatedness from similarity, (c) the reason (mutation accumulation / time), (d) acknowledgement of the bioinformatics tools used, and (e) any valid additional point (molecular clock, mtDNA choice, phylogenetic tree). Any three earn full marks, but a complete answer contains all five.
Approach
Move from method → inference → mechanism → application. The candidate should (1) say what is done (sequences are compared); (2) say what the result means (more similar = more closely related); (3) say why (mutations accumulate over time); (4) name the tools; (5) optionally state how the data is displayed (phylogenetic tree / molecular clock).
Step-by-Step Reasoning
- Comparison: "The DNA sequences of the same gene from different species are aligned and compared." This is the foundation; without comparison there is no analysis.
- Similarity → relatedness: "The more similar the sequences, the more closely related the two species and the more recently they diverged from a common ancestor." The reverse argument ("the more different, the more distantly related") is also credited (ORA).
- Mutation accumulation: "Mutations occur spontaneously over time, so species with longer independent evolutionary histories have accumulated more differences." This is the causal explanation linking the comparison to the evolutionary conclusion.
- Bioinformatics: "Computer software and online databases (e.g. GenBank, BLAST, ClustalW) align sequences and quantify similarity." This earns the technology mark and reflects current practice.
- AVP (molecular clock / tree): "If mutation rate is approximately constant, the number of differences acts as a molecular clock; the percentage similarity is used to build a phylogenetic tree showing evolutionary relationships." Mitochondrial DNA is often chosen because it lacks crossing over, so its sequence changes only by mutation — this AVP is credited when offered.
Key Takeaways
- Closely related species have more similar DNA sequences because they share a more recent common ancestor and therefore less time for mutations to accumulate.
- Bioinformatics is the practical engine of modern comparative genomics — sequence comparison at scale would be impossible by hand.
- DNA sequence data give a quantitative, testable measure of evolutionary relatedness, complementing morphological and fossil evidence.
Common Mistakes
- Saying "humans share 99% of DNA with chimpanzees so we evolved from them" — humans and chimpanzees share a common ancestor, not a parent–offspring relationship; the wording matters.
- Skipping the causal step (mutations accumulate over time) and giving only the descriptive comparison.
- Conflating gene sequences with whole genome similarity; the question is about sequences, so either a single gene or whole-genume comparison is acceptable, but the candidate must be clear which is meant.
- Claiming that "similar DNA = same species" — DNA similarity is a quantitative, graded measure of relatedness, not a binary species test.
- Mentioning PCR or gel electrophoresis as the comparison method; these produce sequences or fragments but do not compare them across species — the comparison step is bioinformatics.
Things to Be Careful About
- The "ORA" (or reverse argument) for the similarity/relatedness point is credited — either direction scores the mark.
- "Molecular clock" and "mitochondrial DNA" are bonus points; the candidate does not need them but they elevate the answer.
- Keep the answer focused on evolutionary relationships; do not drift into a discussion of how DNA codes for proteins or how mutations arise — these are background, not the question.
- The mark scheme allows any three of five; aim for the comparison + similarity/relatedness + mutation accumulation trio as a minimum.
The tortoise beetle, Chelymorpha alternans, is an insect found in Panama that has several different colour patterns. Fig. 3.1 shows a tortoise beetle.
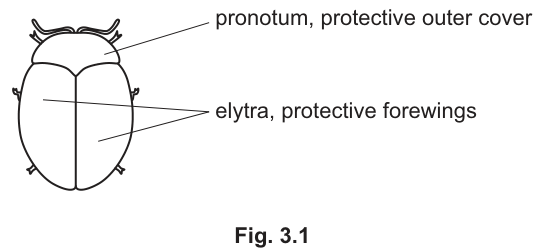
Researchers have identified a gene, , that controls colour pattern in the pronotum and elytra. Gene has four different alleles: , , and .
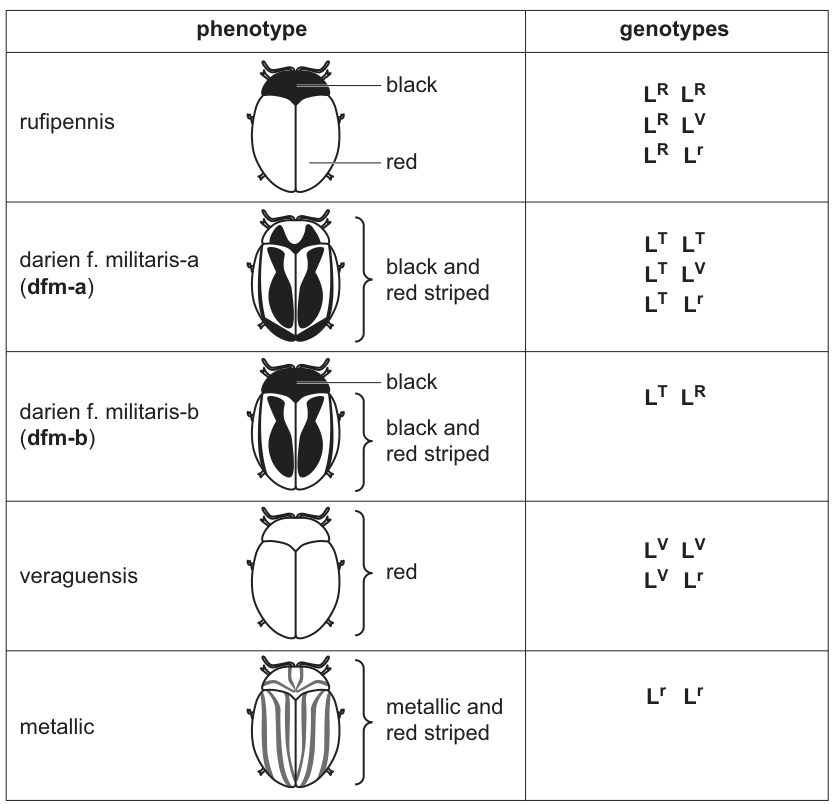
Table 3.1 shows five different colour pattern phenotypes of tortoise beetles and their genotypes.
Table 3.1
Explain why the inheritance of colour pattern in tortoise beetles can be described as involving multiple alleles.
Answer
Gene has four different alleles (, , and ); a gene with more than two alleles is described as having multiple alleles.
Gene L has four alleles (L^V, L^T, L^R and L^r) — more than two alleles at one locus = multiple alleles.
Background Concept
A gene is a section of DNA occupying a fixed position (locus) on a chromosome. Within a population, different versions of the same gene are called alleles. Any individual diploid organism carries only two alleles at a locus (one on each chromosome of a homologous pair), but a population as a whole can carry many different alleles at that single locus — this is what is meant by multiple alleles (sometimes called an allelic series).
A classic example is the human ABO blood group gene, which has three alleles (, and ); the tortoise beetle gene here is even more extreme, with four alleles at the same locus.
Understanding the Question
The question simply asks the candidate to justify the use of the term "multiple alleles" for the colour-pattern gene in this beetle. The information required is given in the stem: gene has four different alleles, , , and .
The command word is "explain why… can be described as" — so the answer must make the link between the fact (four alleles) and the term (multiple alleles).
Approach
State that the gene has more than two alleles and connect that to the term "multiple alleles". A single sentence is enough for this 1-mark part.
Step-by-Step Reasoning
- Look at the information provided about gene : four different alleles are listed.
- Recall the definition: multiple alleles describes a gene that has more than two different alleles within a population.
- Connect the two: 4 > 2, so this is a multiple-allele system.
Key Takeaways
- Multiple alleles = more than two alleles at one locus in the population.
- An individual still only has two of these alleles (one on each chromosome of the homologous pair).
- Each different combination of two alleles gives a (potentially) different phenotype.
Common Mistakes
- Saying the beetle has four alleles — the individual beetle only has two; it is the gene in the population that has four alleles.
- Confusing "multiple alleles" with "multiple genes" — they are not the same thing.
Things to Be Careful About
Just stating "there are four alleles" alone may not be enough on its own; link it explicitly to the idea that more than two alleles means multiple alleles. The mark scheme accepts "a gene which has more than two alleles".
A tortoise beetle with dfm-b phenotype was crossed with another tortoise beetle with dfm-b phenotype.
Construct a genetic diagram to show the results of this cross, including the ratio of offspring phenotypes.
parental phenotypes: dfm-b dfm-b
parental genotypes:
gametes:
offspring genotypes:
offspring phenotypes:
ratio of offspring phenotypes:
Working
Parental phenotypes: dfm-b × dfm-b
Parental genotypes: ×
(from Table 3.1, dfm-b has the single genotype )
Gametes: each parent produces and in equal numbers.
Punnett square:
Offspring genotypes: : :
Offspring phenotypes (from Table 3.1):
- → darien f. militaris-a (dfm-a)
- → darien f. militaris-b (dfm-b)
- → rufipennis
Answer
Ratio of offspring phenotypes = 1 dfm-a : 2 dfm-b : 1 rufipennis
1 dfm-a : 2 dfm-b : 1 rufipennis
Background Concept
A monohybrid cross follows the inheritance of a single gene. The expected offspring of a cross are predicted by:
- identifying the parental genotypes from their phenotypes;
- writing out the gametes each parent can produce (one allele per gamete for a diploid);
- combining the gametes in a Punnett square to give the offspring genotypes;
- translating each offspring genotype into a phenotype using a key such as Table 3.1.
Where multiple alleles exist, each individual still only carries two of them, so the cross is worked out exactly as for any monohybrid cross.
Understanding the Question
A dfm-b beetle is crossed with another dfm-b beetle. Table 3.1 shows that the dfm-b phenotype has only one possible genotype: . The question asks for a complete genetic diagram, with parents, gametes, offspring genotypes, offspring phenotypes and a phenotypic ratio — six labelled sections, each worth a mark in the mark scheme.
Approach
- Read off the only genotype for dfm-b from Table 3.1.
- Show both parents as .
- A heterozygous parent produces two kinds of gamete, and .
- Combine the gametes in a 2 × 2 Punnett square.
- Read off offspring genotypes and convert each to a phenotype using Table 3.1.
- State the ratio clearly.
Step-by-Step Reasoning
- Parental genotypes. Table 3.1 lists dfm-b with a single genotype: . Therefore both parents must be .
- Gametes. Each parent can pass on either or , so each parent produces two kinds of gamete in equal proportions: and .
- Punnett square. A standard 2 × 2 grid gives four boxes:
- (top-left)
- (top-right)
- (bottom-left)
- (bottom-right)
- Offspring genotypes. Genotype ratio 1 : 2 : 1 .
- Offspring phenotypes (read off Table 3.1):
- → dfm-a (darien f. militaris-a)
- → dfm-b
- → rufipennis
- Phenotype ratio: 1 dfm-a : 2 dfm-b : 1 rufipennis.
Key Takeaways
- A phenotype produced by a unique genotype in a multiple-allele system makes deducing the cross straightforward.
- The cross is still a standard monohybrid cross (1:2:1 genotypic and phenotypic in this case).
- A Punnett square must be drawn clearly with gametes labelled and genotypes linked to phenotypes.
Common Mistakes
- Assuming dfm-b must be a heterozygote of two different alleles from outside the table — Table 3.1 explicitly gives the only genotype, .
- Forgetting to link each offspring genotype to its phenotype in the diagram (the mark scheme requires the phenotypes labelled next to the genotypes).
- Writing the ratio in the wrong direction (phenotype order does not matter as long as it is consistent).
- Calling the offspring genotype instead of — the order does not matter for a heterozygote, but be consistent with the allele order used in the question.
Things to Be Careful About
- The Punnett square must show all four boxes filled in.
- Gametes should be written as single alleles (one allele per gamete, e.g. and ).
- Offspring phenotype names should match exactly those used in Table 3.1: dfm-a, dfm-b, rufipennis.
Colour pattern phenotype involves alleles that show codominance. There is also an order of dominance of alleles (dominance hierarchy).
Use the information in Table 3.1 to:
- identify the codominant alleles
- list the dominance hierarchy with alleles from the most dominant to the least dominant.
codominant alleles ______
dominance hierarchy ______
Answer
Codominant alleles: and
Dominance hierarchy (most → least dominant):
( and are codominant and both are dominant over , which is in turn dominant over .)
Codominant alleles: L^T and L^R. Dominance hierarchy: L^T and L^R > L^V > L^r.
Background Concept
When two alleles are both fully expressed in the heterozygote (so the heterozygote shows features of both homozygotes) they are said to be codominant. This is different from:
- Dominant/recessive — the dominant allele is fully expressed and the recessive one is hidden in the heterozygote (e.g. over , where is veraguensis, indistinguishable from ).
- Incomplete dominance — the heterozygote has an intermediate phenotype (not the case here, since the heterozygote clearly shows both parental patterns, not a blend).
Where a gene has several alleles they can be arranged in a dominance hierarchy in which some alleles are dominant over others, while two particular alleles may be codominant with each other.
Understanding the Question
The question asks two things:
- Identify the codominant pair from the data in Table 3.1.
- List the dominance hierarchy with alleles from most to least dominant.
The candidate must use Table 3.1 to compare heterozygotes with homozygotes.
Approach
- Look at every heterozygote in Table 3.1.
- For each heterozygote, decide whether the phenotype shows only one of the two homozygote patterns (dominance/recessiveness) or shows both of them (codominance).
- Build the hierarchy from those observations.
Step-by-Step Reasoning
Codominance check. Compare the heterozygote (dfm-b) with the two homozygotes (dfm-a, all black and red striped) and (rufipennis, black pronotum and red elytra):
- The pronotum of dfm-b is black — exactly as in rufipennis, the pattern (i.e. the contribution is visible).
- The elytra of dfm-b are black and red striped — exactly as in dfm-a, the pattern (i.e. the contribution is visible).
- Both parental phenotypes are clearly visible side-by-side, so and are codominant.
Dominance hierarchy. Look at the remaining heterozygotes:
- → rufipennis (the rufipennis phenotype). So is dominant over .
- → dfm-a (the phenotype). So is dominant over .
- → dfm-a (the phenotype). So is dominant over .
- → rufipennis (the phenotype). So is dominant over .
- → veraguensis (the phenotype). So is dominant over .
Combining: and are at the top (codominant with each other and each dominant over ); is dominant over , which is the least dominant.
Key Takeaways
- Codominance is recognised when the heterozygote shows BOTH homozygote phenotypes at once (in different parts of the body, here the pronotum vs. the elytra).
- A dominance hierarchy arranges multiple alleles from most to least dominant; codominant alleles sit at the same level of the hierarchy.
- For each heterozygous pair, compare the phenotype with both corresponding homozygotes to decide the relationship.
Common Mistakes
- Confusing codominance with incomplete dominance. Incomplete dominance would give a blend (e.g. pink from red × white), but here the patterns are spatially separate (black pronotum from , striped elytra from ) — both parental patterns are visible intact.
- Saying that and are simply both "dominant" and missing the codominance — the mark scheme specifically requires the recognition that they are codominant.
- Putting above or in the hierarchy — Table 3.1 shows and heterozygotes both look like the and homozygotes respectively, confirming that is recessive to both.
Things to Be Careful About
- Read the table carefully: dfm-b has genotype — there is no other option, and the pattern in dfm-b is not a blend but a combination of the two homozygote patterns, which is the hallmark of codominance.
- When writing the hierarchy, the symbol used is often "=" or putting both alleles at the top (e.g. ""). The mark scheme accepts " and ".
Researchers carried out two crosses.
Cross 1: female veraguensis tortoise beetles were crossed with male metallic tortoise beetles.
The results are shown in Table 3.2.
Table 3.2
| number of observed offspring phenotypes | ratio of observed colour pattern phenotypes | |||
|---|---|---|---|---|
| male veraguensis | female veraguensis | male metallic | female metallic | |
| 139 | 153 | 136 | 140 | 1.06:1 |
Cross 2: female veraguensis tortoise beetles were crossed with male veraguensis tortoise beetles.
The results are shown in Table 3.3.
Table 3.3
| number of observed offspring phenotypes | ratio of observed colour pattern phenotypes | |||
|---|---|---|---|---|
| male veraguensis | female veraguensis | male metallic | female metallic | |
| 693 | 592 | 237 | 213 | 2.9:1 |
Using Table 3.1, deduce the genotypes of each of the parental beetles used in cross 1 and cross 2.
cross 1 ______
cross 2 ______
Answer
Cross 1: female × male
Cross 2: × (both parents heterozygous)
Cross 1: L^V L^r × L^r L^r. Cross 2: L^V L^r × L^V L^r.
Background Concept
To deduce parental genotypes from offspring data, work out what each possible parental genotype combination would predict, then choose the combination that matches the observed ratio.
In this gene system:
- veraguensis can be either or ;
- metallic is only ;
- is dominant over , so and both look like veraguensis.
Understanding the Question
Two crosses are described:
- Cross 1: veraguensis (♀) × metallic (♂) → observed ratio 1.06 : 1 veraguensis : metallic (≈ 1 : 1).
- Cross 2: veraguensis (♀) × veraguensis (♂) → observed ratio 2.9 : 1 veraguensis : metallic (≈ 3 : 1).
The candidate must state the genotype of each parent in each cross. There is 1 mark per cross.
Approach
- List the possible genotypes for each parent using Table 3.1.
- For each cross, work out the offspring ratio for every combination of possible parental genotypes.
- Match the predicted ratio to the observed ratio and select the right parental genotypes.
Step-by-Step Reasoning
Cross 1 (veraguensis ♀ × metallic ♂).
Possible female veraguensis genotypes: or .
Male metallic genotype (only one possibility): .
- If female is : all offspring are → all veraguensis. Predicted ratio 1 : 0 — does not match.
- If female is : offspring are 1 (veraguensis) : 1 (metallic). Predicted ratio 1 : 1 — matches the observed 1.06 : 1. ✔
So cross 1 parents are (♀) × (♂).
Cross 2 (veraguensis ♀ × veraguensis ♂).
Possible genotypes: each parent could be or .
- If both are : all offspring → all veraguensis. Ratio 1 : 0 — does not match.
- If one is and the other is : offspring 1 : 1 → all veraguensis. Ratio 1 : 0 — does not match.
- If both are : offspring 1 : 2 : 1 → 3 veraguensis : 1 metallic. Ratio 3 : 1 — matches the observed 2.9 : 1. ✔
So cross 2 parents are both .
Key Takeaways
- When deducing parental genotypes, work out the prediction for every possible cross and select the one that matches the observed ratio.
- The dominant/recessive relationship between and means that the two genotypes of veraguensis ( and ) cannot be distinguished phenotypically, but they give very different offspring ratios when crossed.
- A 3 : 1 ratio is the classic signature of a heterozygous × heterozygous cross for a recessive allele.
Common Mistakes
- Forgetting that veraguensis has two possible genotypes — the table shows both and .
- Stating that cross 2 must be × because both parents look veraguensis. This would give no metallic offspring, which contradicts the data.
- Mixing up which cross is which.
Things to Be Careful About
- Make sure the answer names both parents in cross 1 (the female and the male ) and that for cross 2 the candidate clearly indicates that both parents are .
- The mark scheme allows the cross 2 answer to be written either as " × " or as " (and )" — both are accepted.
An assumption was made that female tortoise beetles have XX chromosomes and males have XY chromosomes. Gene is not located on the X chromosome. It was concluded that colour pattern phenotype followed autosomal inheritance.
Explain how the evidence in Table 3.3 supports this conclusion.
Answer
If gene were X-linked, the cross in Table 3.3 would produce no female metallic offspring (females would all be veraguensis because they would inherit an allele from the father). The observation that female metallic offspring are produced shows the gene cannot be X-linked, supporting autosomal inheritance.
Female metallic offspring are produced, which would not be possible if L were X-linked (all daughters would inherit L^V from the father and be veraguensis).
Background Concept
Sex-linked genes sit on a sex chromosome (usually the X). A key diagnostic feature of X-linked recessive inheritance is that:
- A homozygous recessive female () can only arise if she inherits from both parents — which means her father must be (and so the father would also show the recessive phenotype).
- A heterozygous female () crossed with a heterozygous male () gives daughters who are all – (i.e. all show the dominant phenotype), and sons who are 1 : 1 dominant : recessive.
So in a sex-linked recessive situation, the recessive phenotype appears only in males (except in the rare case of a homozygous recessive mother, which then forces the father to be recessive too).
Understanding the Question
Cross 2 is × (both veraguensis), giving 2.9 : 1 veraguensis : metallic, with both male and female metallic offspring observed (237 and 213 respectively). The question asks how this evidence supports autosomal (not sex-linked) inheritance.
Approach
- Mentally re-do cross 2 as if the gene were X-linked.
- Compare the prediction with the actual data in Table 3.3.
- Identify the observation that is incompatible with X-linkage.
Step-by-Step Reasoning
If L were X-linked, cross 2 (veraguensis ♀ × veraguensis ♂) would be:
- Female parent:
- Male parent:
- Offspring:
- Daughters: and — both veraguensis (because all daughters receive from the father).
- Sons: (veraguensis) and (metallic) — 1 : 1.
- So under X-linkage, all daughters would be veraguensis; there would be no female metallic offspring.
In the actual data in Table 3.3, 213 female metallic offspring were produced.
- This is impossible if the gene were X-linked (a female would need two alleles, requiring her father to be — but the father is veraguensis, so he must carry ).
- Therefore the gene cannot be X-linked.
The observation that the ratio of phenotypes is broadly similar in both sexes (and the presence of female metallic offspring) supports the conclusion that the gene is autosomal.
Key Takeaways
- The key diagnostic for X-linked recessive inheritance is the absence of homozygous-recessive females when the father is phenotypically dominant.
- Whenever both sexes show a recessive phenotype, autosomal inheritance is far more likely than X-linkage.
- For sex-linked evidence, look carefully at the distribution of phenotypes between the sexes, not just the overall ratio.
Common Mistakes
- Saying only "the ratio is the same in males and females" without explaining why this rules out X-linkage. The mark scheme accepts this, but the more convincing argument is the presence of female metallic offspring.
- Stating that the ratios are "significantly different" between males and females — in fact they are broadly similar, which is the point.
- Confusing autosomal dominant with autosomal recessive — here the question is about whether the gene is on a sex chromosome, not about dominance.
Things to Be Careful About
- The mark scheme accepts three alternative answers: (1) similar numbers of male and female offspring for each phenotype, (2) female metallic offspring are produced, or (3) if X-linked, no female metallic offspring would be produced.
- Any one of these is sufficient; the strongest is the presence of female metallic offspring.
Name a statistical test that can be used to determine whether the ratio of observed phenotypes is significantly different from the expected ratio.
Answer
Chi-squared test ()
Chi-squared test
Background Concept
The chi-squared (χ²) test is used to test whether observed categorical data fit a hypothesised expected ratio. It compares observed counts with expected counts and gives a probability that any deviation is due to chance. It is the standard test for genetics data where offspring fall into discrete phenotype classes.
The general formula is:
where is the observed number in each category and is the expected number calculated from the hypothesised ratio and the total number of offspring.
The result is compared with a critical value at the appropriate degrees of freedom (df = number of categories − 1) and chosen probability (usually ).
Understanding the Question
The data in Tables 3.2 and 3.3 are observed counts of offspring falling into different phenotype categories (veraguensis and metallic, and within each, male and female). The candidate is asked to name a statistical test that compares these observed counts to an expected ratio.
Approach
- Recall which statistical test is appropriate for comparing observed counts to expected ratios in genetics.
- The test must be the chi-squared test.
Step-by-Step Reasoning
- The t-test compares two means of continuous data, not categorical ratios — not appropriate.
- The Hardy–Weinberg equations test for allele frequencies in populations — not appropriate for a single cross.
- The chi-squared test compares observed categorical counts with expected counts based on a hypothesis — exactly what is needed here.
- The mark scheme also accepts the symbol .
Key Takeaways
- The chi-squared test is the standard statistical test for observed vs. expected categorical data in genetics.
- It is appropriate when the data are counts (whole numbers) falling into discrete categories.
- It tests the null hypothesis that there is no significant difference between observed and expected ratios; a calculated χ² greater than the critical value (at the chosen df and probability) leads to rejection of the null hypothesis.
Common Mistakes
- Naming the t-test (which compares two means) — wrong because the data are categorical counts, not means.
- Naming standard deviation or standard error — these summarise spread, not differences between observed and expected counts.
- Spelling "chi-squared" incorrectly (e.g. "chi squared" written as one word, or "chi^2" written as "chi2") — the mark scheme still accepts the Greek letter, but the standard name should be recognisable.
Things to Be Careful About
- The candidate is not asked to carry out the test, only to name it.
- The mark scheme accepts "chi-squared test" or the symbol .
Genes have a role in determining the overall phenotype of an organism.
Using haemophilia as an example, explain the relationship between a gene, a protein and a phenotype.
Answer
- A gene codes for a protein, and the protein's function in the cell or body determines the phenotype.
- The F8 gene is located on the X chromosome (so it is sex-linked) and codes for the protein factor VIII, a clotting factor.
- The recessive allele codes for a non-functioning (or absent / much-reduced) factor VIII protein.
- Factor VIII is required for blood to clot, so without functional factor VIII, blood does not clot quickly enough and excessive bleeding occurs after injury — this is the phenotype haemophilia.
- Genotype → phenotype links:
- — homozygous dominant female, unaffected
- — heterozygous female, unaffected (carrier)
- — homozygous recessive female, affected
- — male carrying the dominant allele, unaffected
- — male carrying the recessive allele, affected
- Because a single recessive allele on the X chromosome expresses in males (who have only one X), haemophilia is much more common in males than in females.
See working
Background Concept
The central dogma of molecular biology describes how genetic information flows from DNA to protein to phenotype. A gene is a specific DNA sequence that codes for a protein (or a functional RNA). The protein then performs a function in the cell or body that contributes to the organism's observable characteristics — its phenotype.
Haemophilia is a classic Cambridge example used to illustrate this gene → protein → phenotype relationship. It results from mutations in genes coding for blood-clotting factors. Haemophilia A (the more common form) is caused by mutations in the F8 gene, which sits on the X chromosome and codes for clotting factor VIII. Haemophilia B involves F9 and factor IX.
Because F8 is on the X chromosome, inheritance is sex-linked. Males (XY) have only one X, so a single recessive allele produces the affected phenotype — males are hemizygous for X-linked genes. Females (XX) need two recessive alleles to be affected; heterozygous females are phenotypically normal carriers.
Understanding the Question
The question asks you to explain the gene → protein → phenotype relationship, using haemophilia as a worked example. The marks are spread across:
- The general principle that a gene codes for a protein that determines the phenotype.
- Naming the specific gene (F8) and the protein (factor VIII).
- Stating that the gene is on the X chromosome (sex-linked).
- Stating that the recessive allele codes for non-functioning / less / no factor VIII.
- Explaining the resulting phenotype (blood does not clot / excessive bleeding).
- Linking at least some genotypes to phenotypes.
Approach
Lay out the causal chain first — gene → protein → protein's function lost → phenotype — then add concrete genotype–phenotype examples so the sex-linked nature of the inheritance is obvious. Use italics for the gene name (F8) and roman text for the protein (factor VIII) — Cambridge expects this typographical distinction.
Step-by-Step Reasoning
- General principle: A gene codes for a protein, and the protein's activity in the cell or body determines the phenotype.
- Specific gene and protein: The F8 gene is located on the X chromosome (sex-linked) and codes for the protein factor VIII, one of the proteins in the blood-clotting cascade.
- Recessive allele effect: The recessive allele codes for a non-functioning version of factor VIII. The mark scheme accepts "non-functioning", "less", or "no" factor VIII as alternatives — any of these earns the mark.
- Phenotype: Factor VIII normally helps activate factor X in the clotting cascade, which eventually leads to fibrinogen being converted to fibrin and a blood clot forming. Without functional factor VIII, the clot forms too slowly, so bleeding after injury is prolonged. This is haemophilia.
- Genotype–phenotype links:
- — homozygous dominant female, unaffected.
- — heterozygous female, unaffected carrier (because F is dominant over f).
- — homozygous recessive female, affected.
- — male carrying the dominant allele, unaffected.
- — male carrying the recessive allele, affected.
- Because a single recessive allele on the X chromosome is enough to produce the phenotype in males, haemophilia is much more common in males than in females.
Key Takeaways
- The gene → protein → phenotype chain: a gene codes for a protein, and the protein's function in the body determines the phenotype.
- Haemophilia A is caused by recessive mutations in F8, the X-linked gene coding for factor VIII.
- The recessive allele produces non-functioning factor VIII, impairing blood clotting.
- Sex-linked inheritance means recessive X-linked alleles express in males (hemizygous) more readily than in females.
Common Mistakes
- Vague phrasing such as "a gene causes haemophilia" without specifying F8 and factor VIII — this misses the protein link in the middle of the chain.
- Saying F8 is on an autosome — it is on the X chromosome.
- Saying haemophilia is dominant — it is recessive.
- Failing to link genotype to phenotype with concrete examples for both sexes.
- Confusing the gene (italic) with the protein (roman) — Cambridge expects F8 and factor VIII.
Things to Be Careful About
- Use italic for gene names (F8) and roman for protein names (factor VIII).
- Genotypes for X-linked genes in males must include the Y — e.g. , not just .
- A heterozygous female is a carrier — phenotypically normal but able to pass the recessive allele to her offspring.
- The mark scheme accepts "no", "less", or "non-functioning" factor VIII as alternatives — any of these earns the mark, but the protein must be named.
In the pea plant, Pisum sativum, the genotype lele results in plants with short stems (dwarf plants).
Explain how the lele genotype and its gene product results in dwarf plants.
Answer
- lele is the homozygous recessive genotype (two copies of the recessive le allele).
- The le allele codes for a non-functional version of the enzyme GA 3β-hydroxylase (GA3-oxidase), the final enzyme in the gibberellin biosynthesis pathway.
- Because the enzyme is non-functional, no active gibberellin (GA) is produced from its precursor.
- Active gibberellin normally promotes cell elongation in stem internodes; without it, there is less / no cell elongation, so the internodes remain short and the plant is dwarf.
See working
Background Concept
Plant height is largely controlled by the hormone gibberellin, which promotes cell elongation in stem internodes. Gibberellins are a family of related plant hormones; the form most active in stem elongation is GA. Active GA is synthesised from precursors by a multi-step pathway; the final step is catalysed by the enzyme GA 3β-hydroxylase (also called GA3-oxidase), which converts inactive gibberellin precursors into active GA.
In pea plants (Pisum sativum), the gene coding for this final enzyme is the Le gene. The dominant allele Le codes for a functional version of the enzyme; the recessive allele le codes for a non-functional version. In fact, the le allele carries a single base substitution that replaces a threonine with an alanine in the enzyme, inactivating it.
Understanding the Question
The question asks you to connect the lele genotype in pea plants to the dwarf phenotype via the gene product and its effect on gibberellin and cell elongation. The causal chain is:
lele → non-functional GA 3β-hydroxylase → no active GA → no cell elongation → dwarf plant.
Approach
Walk through the chain one step at a time, making every link explicit. Mention the specific enzyme and the specific active form of gibberellin (GA) so the answer is precise rather than vague. This question is essentially the gene → protein → phenotype chain applied to an enzyme in a hormone-biosynthesis pathway.
Step-by-Step Reasoning
- Genotype: The plant is lele — homozygous recessive, carrying two copies of the recessive le allele and no dominant Le allele.
- Gene product: The le allele codes for a non-functional version of the enzyme GA 3β-hydroxylase, the final enzyme in the gibberellin biosynthesis pathway.
- Gibberellin: Because the enzyme does not work, the inactive precursor cannot be converted into active GA. The plant therefore has no (or much less) active gibberellin.
- Cellular effect: Active GA normally stimulates cell elongation in stem internodes. Without it, cells in the internodes do not elongate, so the internodes remain short.
- Phenotype: A pea plant with short internodes has a short stem overall — the dwarf phenotype.
This is essentially the same gene → protein → phenotype chain as in part (a), but the "protein" here is an enzyme in a metabolic pathway rather than a clotting factor.
Key Takeaways
- The Le/le gene in pea plants codes for GA 3β-hydroxylase, the final enzyme in gibberellin synthesis.
- The recessive le allele codes for a non-functional enzyme, so no active GA is made.
- Without active GA, stem cells do not elongate and the plant is dwarf.
- This is a useful example of how a gene can affect a phenotype indirectly — through its role in synthesising a hormone — rather than directly through a structural protein.
Common Mistakes
- Saying lele "does not code for anything" — it codes for a protein, but that protein is non-functional.
- Saying the le allele "stops gibberellin being made" without specifying the enzyme and the active form GA.
- Confusing gibberellin with auxin — they are different plant hormones with different roles.
- Saying the dwarf plant has shorter cells because the cells "do not divide" — gibberellin mainly affects cell elongation, not cell division.
- Vague statements like "the le allele prevents growth" — the answer must go through the enzyme and the active gibberellin, not jump straight from allele to dwarf.
Things to Be Careful About
- Use italic for gene names (Le, le) and roman for proteins and hormones (GA 3β-hydroxylase, GA).
- It is the active gibberellin GA that is missing, not gibberellin in general.
- The phenotype is "short stems" or "dwarf" — be specific about which part of the plant is affected.
- The mark scheme credits the specific molecular change (alanine instead of threonine in the enzyme) as an extra point if mentioned, but this is not required.
Dwarf plants also occur if the genes controlling growth are not activated (switched on).
Explain how DELLA proteins act as repressors preventing gene expression.
Answer
- DELLA proteins bind to PIF (a transcription factor).
- With DELLA bound, PIF cannot bind to the promoter region of growth-related genes.
- Without PIF on the promoter, RNA polymerase cannot bind to the promoter.
- Therefore transcription does not occur and no mRNA is made.
- The growth-related genes are not expressed, so the plant remains dwarf.
See working
Background Concept
Gene expression in eukaryotes is regulated at many levels, but the first decision is usually whether transcription occurs. For RNA polymerase to begin transcribing a gene, it must bind to the gene's promoter. Often, RNA polymerase can only bind efficiently with the help of activator proteins called transcription factors, which bind to specific DNA sequences near the promoter.
In plants, growth-related genes (such as those involved in cell elongation) are activated by a family of transcription factors called PIFs (Phytochrome-Interacting Factors). PIFs bind to the promoters of these genes and stimulate RNA polymerase to begin transcription.
DELLA proteins are a family of regulatory proteins that act as repressors of these growth genes. They do this by binding to PIFs and physically preventing PIFs from binding to DNA. When DELLA is bound to PIF, the growth genes cannot be transcribed.
Understanding the Question
The question asks you to explain the molecular mechanism by which DELLA proteins repress gene expression. The chain of events is:
DELLA binds PIF → PIF cannot bind DNA → RNA polymerase cannot bind → no transcription.
The mark scheme rewards each step in the chain, so the answer must include all four steps.
Approach
Walk through the repression step-by-step. The key insight — and the most common place students slip up — is that DELLA does NOT bind to DNA directly. It acts by sequestering the transcription factor (PIF) that would otherwise activate the gene. From there, the rest of the chain (PIF off DNA → RNA polymerase off promoter → no transcription) follows.
Step-by-Step Reasoning
- In the absence of active gibberellin, DELLA proteins are stable in the cell and bind to PIF transcription factors.
- With DELLA attached, PIF cannot bind to the promoter region of growth-related genes.
- Without PIF on the promoter, RNA polymerase cannot bind to the promoter either — PIF is needed to help recruit or stabilise RNA polymerase at the promoter.
- Therefore transcription does not occur, and no mRNA is made from the growth-related genes.
- The growth-related genes are not expressed, so the plant remains dwarf.
For completeness, when active gibberellin is present, it binds to its receptor GID1. The DELLA–GID1–gibberellin complex is then tagged with ubiquitin and degraded by the proteasome. This releases PIF to bind DNA and activate transcription, lifting the repression — but this lifting mechanism is not what the question asks about.
Key Takeaways
- DELLA proteins repress transcription by binding to PIF transcription factors, not by binding DNA themselves.
- When PIF is sequestered by DELLA, PIF cannot bind the promoter.
- Without PIF on the promoter, RNA polymerase cannot bind and transcription does not occur.
- This is a classic example of a transcriptional repressor working by inhibiting an activator.
Common Mistakes
- Saying DELLA binds directly to DNA — it does not; it binds the transcription factor.
- Saying DELLA "stops translation" — DELLA affects transcription (mRNA synthesis), not translation (protein synthesis). This is one of the most common errors on this question.
- Confusing DELLA with the gibberellin receptor (GID1) or with gibberellin itself.
- Skipping the RNA polymerase step — the mark scheme specifically credits "RNA polymerase cannot bind to promoter", so this step must appear in the answer.
Things to Be Careful About
- Transcription = making mRNA from DNA. Translation = making protein from mRNA. Do not confuse them.
- The order of events matters: PIF is blocked from binding DNA BEFORE RNA polymerase can bind.
- DELLA acts in the absence of active gibberellin. When gibberellin is present, DELLA is degraded and repression is lifted — so DELLA repression and gibberellin activation are two sides of the same control switch.
The gene BRCA1 is expressed in breast tissue and in several other tissues of the body. BRCA1 codes for a tumour suppressor protein. This protein is involved in either repairing damaged DNA, or in triggering the death of a cell if DNA cannot be repaired.
Some mutations in BRCA1 are associated with an increased risk of developing breast cancer.
State one reason why a doctor would recommend that a person has genetic testing for a mutation in the gene BRCA1 and explain why this mutation would put the person at a greater risk of breast cancer.
Answer
Reason: family history of, breast / ovarian, cancer.
Explanation (any three of the following):
- (Mutation causes a) change in the primary structure of the tumour suppressor protein.
- This changes the folding / bonding / 3-D (tertiary) structure of the protein.
- A non-functional (tumour suppressor) protein is produced.
- DNA is not repaired / cells with damaged DNA do not die.
- The number of mutations increases / mutations accumulate.
- (Some mutations) cause uncontrollable cell division / mitosis of breast cells (so a tumour forms).
Family history of breast/ovarian cancer; mutation alters primary structure → alters tertiary structure → non-functional tumour suppressor protein → DNA not repaired / damaged cells do not die → mutations accumulate → uncontrolled mitosis of breast cells.
Background Concept
BRCA1 codes for a tumour-suppressor protein. Tumour-suppressor proteins normally stop a cell becoming cancerous in two ways: by repairing damage to its DNA, and by triggering apoptosis (programmed cell death) when the damage is too severe to repair. A mutation in BRCA1 is therefore a loss-of-function mutation — the protective protein either is not made or does not work. Because the cell can no longer police its own DNA, further mutations can build up unchecked, and a cell that should have died can keep dividing. The end result is uncontrolled mitosis in breast tissue and (because the gene is also expressed elsewhere) an increased risk of ovarian cancer.
Proteins only work when they are folded into a specific tertiary shape, which is held together by hydrogen bonds, ionic bonds, disulfide bridges and hydrophobic interactions between specific R groups. The shape is determined by the order of amino acids (the primary structure), which is set by the base sequence of the gene. A single-base change (a point mutation) can swap one amino acid for another, and if that amino acid is in a key position the protein can no longer fold correctly, losing its function.
Understanding the Question
The command word is "state … and explain". The candidate must (i) give a single clinical reason a doctor would offer for testing, and (ii) follow the cause-and-effect chain from the mutated gene to cancer. The mark scheme splits this into one mark for the reason and up to three marks drawn from a list of six creditable points in the explanation.
Approach
For the reason, the most common and accepted answer is a family history of breast or ovarian cancer, because the mutation is heritable (autosomal dominant) and the cancers cluster in families. For the explanation, walk down the chain in this order so that each point follows logically from the one before:
- The mutation changes the base sequence → primary structure of the protein.
- The wrong R groups disrupt folding → tertiary (3-D) shape changes.
- The protein becomes non-functional.
- Without a working tumour suppressor, DNA damage is not repaired and damaged cells are not killed.
- Mutations accumulate over time.
- Some of those further mutations affect proto-oncogenes / tumour-suppressor genes controlling the cell cycle, so breast cells undergo uncontrolled mitosis → cancer.
Step-by-Step Reasoning
Mark 1 — reason for testing. BRCA1 mutations are heritable (autosomal dominant). If a close relative — mother, sister, aunt — has had breast or ovarian cancer, the patient's own risk of carrying the mutation is increased, so a positive test would change the screening and preventive options offered.
Marks 2–4 — explanation. Pick any three from the list:
- "Change in the primary structure" — this is the direct effect of the base change; a codon now codes for a different amino acid.
- "Change in the folding / 3-D / tertiary structure" — the new R groups cannot form the original bonds, so the protein misfolds.
- "Non-functional protein" — the consequence of misfolding; this is the key biological point.
- "DNA is not repaired / cells with damaged DNA do not die" — the two cellular jobs of BRCA1 are lost.
- "Mutations accumulate" — because there is no DNA repair and no apoptosis of badly damaged cells.
- "Uncontrollable cell division / mitosis of breast cells" — the proximate cause of a tumour.
A short narrative that joins three of these points will earn the marks. There is no need to write all six; any three accepted points score the three explanation marks.
Key Takeaways
- BRCA1 mutations are loss-of-function mutations in a tumour-suppressor gene; loss of function removes DNA-repair and apoptosis checkpoints.
- The clinical reason to test is a relevant family history, because the mutation is inherited in an autosomal-dominant pattern.
- A protein's function depends on its tertiary structure, which is set by its primary structure, which is set by the gene's base sequence — so a point mutation can abolish function.
Common Mistakes
- Vague answers such as "because it runs in the family" (without naming breast / ovarian cancer).
- Jumping straight to "mutations accumulate" without explaining why they accumulate (because the tumour suppressor is non-functional).
- Saying "the gene causes cancer" rather than the protein, or saying "the cell mutates" rather than the DNA mutates.
- Confusing the role of BRCA1 with that of an oncogene — BRCA1 is a tumour suppressor, not a cancer-promoting gene.
Things to Be Careful About
- The mark scheme is explicit that "change in primary structure" and "change in tertiary structure" are two separate marks, so be careful to state both if you need both.
- "DNA is not repaired" is the first cellular consequence; "mutations accumulate" is the second. Mark scheme awards marks for either or both.
- The end of the chain — uncontrolled mitosis — must refer specifically to breast (or ovarian) cells, because the gene is only expressed in those tissues and the cancer risk is tissue-specific.
DNA sequencing is one method used to test for mutations in BRCA1. Before DNA sequencing occurs, the DNA sample goes through the polymerase chain reaction (PCR).
Suggest why PCR is used for testing for mutations in BRCA1.
Answer
- Only a small amount of DNA is available (from the patient sample).
- PCR amplifies the DNA / BRCA1 gene so there is enough to sequence and test for mutations.
PCR amplifies the very small quantity of DNA available from the patient, producing enough BRCA1 copies to be sequenced.
Background Concept
Polymerase chain reaction (PCR) is a way of making many millions of copies of a specific DNA sequence in vitro. The reaction needs: a DNA template, two short primers that flank the region of interest, a thermostable DNA polymerase (Taq polymerase), and a supply of the four deoxyribonucleotide triphosphates (dNTPs). Each cycle of denaturation, annealing and extension doubles the number of target DNA molecules, so 30 cycles produce approximately copies.
DNA sequencing, by contrast, needs a relatively large amount of pure, single-stranded DNA of known sequence at the region of interest. A clinical sample (a cheek swab, a blood sample) yields only nanograms of DNA, and the BRCA1 gene makes up only a tiny fraction of that.
Understanding the Question
The command word is "suggest why", which means the answer should explain the practical reason PCR is run before sequencing in this test. The mark scheme gives two complementary creditable points: the size of the starting sample, and the purpose of the step (amplification).
Approach
State that the clinical sample is small, then state that PCR makes many copies of the target sequence. That is the whole logic — the test cannot proceed without enough DNA to read.
Step-by-Step Reasoning
Mark 1. "Only a small amount of DNA is available" — the mark scheme explicitly accepts "small amount of DNA" or, by alternative wording (A), "gene". A blood sample or saliva sample contains only a few micrograms of total DNA, of which BRCA1 is a tiny fraction.
Mark 2. "Amplify, DNA / (BRCA1) gene" — the function of PCR. After amplification there is enough identical DNA for the sequencer to read the order of bases, and therefore to spot any mutation.
Key Takeaways
- PCR's role in diagnostic testing is to convert a tiny clinical sample into a usable quantity of a specific sequence.
- Without PCR, the DNA available would be too little for a sequencer to read reliably.
Common Mistakes
- Writing vaguely that PCR "makes more DNA" without explaining why more DNA is needed (i.e. the starting amount is too small to sequence).
- Describing the stages of PCR (denaturation, annealing, extension) — the question asks why it is used, not how it works.
- Saying PCR "finds the mutation" — it does not; sequencing (or another detection method) does. PCR only copies the DNA so the mutation can be detected.
Things to Be Careful About
- The mark scheme will accept "amplify the gene" as well as "amplify the DNA" — both score.
- Do not describe the components of the PCR mixture in detail; the question is not about the method itself.
Genetic screening shows that in the UK:
- 1 in 400 females have a mutated allele of BRCA1
- 70% of females with a mutated allele of BRCA1 will develop breast cancer by the time they are 80 years old.
In 2022, the population of females in the UK was .
Calculate the number of females in the UK population in 2022 who it is estimated will develop breast cancer by the age of 80 years old. Give your answer in standard form.
Show your working.
number of females = ______
Working
Number of females with the mutated allele:
Of these, 70 % will develop breast cancer by age 80:
Answer
(allow for full marks)
6.1 × 10^4
Background Concept
This is a population-frequency calculation of the type CIE sets regularly under the heading "mathematical requirements". Two pieces of information are given: a frequency of the mutation in the population (1 in 400 females) and a conditional probability of developing the disease, given the genotype (70 %). The two must be combined by multiplication, after first converting the "1 in 400" statement into a count of people.
Standard form expresses a number as where and is an integer. The final answer should be quoted in standard form because the population is large.
Understanding the Question
The question gives three numbers — the total female population (), the carrier frequency (1/400), and the probability of developing cancer given carrier status (70 %) — and asks for an estimated count in standard form, with working shown.
Approach
- Step 1: divide the total female population by 400 to estimate the number of females with at least one mutated BRCA1 allele.
- Step 2: multiply that count by 0.70 to estimate the number of those who will develop breast cancer by age 80.
- Step 3: write the result in standard form.
Step-by-Step Reasoning
Step 1 — number of females with the mutated allele.
So 87 500 females are estimated to carry a mutated BRCA1 allele.
Step 2 — 70 % of those will develop breast cancer by age 80.
Step 3 — standard form. The mantissa 6.125 already lies in , so the answer in standard form is . The mark scheme accepts rounding to for full credit, with (i.e. not in standard form) scoring one mark, and a correct or at step 1 also scoring one mark.
Key Takeaways
- "1 in 400" must be applied as a division of the total, not as a multiplication.
- Percentages are applied as a multiplication by the decimal form (70 % = 0.70).
- Standard form requires the mantissa to be in ; convert by shifting the decimal point and changing the power of ten.
Common Mistakes
- Multiplying by 400 instead of dividing (treating "1 in 400" as a multiplication factor).
- Forgetting to convert 70 % to 0.70, so leaving the answer as .
- Writing the final answer as 61 250 without converting to standard form — this still gets one mark but loses the standard-form mark.
- Carrying too few significant figures (e.g. quoting ) and losing the second mark.
Things to Be Careful About
- Show every step of the working; the mark scheme awards one mark for reaching (or ) even if the second step is wrong, via error-carried-forward.
- The final answer must be in standard form, written as (or for two marks).
One advantage of genetic screening is to determine which drugs should be selected to treat cancer.
A study was carried out on women with breast cancer who had been treated with a DNA-damaging drug that kills tumour cells.
The women had all been tested for BRCA1 mutations. One group had a BRCA1 mutation and the other group did not have a BRCA1 mutation.
The researchers used data to assess the probability of survival for the women in each group of the study after treatment with the drug.
Fig. 5.1 shows the probability of survival for a time period of up to 180 months.
The researchers suggested the hypothesis that the DNA-damaging drug is more effective in women with a BRCA1 mutation.
Discuss whether the results in Fig. 5.1 support the hypothesis suggested by the researchers.
Answer
Supports the hypothesis:
- Women with the BRCA1 mutation have a higher probability of survival than those without the mutation at every time point.
- The probability of survival decreases less steeply for women with the BRCA1 mutation, so the gap between the two groups widens with time.
- Data quote: at 180 months, the survival probability is ~0.70 for the BRCA1 mutation group but only ~0.47 for the group with no mutation.
- The study ran for 15 years (180 months), giving a long follow-up period.
Does not support the hypothesis:
- No statistical test was carried out, so the difference between the two groups may not be significant; the sample sizes are not stated.
The graph supports the hypothesis: the BRCA1 mutation group has a consistently higher probability of survival (e.g. ~0.70 vs ~0.47 at 180 months) and the gap widens over time, although the lack of a statistical test and unstated sample sizes are weaknesses.
Background Concept
Survival curves plot the probability that a subject is still alive at each time point after a treatment. A curve that stays high (close to 1.0) means most subjects are still alive; a curve that drops quickly means many have died. Comparing two curves tells you which group is doing better after the same treatment.
A useful rule for evaluating a hypothesis from a graph: look at (1) the direction of the difference (is the hypothesised group higher or lower?), (2) the magnitude (how big is the gap?), and (3) the duration (does the difference persist for the whole follow-up?). A common weakness in many biology studies is the absence of a statistical test such as a log-rank test for survival data, which would tell you whether the difference is significant or could have arisen by chance.
Understanding the Question
Part (d) gives a hypothesis from the researchers — that the DNA-damaging drug is more effective in women with a BRCA1 mutation — and a survival graph for two cohorts. The command word is "discuss", which means the candidate should make judgements both for and against the hypothesis, supporting points with evidence read off the graph where possible. The mark scheme credits up to two points drawn from a list that includes both supporting and limiting evidence.
Approach
Read the graph and identify:
- which curve is higher at any given time;
- how the gap between the curves changes with time;
- a numerical comparison at a specific time point;
- any limitation of the data (e.g. absence of a statistical test or sample size).
Step-by-Step Reasoning
Supporting evidence:
- The BRCA1 mutation curve is above the no-mutation curve at every time point, so women with the mutation have a higher probability of survival.
- The gap between the two curves widens with time: by 180 months the mutation group is at ~0.70 while the no-mutation group has fallen to ~0.47. This pattern is exactly what the hypothesis predicts — the drug is more effective in the mutation group, so they keep living while the non-mutation group continues to die.
- The follow-up is 15 years (180 months), which is long enough for a meaningful comparison in breast cancer.
Limiting evidence:
- The graph is just a description of the two groups. Without a statistical test (e.g. a log-rank test, a chi-squared test on the numbers surviving at 180 months) and without knowing the sample sizes, the difference cannot be confirmed as significant rather than a chance result of small numbers.
Two creditable points — a comparison of the curves, a data quote, and/or a study limitation — score the two marks.
Key Takeaways
- Reading a survival curve: look at the y-values at a given x, and at how the curves diverge or converge over time.
- A numerical data quote (with units) is much stronger support than a vague "the curve is higher".
- "Discuss" questions almost always expect both supporting and limiting evidence, with the limitation often being the lack of a statistical test.
Common Mistakes
- Vague claims such as "the drug works better" without quoting a specific value from the graph.
- Forgetting the negative side of the discussion — a "discuss" answer that only supports the hypothesis cannot earn the second mark if the mark scheme expects a limitation.
- Misreading the graph — the BRCA1 mutation group is the higher curve, because the drug (which damages DNA) is more lethal to tumour cells that already have a faulty DNA-repair pathway, so their tumour cells die and the woman lives longer.
- Quoting figures without units (months).
Things to Be Careful About
- The mark scheme accepts values within a small range, so a quote such as "at 180 months, ~0.70 compared with ~0.47" scores even though the precise values on the grid are slightly different.
- The y-axis is probability of survival, not percentage — but the mark scheme accepts both, because probability 0.70 is the same as 70 %.
- "No statistical test carried out" and "sample size not stated" are alternative ways of saying the same limitation; either scores one mark.
Fig. 6.1 is a diagram of part of a mitochondrion.
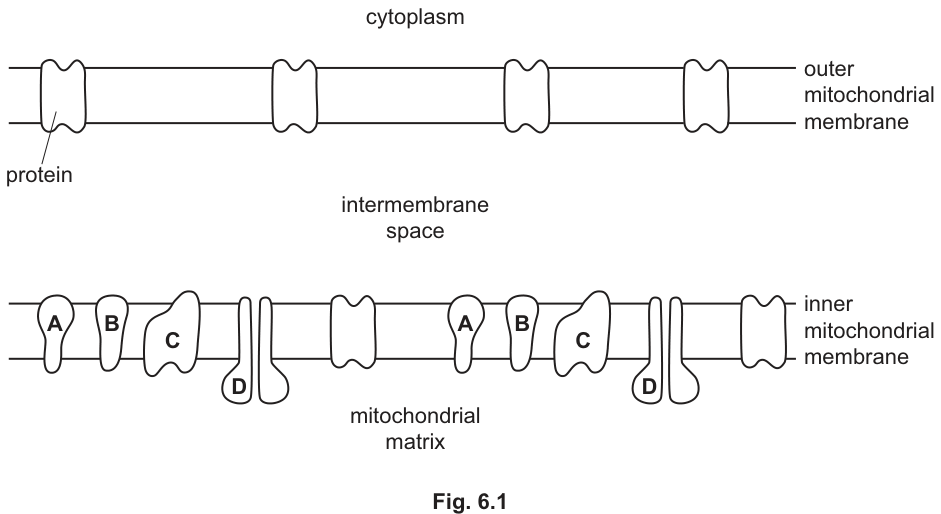
On Fig. 6.1, use arrows to show the route taken by oxygen from the cytoplasm into the mitochondrial matrix.
Answer
Draw two arrows on Fig. 6.1 to show the route taken by oxygen from the cytoplasm into the mitochondrial matrix:
- An arrow from the cytoplasm, passing through the phospholipid bilayer of the outer mitochondrial membrane (NOT through any channel protein), into the intermembrane space.
- A second arrow from the intermembrane space, passing through the phospholipid bilayer of the inner mitochondrial membrane (NOT through proteins A, B, C or D), into the mitochondrial matrix.
Two arrows drawn on Fig. 6.1: one through the phospholipid bilayer of the outer membrane, one through the phospholipid bilayer of the inner membrane (NOT through any protein).
Background Concept
A mitochondrion has a double membrane: a smooth outer membrane and a highly folded inner membrane (folded into cristae to give a large surface area). The inner membrane is unusually rich in protein and almost impermeable to most ions and small polar molecules; it is crossed only via specific transport proteins. Between the two membranes is the intermembrane space, and enclosed by the inner membrane is the matrix, where the Krebs cycle takes place.
Membrane permeability depends on the nature of the molecule. Small, non-polar molecules such as , and steroid hormones pass through membranes freely by simple diffusion, dissolving in and crossing the phospholipid bilayer directly. They do NOT need protein channels or carriers, and the cell cannot regulate their movement. By contrast, polar molecules and ions (e.g. , glucose, , ) cannot cross the phospholipid bilayer unaided and must move through specific transport proteins (by facilitated diffusion or active transport).
Oxygen is required in the matrix because it is the final electron acceptor of the electron transport chain (ETC) at the inner mitochondrial membrane, where it is reduced to water. It must therefore diffuse from the cytoplasm, across both mitochondrial membranes, into the matrix.
Understanding the Question
Fig. 6.1 is a schematic cross-section of part of a mitochondrion, with proteins A, B and C (ETC components) and D (ATP synthase) embedded in the inner membrane, plus channel proteins in the outer membrane. The question asks the candidate to use arrows to show the route takes from the cytoplasm to the matrix. The mark scheme explicitly REJECTS arrows drawn through any protein (channel proteins, A, B, C or D), so the test is essentially: do you know that crosses membranes through the phospholipid bilayer and not through proteins?
Approach
Identify the two membranes must cross (outer and inner), remember that is small and non-polar, and decide which part of each membrane the arrow should pass through: through the phospholipid bilayer (the gap between the protein complexes), not through any of the labelled or unlabelled proteins shown.
Step-by-Step Reasoning
- is needed in the matrix because it is the terminal electron acceptor of oxidative phosphorylation. The matrix is enclosed by the inner mitochondrial membrane; to reach it from the cytoplasm, must cross both the outer and the inner mitochondrial membranes.
- Because is a small, non-polar molecule, it crosses biological membranes by simple diffusion directly through the phospholipid bilayer. It does not use transport proteins.
- Therefore the arrow through the outer membrane must pass through the phospholipid layer (the lipid bilayer drawn in the figure), not through any of the channel proteins embedded in it.
- Similarly, the arrow through the inner membrane must pass through the phospholipid layer between protein complexes A, B, C and D, not through any of those proteins.
- The route is: cytoplasm → (through outer-membrane phospholipid layer) → intermembrane space → (through inner-membrane phospholipid layer) → mitochondrial matrix.
Key Takeaways
- The phospholipid bilayer is permeable to small, non-polar molecules (, ) and impermeable to ions and most polar molecules.
- The ETC and ATP synthase are embedded in the inner mitochondrial membrane and participate in oxidative phosphorylation, NOT in moving into the matrix.
- Mark-scheme trap: arrows drawn through the proteins shown will not earn the mark, even if the route is correct.
Common Mistakes
- Drawing arrows through the channel proteins of the outer membrane or through proteins A, B, C or D of the inner membrane. The mark scheme rejects this. The mistake shows a failure to understand that is small and non-polar and crosses the bilayer directly.
- Drawing only one arrow (e.g. only across the outer membrane). Both membranes must be crossed.
- Drawing the arrow ending in the intermembrane space rather than in the matrix.
Things to Be Careful About
- The mark scheme is precise: arrows must pass through the phospholipid layers, not through proteins.
- Although is consumed at the ETC, the figure here asks for the route taken to GET to the matrix; the candidate is not asked to show where is used.
- Read the wording: the final arrow tip should be in the matrix.
Identify protein D and the group of proteins represented by A, B and C and describe their roles in oxidative phosphorylation.
Answer
D = ATP synthase / ATP synthetase (R: ATPase)
A, B and C = electron transport chain (ETC) / electron carriers / electron acceptors
Role of the ETC proteins (A, B and C):
- Electrons travel along the ETC.
- Energy is released as electrons pass along the chain.
- This energy is used to pump / actively transport / protons into the intermembrane space.
- This increases the concentration of in the intermembrane space, creating a proton gradient.
Role of protein D (ATP synthase):
5. / protons diffuse through ATP synthase from the intermembrane space to the matrix.
6. ATP is synthesised from ADP and Pi.
7. This process is called chemiosmosis.
D = ATP synthase; A, B, C = electron transport chain (electron carriers); the ETC releases energy to pump H+ into the intermembrane space creating a proton gradient; H+ diffuses back through ATP synthase to the matrix, driving ATP synthesis from ADP + Pi (chemiosmosis).
Background Concept
Aerobic respiration produces most of the cell's ATP in the mitochondrion. After glycolysis in the cytoplasm and the link reaction and Krebs cycle in the matrix, the reduced coenzymes NADH and FADH2 carry high-energy electrons to the inner mitochondrial membrane. There, the electron transport chain (ETC), a series of protein complexes and electron carriers embedded in the inner membrane, uses the energy from these electrons to pump protons () from the matrix into the intermembrane space. This creates an electrochemical gradient (a much higher concentration in the intermembrane space than in the matrix) — the proton-motive force.
The protons can flow back down their electrochemical gradient only through ATP synthase (also called ATP synthetase), a large stalked protein complex embedded in the inner membrane. As protons flow through ATP synthase, the potential energy they release drives the phosphorylation of ADP + Pi to form ATP. This coupling of electron transport (which builds the gradient) to ATP synthesis (which uses the gradient) is called chemiosmosis (proposed by Peter Mitchell in 1961), and it is the major source of ATP in aerobic cells. About 2.5 ATP are made per NADH and 1.5 ATP per FADH2 by this mechanism.
Understanding the Question
Part (b) is worth 7 marks. It asks two things:
- Identify protein D and the group of proteins A, B, C (1 mark each).
- Describe the roles of these proteins in oxidative phosphorylation (up to 5 further marks).
The mark scheme rewards the role of ETC proteins (electrons travel along the chain, energy released, pumped into intermembrane space, proton gradient created) and the role of ATP synthase ( diffuse through, ATP made from ADP + Pi, term 'chemiosmosis' used). Both halves must be clearly described to earn full marks.
Approach
Name D and A/B/C first, then separate the description into two halves — what the ETC does, then what ATP synthase does. The proton gradient is the bridge between the two halves. End by naming the process 'chemiosmosis'.
Step-by-Step Reasoning
- Identification of D: D is ATP synthase (or ATP synthetase). The mark scheme REJECTS 'ATPase' because ATPase suggests an enzyme that breaks down ATP, while ATP synthase synthesises ATP. The stalked particles seen in electron micrographs of mitochondrial inner membranes are ATP synthase.
- Identification of A, B, C: These are the electron transport chain (ETC) — a series of electron carriers, including cytochromes, that pass electrons from one to the next.
- Electrons travel along the ETC: Electrons from reduced NAD (NADH) and reduced FAD (FADH2) enter the chain and pass from carrier to carrier. (In real mitochondria, NADH donates electrons to complex I, FADH2 to complex II, and they converge on coenzyme Q then travel through complexes III and IV to oxygen.)
- Energy is released: As electrons fall to lower and lower energy levels along the chain, energy is released at each step.
- Energy used to pump into the intermembrane space: This energy is harnessed by the ETC complexes to actively transport (protons) from the matrix across the inner membrane into the intermembrane space, against the concentration gradient.
- A proton gradient is created: The concentration in the intermembrane space becomes much higher than in the matrix. This electrochemical gradient stores potential energy — the proton-motive force.
- Protons diffuse through ATP synthase (D): flows back down its electrochemical gradient, from the intermembrane space to the matrix, but only through ATP synthase — the inner membrane is otherwise impermeable to .
- ATP synthesis: As protons flow through ATP synthase, the energy released drives the combination of ADP + Pi to make ATP ().
- Chemiosmosis: This whole process — electron transport building a proton gradient, and the gradient driving ATP synthesis — is called chemiosmosis.
Key Takeaways
- ATP synthase is the enzyme that MAKES ATP, not the one that breaks it down; the mark scheme rejects 'ATPase'.
- The ETC and ATP synthase are linked by the proton gradient: the ETC creates it, ATP synthase uses it.
- Chemiosmosis is the term for the coupling of electron transport, the proton gradient, and ATP synthesis.
- The inner mitochondrial membrane is otherwise impermeable to ; this is what makes the gradient possible.
Common Mistakes
- Calling D 'ATPase' rather than 'ATP synthase'. The mark scheme explicitly rejects this.
- Stating that the ETC makes ATP. It does not. ATP is made by ATP synthase, using the gradient the ETC has built.
- Saying is 'pumped out of the mitochondrion'. It is pumped from the matrix to the INTERMEMBRANE SPACE, not out of the organelle. The intermembrane space is still inside the mitochondrion.
- Confusing the direction of flow. ETC proteins pump OUT of the matrix; ATP synthase allows to flow IN to the matrix.
- Forgetting to name the process 'chemiosmosis' — this is a specific mark.
- Saying 'electrons' travel through ATP synthase. It is PROTONS () that flow through ATP synthase, not electrons. Electrons are already on oxygen by the time ATP is made.
Things to Be Careful About
- The mark scheme requires 'ATP synthase' or 'ATP synthetase', not 'ATPase'.
- Use '' or 'protons' consistently; 'hydrogen ions' is also accepted but 'hydrogen' alone is not specific enough.
- The proton gradient is across the INNER mitochondrial membrane, between the intermembrane space and the matrix.
- Each of the five ETC points (electrons travel, energy released, pumped, gradient created) is a separate mark; one sweeping sentence will not earn all five.
The matrix of a mitochondrion contains small circular DNA. In the cells of humans, the mitochondria have circular DNA that contains 37 genes.
Suggest functions for these mitochondrial genes.
Answer
Possible functions of the 37 mitochondrial genes:
- Coding for enzymes of the Krebs cycle and the link reaction (e.g. citrate synthase, isocitrate dehydrogenase, subunits of pyruvate dehydrogenase).
- Coding for electron transport chain proteins / cytochromes / electron carriers / electron acceptors (i.e. proteins A, B, C).
- Coding for ATP synthase (i.e. protein D).
- Coding for membrane / channel / transport / carrier / structural proteins of the mitochondrial membranes.
- Producing tRNA, rRNA and ribosomes (so that the mitochondrion can carry out its own protein synthesis).
Mitochondrial genes code for Krebs cycle / link-reaction enzymes, ETC proteins (cytochromes), ATP synthase, membrane/transport proteins, and tRNA/rRNA/ribosomes for mitochondrial protein synthesis.
Background Concept
Mitochondria are unusual organelles: they contain their own circular DNA (mtDNA) and their own ribosomes, and they can carry out protein synthesis. The most widely accepted explanation is the endosymbiotic theory, which proposes that mitochondria evolved from aerobic bacteria that were engulfed by an ancestral eukaryotic cell. The 37 human mitochondrial genes are thought to be the remnant of the genome of that original bacterial endosymbiont. The vast majority of mitochondrial proteins (>1000) are, however, encoded by the nuclear genome, synthesised on cytoplasmic ribosomes and imported into the mitochondrion; only 13 are encoded by mtDNA itself in humans.
Mitochondria need proteins for: aerobic respiration (Krebs cycle enzymes, ETC proteins, ATP synthase), membrane transport (since the inner membrane is highly selective), their own protein synthesis (rRNA, tRNA, ribosomal proteins), and structural roles. Anything encoded by mtDNA must therefore be a protein or RNA that operates in the mitochondrion itself.
Understanding the Question
Part (c) is a 3-mark 'suggest' question. It does not require the candidate to know the exact 13 protein-coding genes, but to use understanding of mitochondrial function to suggest what the 37 genes might do. The mark scheme gives a list of acceptable points.
Approach
Think about everything the mitochondrion needs to do or to make: carry out the link reaction, Krebs cycle and oxidative phosphorylation; build and maintain its own membranes; make its own ribosomes and tRNA so it can translate its own proteins.
Step-by-Step Reasoning
- Enzymes of the Krebs cycle and link reaction: Mitochondria must carry out both stages in the matrix, so they need enzymes such as pyruvate dehydrogenase (link reaction), citrate synthase, isocitrate dehydrogenase, -ketoglutarate dehydrogenase and others. Some of these are encoded by mtDNA. (In humans, subunits of complexes I, III, IV, V and pyruvate dehydrogenase are among the 13 mtDNA-encoded proteins.)
- ETC proteins (A, B, C): The electron transport chain consists of cytochromes and other electron carriers. These are partly encoded by mtDNA.
- ATP synthase (D): The stalked particles are partly encoded by mtDNA (subunits of the F0 and F1 parts).
- Membrane / transport / structural proteins: The outer and inner membranes and cristae require structural proteins and various transporters to move substrates, ADP, Pi, ATP, and to maintain the proton gradient.
- tRNA, rRNA and ribosomes: Mitochondria have their own ribosomes (70S, similar to bacterial) and need tRNAs to translate their own mRNA. Of the 37 human mitochondrial genes, 22 encode tRNAs and 2 encode rRNAs; the remaining 13 encode proteins.
Key Takeaways
- Mitochondrial DNA encodes both RNAs (tRNA, rRNA) and a small number of proteins.
- The proteins encoded are key subunits of the respiratory machinery, especially components of oxidative phosphorylation.
- Mitochondrial ribosomes are 70S (like bacterial), supporting the endosymbiotic origin.
- The 13 protein-coding genes of human mtDNA encode subunits of complexes I, III, IV and V of the ETC, plus a few other proteins.
Common Mistakes
- Stating that mitochondrial DNA is linear. It is CIRCULAR, like bacterial DNA — a key piece of evidence for the endosymbiotic theory.
- Stating that mitochondria 'do not need the nucleus' for any of their proteins. In fact, most mitochondrial proteins are encoded by nuclear DNA and imported; mtDNA only encodes a small minority.
- Suggesting mtDNA controls traits inherited from the father. Mitochondrial DNA is inherited almost exclusively from the mother (maternal inheritance) because the egg contributes essentially all the mitochondria to the zygote.
- Listing things like 'energy production' or 'ATP synthesis' as functions of the genes. Genes do not make ATP; they code for the proteins and RNAs that enable ATP synthesis.
- Confusing '37 genes' with '37 proteins'. There are 37 genes in total: 13 protein-coding + 22 tRNA + 2 rRNA.
Things to Be Careful About
- The question asks for functions of the genes (what they do), not functions of the mitochondrion as a whole.
- 'Suggest' questions accept a range of valid answers. Any of the five points in the mark scheme would earn a mark; the candidate only needs to give three.
- Avoid vague answers ('they make the mitochondrion work', 'they produce energy'). Be specific: name the type of protein (enzyme, carrier, ribosome component) or RNA.
A student investigated the effect of temperature on the rate of photosynthesis at two different light intensities. The rate of photosynthesis was determined by measuring the rate of oxygen production of the plant.
Fig. 7.1 shows the result of the investigation.
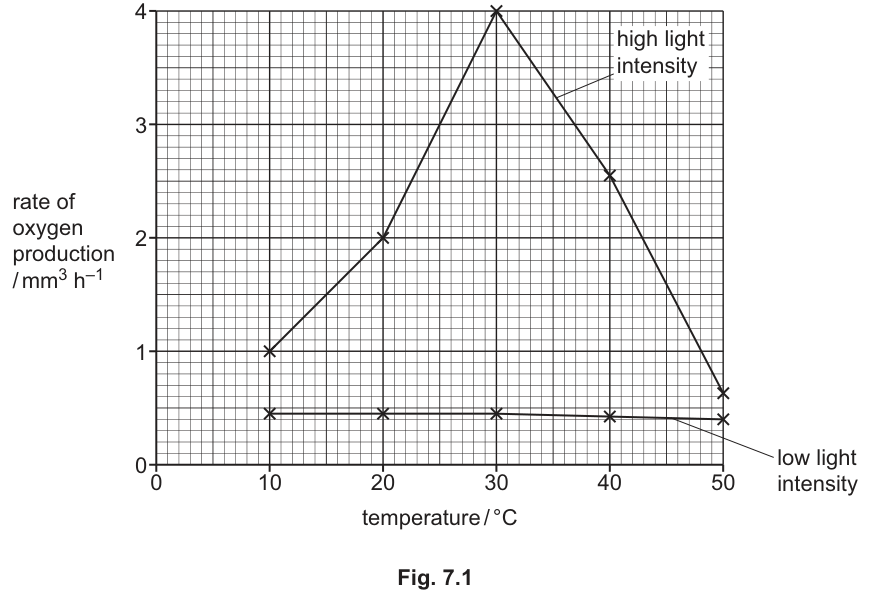
With reference to Fig. 7.1, describe and explain the results of the investigation for the plant in low light intensity.
Answer
- The rate of oxygen production is low and remains approximately constant across the whole temperature range (10–50 °C).
- Light intensity is the limiting factor.
- Therefore, little light energy is absorbed, so the light-dependent reactions (photolysis of water and photophosphorylation) occur at a low rate.
See working
Background Concept
Photosynthesis is the conversion of light energy into chemical energy. The overall rate is set by whichever factor is in shortest supply – the limiting factor. The three principal limiting factors are light intensity, carbon dioxide concentration and temperature: light intensity governs the light-dependent reactions on the thylakoid membranes, CO₂ concentration governs the Calvin cycle in the stroma, and temperature governs enzyme-catalysed steps in both stages. Oxygen is released as a by-product of the photolysis of water, so the rate of oxygen production is a direct measure of the light-dependent reactions.
Understanding the Question
The student measured oxygen production at temperatures from 10 °C to 50 °C under two different light intensities. We are asked to describe and explain the low light intensity curve, which is essentially flat (around 0.4 mm³ h⁻¹) across the whole range.
Approach
For 'describe and explain' on a graph, give (1) the trend, (2) the cause (the limiting factor), and (3) the link to the specific biochemical step that is being slowed.
Step-by-Step Reasoning
- Describe the trend: the rate of oxygen production is low and remains approximately constant between 10 °C and 50 °C. There is no rise with increasing temperature and no fall above an optimum.
- State the limiting factor: because changing temperature makes no difference, temperature is not the limiting factor. The variable held at a low value is light intensity, so light intensity must be the limiting factor.
- Link to the mechanism: with little light available, only a small amount of light energy is absorbed by photosystems I and II. The light-dependent reactions (photolysis of water, electron transport and photophosphorylation) can therefore only proceed slowly. Less photolysis of water means less O₂ is released, so the measured rate of oxygen production stays low and unchanged.
Key Takeaways
- A flat curve on a rate vs factor graph means the variable being changed is NOT the limiting factor.
- Oxygen production rate is a direct measure of the light-dependent reactions, specifically photolysis of water.
- Light intensity governs the light-dependent reactions; CO₂ concentration governs the Calvin cycle; temperature governs enzyme-controlled steps.
Common Mistakes
- Stating that 'no light is absorbed' at low light intensity – the mark scheme explicitly REJECTS this; low light intensity still allows some light to be absorbed, just less.
- Saying 'photosynthesis is constant' instead of 'rate of oxygen production' – the variable being measured is oxygen production, not photosynthesis in general.
- Confusing the limiting factor: if temperature changes don't affect the rate, the limiting factor is the variable that was kept constant (here, the lower light intensity).
Things to Be Careful About
- Read the question carefully – 'low light intensity' refers to the bottom curve, not the top one.
- Use the precise term 'light-dependent reactions' rather than vague language like 'the light reactions happen slowly'.
- Do not credit the description 'photosynthesis is constant' – it is the RATE OF OXYGEN PRODUCTION that is constant.
With reference to Fig. 7.1, describe and explain the results of the investigation for the plant in high light intensity above 30 °C.
Answer
- The rate of oxygen production decreases as the temperature rises above 30 °C.
- For example: at 30 °C, at 40 °C, and at 50 °C.
- This is because the enzymes (e.g. ATP synthase, NADP reductase, oxygen-evolving complex) catalysing the light-dependent reactions are denatured at high temperature.
- The active site changes shape, so fewer enzyme–substrate complexes form and the rate falls.
See working
Background Concept
Enzymes are proteins whose catalytic activity depends on the precise three-dimensional shape of their active site. As temperature rises, kinetic energy increases and the rate of enzyme-catalysed reactions increases (typical Q₁₀ ≈ 2). Above a certain temperature, however, the hydrogen bonds and other weak interactions that hold the enzyme in shape begin to break. The active site loses its specific shape and can no longer bind substrate – the enzyme is denatured, usually irreversibly.
In photosynthesis, several temperature-sensitive proteins drive the fall in rate above the optimum. These include ATP synthase (in the thylakoid membrane), NADP reductase, the oxygen-evolving complex of photosystem II and, in the Calvin cycle, rubisco. Their denaturation explains the sharp fall in rate above about 30–40 °C.
Understanding the Question
We are asked to describe and explain what happens on the high-light-intensity curve ABOVE 30 °C. The graph shows a peak at 30 °C followed by a steep fall.
Approach
For a 'describe and explain' worth 3 marks, give (1) the trend, (2) two paired data quotes with units, and (3) the mechanistic explanation. The mark scheme offers four creditable points and awards any three, so giving all four is the safest strategy.
Step-by-Step Reasoning
- Describe the trend: above 30 °C the rate of oxygen production decreases (sharply) as temperature rises.
- Data quotes with units:
- At 30 °C:
- At 40 °C:
- At 50 °C:
(the mark scheme accepts 0.62–0.65 at 50 °C; the data are paired because they show the fall in rate as temperature rises.)
- Mechanism – enzyme denaturation: photosynthesis depends on enzymes and enzyme-like complexes. Above ~30–40 °C, the hydrogen bonds holding the tertiary structure of these proteins break, the active site changes shape, and the protein can no longer bind its substrate. The rate of the light-dependent reactions (and therefore the rate of O₂ production from photolysis of water) falls steeply.
- Consequence – fewer enzyme–substrate complexes: once the active site is altered, substrate binding is reduced. Fewer enzyme–substrate complexes form per unit time, and the rate of product formation drops.
Key Takeaways
- A rate vs temperature graph for a biological process shows a peak at an optimum and falls sharply above it because enzymes denature.
- The 'paired data quote' technique is the standard way to earn the data mark on a 'describe' question – read two specific values from the curve, on either side of the change you are describing.
- ATP synthase, NADP reductase and the oxygen-evolving complex of PSII are all temperature-sensitive, as is rubisco in the Calvin cycle.
Common Mistakes
- Forgetting to include the UNITS with the data quotes – the mark scheme insists on units.
- Saying only 'the rate decreases because it is too hot' – the explanation must be at the level of enzyme denaturation and active-site shape.
- Citing the wrong cause – this is NOT a limiting factor of CO₂ or light; light is plentiful (high light intensity) and CO₂ is unchanged.
- Saying 'the enzymes are killed' – denatured is the correct term; enzymes are not alive.
- Saying the enzymes 'stop working' without explaining the structural change in the active site.
Things to Be Careful About
- The question asks about ABOVE 30 °C only – do not describe the rise from 10 °C to 30 °C.
- Read the y-axis carefully: 0 to 4, peak at 4.0 mm³ h⁻¹.
- The two data quotes should be 'paired' – one near the peak (e.g. 30 °C) and one further along (e.g. 50 °C) – to illustrate the size of the fall.
Answer
- Light is absorbed by photosystem II (P680), causing photoactivation (photoionisation) of chlorophyll.
- Photolysis of water occurs.
- This is catalysed by the water-splitting enzyme (oxygen-evolving complex) on the thylakoid membrane.
- Water splits into protons (H⁺), electrons (e⁻) and oxygen (O₂).
See working
Background Concept
The light-dependent reactions of photosynthesis take place on the thylakoid membranes and require two photosystems working in series: photosystem II (P680) and photosystem I (P700). In NON-CYCLIC photophosphorylation, electrons flow from water through PSII, the electron transport chain, PSI and finally to NADP⁺. The electrons lost from PSII are replaced by the splitting of water – this is the only step in photosynthesis that produces O₂.
Photolysis is the splitting of a molecule using light energy. In the thylakoid lumen, water is broken down by the oxygen-evolving complex (OEC, also called the water-splitting complex, WSC), which contains manganese ions that act catalytically. The reaction can be written:
The electrons replenish those lost by the reaction-centre chlorophyll of PSII; the protons contribute to the proton gradient that drives ATP synthesis by chemiosmosis; the oxygen is released as a by-product (or used in cellular respiration).
Understanding the Question
This is a 'describe' question worth 3 marks on the process by which oxygen is produced in non-cyclic photophosphorylation. We need to give the sequence: how light energy is captured, where the water-splitting happens, what catalyses it, and what the products are.
Approach
The mark scheme offers four creditable points; 'any three from' means the candidate needs three, but giving all four is safer. Cover in order: light capture → photolysis → enzyme catalysing it → products (with the equation as a valid alternative for the products point).
Step-by-Step Reasoning
- Light capture and photoactivation: light is absorbed by the reaction-centre chlorophyll of photosystem II (P680). The energy raises an electron to a higher energy level (photoactivation / photoionisation), leaving the chlorophyll positively charged and creating an electron 'hole' that must be filled.
- Photolysis of water: to refill this 'hole', water is split. This step is specifically called photolysis (literally 'splitting by light').
- Enzyme / complex involved: photolysis is catalysed by the water-splitting enzyme, also called the oxygen-evolving complex, located on the inner (lumenal) surface of the thylakoid membrane.
- Products: water splits into protons (H⁺), electrons (e⁻) and oxygen (O₂). The equation form is also acceptable: .
Key Takeaways
- Non-cyclic photophosphorylation involves BOTH photosystems and produces ATP, reduced NADP and O₂.
- The O₂ released in photosynthesis comes entirely from water (not from CO₂) – proven by isotope-labelling experiments with ¹⁸O.
- The water-splitting / oxygen-evolving complex is on the lumen side of the thylakoid membrane; the H⁺ it releases contributes to the proton gradient used by ATP synthase.
Common Mistakes
- Confusing PSII and PSI – PSII (P680) comes first in the non-cyclic pathway; light is absorbed there first.
- Writing 'photoionisation' without specifying that chlorophyll is the molecule being photoionised (or omitting 'photosystem II / P680').
- Saying 'water is broken down by light' without naming the enzyme / complex that catalyses it – the mark scheme credits the water-splitting enzyme / oxygen-evolving complex specifically.
- Writing 'water → hydrogen + oxygen' (atomic hydrogen) instead of 'protons, electrons and oxygen'.
- Confusing photophosphorylation (ATP synthesis driven by light) with the Calvin cycle (CO₂ fixation).
Things to Be Careful About
- 'Photolysis' must be the word used, not 'hydrolysis' or 'splitting' alone.
- Specify which photosystem – PSII (P680), not just 'chlorophyll'.
- 'Oxygen evolving complex' and 'water-splitting enzyme' are both accepted; use whichever you remember.
- The question asks specifically about how OXYGEN is produced – keep the answer focused on photolysis, not on the whole electron transport chain or ATP synthesis.
Fig. 8.1 is a diagram of a sensory neurone.
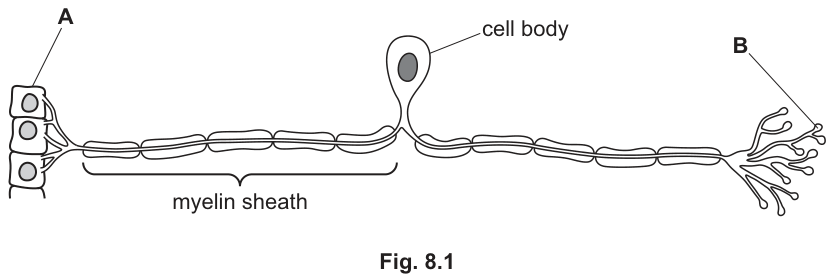
Answer
Receptor (cell).
receptor
Background Concept
A sensory neurone carries action potentials from a sensory receptor towards the central nervous system (CNS). At one end it is associated with a sensory receptor cell (e.g. a Pacinian corpuscle, a Meissner's corpuscle, or a bare sensory ending); at the other end it synapses inside the spinal cord or brain. In Fig. 8.1, structure A is drawn at the peripheral end of the sensory neurone, where the stimulus is detected — so A is a sensory receptor cell.
Understanding the Question
The question shows a sensory neurone (Fig. 8.1) with three labelled features: receptor cells at one end (A), the cell body branching off to one side, and synaptic endings at the other end (B). Part (i) asks specifically for the name of the cell type at A, which sits at the stimulus-receiving end of the pathway.
Approach
Recognise that A lies at the end of the neurone that is in contact with the external/internal environment, where a physical or chemical stimulus is converted into an electrical signal. The cell that performs this transduction is called a sensory receptor cell.
Step-by-Step Reasoning
- In a sensory pathway, the cell that detects the stimulus and generates the generator potential is the receptor.
- The receptor cell is found at the peripheral terminal of the sensory neurone (left-hand end in Fig. 8.1).
- The action potential then travels along the dendron/axon of the sensory neurone into the CNS.
Key Takeaways
A sensory receptor cell is the transducer of the nervous system — it converts a stimulus (light, pressure, chemical, temperature) into an electrical impulse in the sensory neurone.
Common Mistakes
Calling A a "nerve ending" or "dendrite" — these are not specific cell types. The mark scheme requires the term "receptor".
Things to Be Careful About
The cell at A is a separate receptor cell that synapses with the sensory neurone; the term "receptor" alone (rather than "sensory receptor") is accepted.
Answer
Intermediate (relay) neurone; A motor neurone.
intermediate neurone (or motor neurone)
Background Concept
Once a sensory neurone enters the spinal cord or brain, it synapses with another neurone so that the signal can be processed and a response generated. The most common partner is an intermediate (relay) neurone within the CNS, but a sensory neurone can also synapse directly with a motor neurone in a monosynaptic reflex arc.
Understanding the Question
Structure B in Fig. 8.1 marks the synaptic terminals of the sensory neurone inside the CNS. The question asks which kind of cell receives this synapse.
Approach
Recall that within the spinal cord a sensory neurone normally passes its signal to an intermediate neurone, which then relays it to a motor neurone (or, in a reflex arc, sometimes directly to a motor neurone). Either is acceptable; "intermediate neurone" is the most common textbook answer.
Step-by-Step Reasoning
- Structure B is shown at the end of the sensory neurone inside the spinal cord (the side with the cell body and synaptic knobs).
- Inside the CNS, sensory neurones synapse with intermediate (relay) neurones.
- In a reflex arc, a sensory neurone can also synapse directly with a motor neurone.
Key Takeaways
Sensory neurones do not contact effectors directly — they pass their information to another neurone inside the CNS, almost always an intermediate (relay) neurone.
Common Mistakes
Writing "effector" or "muscle" — these do not form synapses with the sensory neurone. Only neurones form synapses with another neurone here.
Things to Be Careful About
The mark scheme accepts "intermediate neurone", "relay neurone" or "motor neurone". Spelling "intermediate" correctly is important for clarity.
Answer
Schwann (cells).
Schwann cells
Background Concept
In the peripheral nervous system (PNS), myelin is made by Schwann cells. Each Schwann cell wraps a single segment of one axon, leaving small unmyelinated gaps called nodes of Ranvier between adjacent Schwann cells. In the central nervous system, oligodendrocytes produce myelin and one oligodendrocyte can myelinate several axons.
Understanding the Question
Fig. 8.1 shows a sensory neurone whose axon is wrapped in a thick myelin sheath. The myelin sheath lies in the PNS, so the cells that produce it are Schwann cells.
Approach
Identify the location of the myelin sheath (PNS, because the sensory neurone extends from a receptor in the skin/muscle into the CNS). In the PNS, myelination is performed by Schwann cells.
Step-by-Step Reasoning
- Sensory neurone axons outside the CNS are part of the PNS.
- Myelinating cells in the PNS are Schwann cells.
- (Contrast: in the CNS, oligodendrocytes make the myelin.)
Key Takeaways
Schwann cell (PNS) versus oligodendrocyte (CNS) is a frequently tested distinction. Each Schwann cell myelinates a single segment of a single axon; oligodendrocytes can myelinate many axons simultaneously.
Common Mistakes
Writing "oligodendrocyte" — this is the CNS equivalent and would be incorrect here because the bulk of the sensory neurone axon lies in the PNS.
Things to Be Careful About
The plural "Schwann cells" is acceptable; singular is also fine. Capitalisation does not matter for the mark.
State and explain the differences in the transmission of impulses between myelinated and unmyelinated neurones.
Answer
- Impulse transmission is faster in a myelinated neurone than in an unmyelinated one.
- The myelin sheath insulates the axon, preventing ion movement across the membrane in the myelinated regions.
- The nodes of Ranvier (gaps between adjacent Schwann cells) contain voltage-gated ion channels and are the only places where ions can cross the membrane.
- Depolarisation / action potential only occurs at the nodes of Ranvier, not along the myelinated sections.
- The action potential effectively "jumps" from one node to the next — this is called saltatory conduction.
- Local circuits are longer in myelinated axons (they extend between successive nodes) so the impulse is regenerated less often, which also contributes to the faster conduction.
See working
Background Concept
An action potential is a brief reversal of the membrane potential caused by the rapid influx of Na⁺ ions through voltage-gated sodium channels. The action potential is regenerated along the axon by local circuits: positive ions flow from the depolarised region into the next resting region, depolarising the membrane there to threshold and triggering new voltage-gated Na⁺ channels to open.
In an unmyelinated axon, voltage-gated Na⁺ channels are present along the entire length of the axon, so the action potential must be regenerated at every point along the membrane — conduction is slow and continuous.
In a myelinated axon, the membrane is wrapped in Schwann cells. The myelin is a good electrical insulator, so very few ions can cross the membrane in the myelinated regions. Voltage-gated Na⁺ channels are concentrated only at the nodes of Ranvier — the small unmyelinated gaps between adjacent Schwann cells. Because the myelin prevents ion movement, depolarisation can only occur at the nodes, and the action potential effectively jumps from node to node. This mode of conduction is called saltatory conduction (from the Latin saltare — to jump).
Saltatory conduction is much faster than continuous conduction for two reasons:
- Fewer action potentials need to be generated (only at each node, not at every micrometre).
- Local circuits in a myelinated axon are very long — they extend between successive nodes (~1 mm apart) rather than over a fraction of a micrometre, so the impulse effectively travels further in each "step".
Understanding the Question
Part (b) is a four-mark "state and explain" question. The command word "state" requires the headline difference; "explain" requires the biological reason for the difference. A good answer will give one statement of the difference (myelinated is faster) and then several explanatory points (insulation, nodes, depolarisation only at nodes, saltatory conduction, longer local circuits).
Approach
- Open with the observable difference: speed of conduction.
- Then explain WHY the myelin sheath changes conduction: it insulates.
- Then describe the role of the nodes of Ranvier as the only place where the action potential can be regenerated.
- Finally, name the mechanism (saltatory conduction) and the consequence for local circuits.
Step-by-Step Reasoning
- State the difference. Myelinated neurones conduct impulses faster than unmyelinated ones.
- Insulation. The myelin sheath is an electrical insulator; it prevents ions from moving across the membrane in the wrapped regions.
- Nodes of Ranvier. Only at the nodes of Ranvier (gaps between adjacent Schwann cells, with no myelin) are ions able to cross the membrane and voltage-gated Na⁺ channels are concentrated.
- Depolarisation only at nodes. The action potential can therefore only be generated at the nodes, not along the myelinated sections.
- Saltatory conduction. The action potential jumps from one node to the next — this is saltatory conduction.
- Local circuits. Because the internodal distance is long, local circuits are correspondingly longer, so the impulse is regenerated less often; this further increases the speed of conduction in myelinated axons.
Key Takeaways
- Myelinated = fast, saltatory, action potentials only at nodes.
- Unmyelinated = slow, continuous, action potentials regenerated along the whole length.
- The myelin sheath acts as an insulator; the nodes of Ranvier concentrate the voltage-gated channels needed to regenerate the action potential.
Common Mistakes
- Stating only that myelinated is faster, without any explanation (gives only 1 of 4 marks).
- Saying that the impulse "travels through the myelin" — incorrect; the impulse is conducted in the cytoplasm and regenerates at the nodes.
- Confusing the role of the myelin sheath (electrical insulation) with that of the nodes of Ranvier (site of ion exchange and action potential regeneration).
- Writing "action potential jumps along the axon" without naming the mechanism as saltatory conduction.
Things to Be Careful About
The mark scheme explicitly notes that "ora" (or reverse argument) is acceptable for each comparative point, so a candidate who writes the points in terms of unmyelinated neurones (e.g. "slower, continuous conduction, action potentials along whole length") can still earn full marks. Aim to give at least four well-distinguished points to be safe.
Opioids are therapeutic drugs that are used to relieve pain. Morphine is an example of an opioid. It affects the functioning of synapses.
Fig. 8.2 is a diagram of a cholinergic synapse.
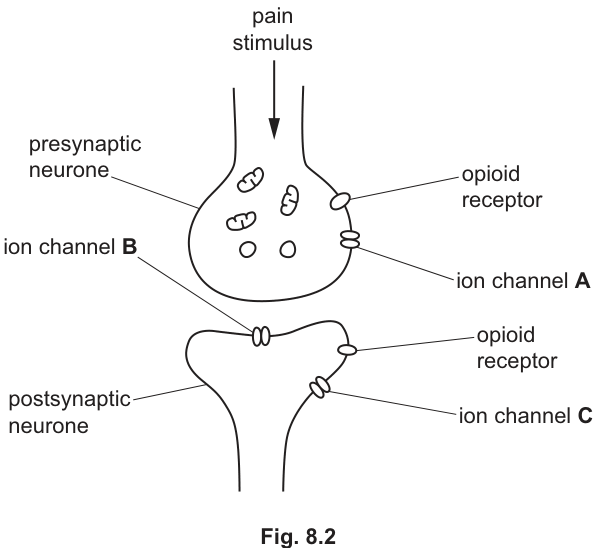
With reference to Fig. 8.2, describe the differences between ion channel A and ion channel B.
Answer
- Ion channel A is voltage-gated (opens in response to depolarisation / arrival of an action potential) and allows calcium (Ca²⁺) ions to enter the presynaptic neurone.
- Ion channel B is ligand-gated (opens in response to the binding of acetylcholine / neurotransmitter) and allows sodium (Na⁺) ions to enter the postsynaptic neurone.
A is voltage-gated for Ca²⁺; B is ligand-gated for Na⁺.
Background Concept
A cholinergic synapse uses acetylcholine (ACh) as its neurotransmitter. Two different types of ion channel operate at such a synapse:
-
Voltage-gated calcium channels in the presynaptic membrane. When an action potential arrives at the synaptic knob, the depolarisation opens these channels and Ca²⁺ ions flow down their steep electrochemical gradient into the cytoplasm. The Ca²⁺ triggers vesicles to fuse with the presynaptic membrane and release ACh into the cleft.
-
Ligand-gated sodium channels in the postsynaptic membrane. These are the ACh receptor/channels. They are closed until two molecules of ACh bind to them. Binding opens the channel, allowing Na⁺ to flow into the postsynaptic cell, depolarising the postsynaptic membrane and generating a new action potential.
The stimulus, ion selectivity and trigger for opening therefore all differ between the two channels.
Understanding the Question
The question (with reference to Fig. 8.2) labels two ion channels in the presynaptic neurone: A and B. Looking at the figure, A is the channel that brings the action potential into the presynaptic knob (and so responds to depolarisation), while B is the channel that is exposed to the synaptic cleft and so responds to the neurotransmitter released into it. The question asks for the differences between A and B.
Approach
For each channel, identify:
- what stimulus opens it (voltage or ligand)
- which ion it passes (Ca²⁺ or Na⁺)
A neat answer presents these contrasts in a single sentence or two short statements.
Step-by-Step Reasoning
- Channel A is in the presynaptic membrane away from the cleft and is described as a voltage-gated calcium channel — it opens when the membrane is depolarised by the incoming action potential and lets Ca²⁺ in.
- Channel B is in the postsynaptic membrane facing the cleft and is described as a ligand-gated sodium channel — it opens when ACh (the ligand) binds to it, letting Na⁺ into the postsynaptic cell.
- So the differences are: trigger (voltage vs ligand) and the ion that moves (Ca²⁺ vs Na⁺).
Key Takeaways
- Presynaptic Ca²⁺ channels are voltage-gated; they couple the electrical signal to chemical release.
- Postsynaptic Na⁺ channels (nicotinic ACh receptors) are ligand-gated; they convert the chemical signal back into an electrical signal in the next cell.
- The stimulus (depolarisation or neurotransmitter) and the ion (Ca²⁺ or Na⁺) are the two clean contrasts needed.
Common Mistakes
- Confusing the location: writing that channel B is in the presynaptic membrane (it is in the postsynaptic membrane).
- Confusing the ion: writing that channel A lets Na⁺ in or that channel B lets Ca²⁺ in.
- Stating only one of the two differences (e.g. only the trigger) — both are needed for the two marks.
Things to Be Careful About
A clean answer hits both contrasts in one go. Spelling "ligand-gated" and "voltage-gated" correctly is important; avoid "ligand gated" (without a hyphen) and "voltage gated".
Morphine binds to the opioid receptor in the presynaptic membrane. This stops the ion channel A from opening.
Suggest and describe the effects of the binding of morphine to this opioid receptor on the functioning of the cholinergic synapse.
Answer
- Morphine binds to the presynaptic opioid receptor, which prevents ion channel A from opening.
- Therefore no Ca²⁺ ions enter the presynaptic neurone.
- Synaptic vesicles containing ACh do not move towards / fuse with the presynaptic membrane.
- No ACh is released into the synaptic cleft (no exocytosis).
- ACh cannot bind to the receptors / ion channel B on the postsynaptic membrane.
- Na⁺ does not enter the postsynaptic neurone, so the postsynaptic membrane is not depolarised and no new action potential is generated — the impulse is not transmitted across the synapse.
No Ca²⁺ entry → no ACh release → no postsynaptic depolarisation → no impulse transmission.
Background Concept
In a cholinergic synapse, the arrival of an action potential at the synaptic knob opens voltage-gated Ca²⁺ channels. Ca²⁺ entry is the critical step that links electrical activity to chemical release: the Ca²⁺ binds to proteins on the synaptic vesicles, causing the vesicles to dock with and fuse with the presynaptic membrane (exocytosis), releasing ACh into the synaptic cleft. ACh then diffuses across the cleft and binds to ligand-gated Na⁺ channels on the postsynaptic membrane, opening them and depolarising the postsynaptic cell.
If any link in this chain is broken, the synapse fails to transmit the signal. The question asks what happens if a drug (morphine) blocks the presynaptic voltage-gated Ca²⁺ channels (channel A) by binding to an opioid receptor on the presynaptic membrane.
Understanding the Question
The question is essentially a "what would happen if..." cascade. The candidate must trace the consequences of a single early block (no Ca²⁺ entry) through every subsequent step of synaptic transmission and explain why the postsynaptic cell is no longer excited. There are 4 marks, so four clear, dependent points are required.
Approach
Work step by step through the normal sequence of events at a cholinergic synapse, marking where the block takes effect, and then state what fails at each subsequent stage.
Step-by-Step Reasoning
- Block at the Ca²⁺ channel. Morphine binds to the opioid receptor, which (via a G-protein mechanism) closes the voltage-gated Ca²⁺ channel. So no Ca²⁺ ions can enter the presynaptic neurone when an action potential arrives.
- No vesicle movement / fusion. Without Ca²⁺, the synaptic vesicles do not move towards the presynaptic membrane and do not fuse with it.
- No ACh release. Exocytosis does not occur, so no acetylcholine is released into the synaptic cleft.
- ACh cannot bind to channel B. With no ACh in the cleft, the ligand-gated Na⁺ channels on the postsynaptic membrane have nothing to bind and so remain closed.
- No Na⁺ entry. Na⁺ cannot flow into the postsynaptic neurone, so the postsynaptic membrane is not depolarised.
- No new action potential. The threshold is not reached, so no action potential is generated in the postsynaptic neurone. The signal is not transmitted across the synapse.
This is the mechanism by which morphine (and other opioids) reduce the transmission of pain signals in the nervous system.
Key Takeaways
- Ca²⁺ entry into the presynaptic knob is the trigger for neurotransmitter release.
- Block the Ca²⁺ channel and the entire downstream sequence — vesicle fusion, ACh release, postsynaptic Na⁺ entry, depolarisation — fails.
- This is why opioids are effective painkillers: they reduce transmission of pain signals at synapses in pain pathways.
Common Mistakes
- Saying that morphine "stops the neurotransmitter from being made" — morphine does not affect ACh synthesis, only its release.
- Saying that morphine "destroys the neurotransmitter" — it doesn't; the lack of release is the problem.
- Stating only that the postsynaptic neurone is not depolarised, without explaining WHY (no ACh, because no Ca²⁺, because the channel was blocked).
- Confusing the pre- and post-synaptic effects (part (ii) is about the presynaptic action of morphine only).
Things to Be Careful About
The question is worth 4 marks, so 4 distinct points are needed. A common mark-scheme structure is:
- no Ca²⁺ entry (1)
- no vesicle fusion / no ACh release (1)
- no ACh binding to channel B (1)
- no postsynaptic depolarisation / no action potential generated (1).
The mark scheme allows the candidate to combine any two adjacent points, so the precise wording can vary, but the logical chain must be intact.
Morphine also binds to the opioid receptor in the postsynaptic membrane. This results in the opening of ion channel C, allowing potassium ions to diffuse out of the cell.
Suggest how this would affect the synapse.
Answer
- The inside of the postsynaptic neurone becomes more negative relative to the outside — the membrane is hyperpolarised (the membrane potential becomes more negative / the potential difference across the membrane increases).
- It is therefore harder for the membrane to reach threshold / the threshold is further away, so it is harder to depolarise the membrane and fewer (or no) action potentials are generated in the postsynaptic neurone.
Hyperpolarisation → harder to reach threshold → fewer / no action potentials.
Background Concept
The resting membrane potential of a neurone is about −70 mV (inside negative). The threshold for generating an action potential is about −55 mV. An action potential is triggered when the membrane is depolarised to threshold, opening voltage-gated Na⁺ channels and causing the rapid Na⁺ influx that drives the membrane potential up to about +40 mV.
The membrane potential depends on the relative permeabilities of the membrane to Na⁺ and K⁺ and the operation of the Na⁺/K⁺ pump. If the membrane becomes more permeable to K⁺, K⁺ flows out of the cell down its electrochemical gradient, taking positive charge with it, leaving the inside more negative than the resting value. This is called hyperpolarisation (or the membrane potential is said to be "more negative" or "below resting").
A hyperpolarised membrane is further from threshold, so a larger depolarising stimulus is needed to reach −55 mV and fire an action potential. In practice, the membrane is harder to depolarise and fewer action potentials are generated.
Understanding the Question
The question states that morphine opens ion channel C in the postsynaptic membrane, allowing K⁺ to diffuse OUT of the cell. The candidate is asked to suggest how this affects the synapse.
Approach
- Identify the immediate consequence: K⁺ leaving the cell makes the inside more negative (hyperpolarisation).
- Identify the next consequence: the membrane is now further from threshold, so it is harder to depolarise.
- Identify the final consequence: fewer or no action potentials are generated in the postsynaptic neurone, so signal transmission is reduced or abolished.
Step-by-Step Reasoning
- K⁺ diffuses out of the postsynaptic cell down its electrochemical gradient, leaving the inside of the membrane relatively more negative than the outside — the membrane is hyperpolarised.
- Because the membrane potential is now more negative than the resting value, it is further from the threshold for an action potential.
- The membrane is therefore harder to depolarise, and either no action potential is generated or fewer action potentials are generated in the postsynaptic neurone.
- The net effect is that the synapse is less likely to transmit a signal — another mechanism by which morphine reduces the transmission of pain impulses.
Key Takeaways
- K⁺ efflux hyperpolarises the membrane.
- Hyperpolarisation moves the membrane potential further from threshold.
- This makes it harder to fire an action potential — fewer or no impulses are transmitted.
- This is the second site of action of morphine in the cholinergic synapse (the first being the presynaptic block of Ca²⁺ entry).
Common Mistakes
- Writing that the inside becomes "more positive" — the opposite is true: K⁺ leaving the cell takes positive charge away from the inside.
- Saying "the action potential is amplified" or "the synapse is excited" — hyperpolarisation inhibits, not excites.
- Stating that "no neurotransmitter is released" — the question is about the postsynaptic effect, so neurotransmitter release is irrelevant here.
Things to Be Careful About
The question is worth 2 marks, so two distinct points are needed:
- the membrane is hyperpolarised / the inside is more negative (1);
- fewer or no action potentials are generated (1).
The mark scheme accepts either "harder to reach threshold" or "harder to depolarise the membrane" as the link between hyperpolarisation and the failure to generate an action potential.
The Asian common toad, Duttaphrynus melanostictus, arrived accidentally in eastern Madagascar in 2010 on a ship.
Fig. 9.1 shows an Asian common toad.
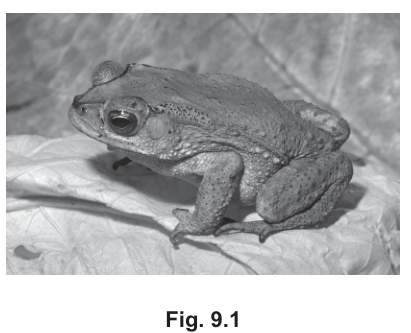
The Asian common toad is now regarded as an invasive alien species because:
- it breeds fast in the warm, wet conditions of eastern Madagascar
- it can travel up to per year
- its skin contains poison, which is highly toxic to humans and predators.
Suggest ways in which the Asian common toad may affect the ecosystem of eastern Madagascar.
Answer
Any four from:
- The toad is toxic to predators, so it is not predated / any predators that try to eat it are killed, allowing numbers to increase unchecked.
- It eats native (Madagascan) species, decreasing their numbers.
- This disrupts food webs / food chains / the ecosystem.
- It breeds rapidly and can travel up to per year, so it can spread to other areas and its numbers increase rapidly.
- Native species are outcompeted for food / space / breeding areas / water / other resources.
- Biodiversity is reduced.
- Native species can be driven to extinction.
- It can introduce new diseases to which native species have no immunity.
Any four creditable points from the list above.
Background Concept
An invasive alien species is a non-native organism whose introduction outside its natural range threatens native biodiversity, ecosystems, economy or human health. The Asian common toad (Duttaphrynus melanostictus) has three traits that make it a particularly successful invader:
- it breeds rapidly in warm, wet conditions (high reproductive output);
- it disperses by itself (up to per year) and was originally carried long distances by human transport (a ship);
- its skin secretes bufotoxins, which are highly toxic to any animal that tries to eat it.
These traits are important because they allow the toad to escape the population control that normally keeps native species in check (predation, disease, competition). An unchecked population can then exert intense pressure on the native community.
Understanding the Question
The question gives a short case study of an invasive alien toad newly arrived in eastern Madagascar. The three bullet points are clues about WHY it is invasive; you are asked to suggest the consequences for the ecosystem. The command word is suggest, so you are not expected to recall a fixed list — you are expected to apply biological reasoning about how a rapidly breeding, toxic, dispersing animal can affect the community it enters.
Approach
Read each clue and ask "what does this trait allow the toad to do that harms the ecosystem?":
- toxic skin → not eaten / kills predators;
- rapid breeding → population explosion;
- dispersal → spreads the problem geographically;
- being a new generalist consumer → eats native prey;
- being a new generalist competitor → competes with native species;
- being a new arrival → brings new diseases.
From this, list the consequences: predation on natives, competition, food-web disruption, biodiversity loss, possible extinction, disease introduction. The mark scheme accepts any four sensible, distinct points.
Step-by-Step Reasoning
- Toxicity consequence: because the skin poison kills or repels predators, the toad suffers little natural population control in Madagascar (where native predators have not co-evolved with it). The first marking point — not predated / predators killed — captures this.
- Predation on natives: as a generalist insectivore/small-vertebrate predator, the toad eats native invertebrates, frogs and small reptiles, decreasing their numbers — the second point.
- Food-web disruption: removing native prey and adding a new toxic top consumer alters who-eats-whom links, so food webs/food chains are disrupted — the third point.
- Spread and population growth: "breeds fast" + " per year" means the toad is not a localised problem; it can spread to other areas and its numbers increase rapidly — the fourth point.
- Competition: the same traits that boost the toad's population mean it competes with native amphibians and other animals for the same food, shelter, water and breeding sites — a further credit-worthy point.
- Biodiversity loss and extinction: fewer native species survive (or some go extinct), so overall biodiversity is reduced and extinctions of native species can occur.
- Disease introduction: any novel host can carry pathogens to which native fauna have no immunity, so new diseases may be introduced.
Key Takeaways
- Invasive alien species are harmful because they combine rapid reproduction, dispersal, lack of natural enemies and novel competition/predation pressures.
- The classic impacts to remember: predation, competition, food-web disruption, biodiversity loss, possible extinction, disease introduction.
- Always link a trait given in the stem to the consequence for the ecosystem; do not give generic statements about "harm to nature".
Common Mistakes
- Vague statements such as "it will harm the environment" or "it will reduce biodiversity" given without a mechanism — these score nothing because the mark scheme requires the link (e.g. "eats native species", "competes for food").
- Restating the information in the stem as if it were a consequence (e.g. "the toad breeds fast" is the cause, not the impact; the impact is "numbers increase rapidly / it spreads").
- Forgetting that the toad can cause extinctions, not just reduce numbers — extinction is a stronger, separately credited point.
Things to Be Careful About
- "Suggest" means you only need plausible biological reasoning; you do not need Madagascar-specific knowledge.
- The mark scheme says "any four from" eight options, so a strong candidate lists several different mechanisms rather than paraphrasing the same idea twice.
- Credit is given for native/local species, so make clear it is the indigenous community that suffers.
- Use precise wording: "competes with native species for food/space/breeding sites", not "takes over".
Zoos work with local groups around the world to help conserve endangered species.
One example of this is the use of assisted reproduction, such as IVF, with endangered mammals such as the eastern black rhino.
Outline the process of IVF.
Answer
- The female is given hormones (FSH) to stimulate maturation / superovulation of the oocytes (eggs).
- The oocytes are collected / harvested from the female.
- Sperm (from a genetically suitable male) is added to the oocytes so that fertilisation occurs in vitro.
- The resulting embryos are checked / selected (e.g. for normality and sex).
- A viable embryo is placed into the uterus of a surrogate mother, where it implants and develops.
- Any surplus embryos can be frozen for later use.
Any four of the above earn full marks.
Female given FSH → oocytes collected → sperm added / fertilisation in vitro → embryos checked/selected → embryo placed in uterus; surplus embryos may be frozen.
Background Concept
In-vitro fertilisation (IVF) is an assisted reproductive technology in which an oocyte (egg) is fertilised by a sperm outside the body, in a controlled laboratory environment, and the resulting embryo is then transferred into a female's uterus to develop. In conservation, IVF is used to:
- produce offspring from genetically valuable parents (e.g. the last few individuals of a critically endangered species such as the eastern black rhino, Diceros bicornis michaeli);
- multiply the number of offspring from animals that breed poorly in captivity;
- combine genetics from animals in different zoos without moving them.
The same basic steps are used whether the patient is a human, a cow or a rhino — the differences are in dose, hormone type and timing.
Understanding the Question
The stem introduces IVF as a tool used by zoos for endangered mammals. The command word is outline — you must state the main stages of the process, in a sensible order, but you do not need to explain the underlying biology of each step. The mark scheme credits any four points from a list of seven; the answer below picks the four most central stages and notes two extras for completeness.
Approach
The IVF process has a fixed sequence — write the stages in order so that an examiner can follow the logic:
- Get many eggs from the female (hormone stimulation).
- Collect the eggs.
- Fertilise the eggs with sperm in the lab.
- Check / select the embryos.
- Place an embryo into a uterus (transfer to a surrogate).
- Freeze surplus embryos for later use.
The mark scheme allows "eggs" for "oocytes"; in a zoo/conservation context, "genetically suitable male" implies careful choice of sire.
Step-by-Step Reasoning
- Hormone stimulation (mark 1): in a natural cycle a female rhino ovulates only one or a few eggs. To maximise the number of embryos produced, the female is injected with follicle-stimulating hormone (FSH). FSH causes several follicles in the ovaries to mature at once — a process called superovulation — so that many oocytes can be collected in a single session.
- Oocyte collection (mark 2): the mature oocytes are harvested from the ovaries, usually by a needle guided by ultrasound (called ovum pick-up, OPU). In some species, oocytes are recovered from follicles after the animal's death.
- Fertilisation (mark 3): in the laboratory, prepared sperm is added to the oocytes in a culture dish, where fertilisation occurs. The mark scheme also credits the idea of using sperm from a genetically distant/appropriate male to maximise genetic diversity — vital in conservation.
- Embryo checking/selection (mark 4): after a few days the fertilised eggs have divided to become embryos. These are examined and selected — only normally developing embryos are chosen for transfer. Selection may also be used to choose the sex of the embryo (e.g. to balance the captive population).
- Embryo transfer (mark 5): a selected embryo is placed into the uterus of a recipient (surrogate) female, which has been hormonally prepared to be in the correct stage of her cycle to accept the embryo. The embryo implants in the uterine lining and develops to term naturally.
- Embryo freezing (mark 6): any surplus embryos are frozen (cryopreserved) in liquid nitrogen, so they can be thawed and transferred at a later date, or shipped to other zoos to introduce new genetics without moving the parents.
Key Takeaways
- IVF has six key stages: hormone stimulation → oocyte collection → in-vitro fertilisation → embryo selection → embryo transfer → possible embryo freezing.
- In conservation, the choice of sire (sperm donor) is just as important as the technique itself, because the aim is to maintain genetic diversity in small populations.
- A surrogate female carries the embryo; the genetic mother is the oocyte donor.
Common Mistakes
- Writing "eggs and sperm are put into the mother" — this is AI (artificial insemination), not IVF. In IVF, fertilisation happens outside the body.
- Saying "the embryo develops in a test tube" or "in a Petri dish" until birth — incorrect; the embryo is transferred into a uterus for the rest of development.
- Forgetting superovulation or hormone treatment — without this, the female produces only one egg and IVF is inefficient.
- Confusing oocyte with embryo in the selection step — selection happens after fertilisation, on the embryos.
Things to Be Careful About
- Use the precise terms: oocyte / ova (or accept "eggs"), sperm, embryo, surrogate / recipient.
- Use FSH rather than "fertility drugs".
- The mark scheme allows you to gain full marks with any four distinct points, but a sequence of well-connected points is more convincing than four isolated phrases.
- For a zoo/conservation context, mentioning that the sire is chosen to maintain genetic diversity is a strong, syllabus-credited point.
In mammals, blood glucose concentration is maintained around a set point so that the mammal can function efficiently. This is an example of homeostasis.
Name the mechanism that maintains blood glucose concentration around a set point.
Answer
Negative feedback
Negative feedback
Background Concept
Homeostasis is the maintenance of a constant internal environment around an optimum set point, despite changes inside or outside the body. In mammals this includes blood glucose concentration, body temperature, blood pH, water potential of the blood and carbon dioxide concentration. Two mechanisms can restore a deviation from the set point: negative feedback, which reverses the change and returns the variable to the set point, and positive feedback, which reinforces the change (only used in a few specialised contexts such as childbirth and blood clotting).
In negative feedback, a receptor detects the change, a coordination centre compares it to the set point, and an effector is activated to oppose the deviation. The response reduces the original stimulus, so the variable settles back near the set point.
Understanding the Question
The stem tells you that blood glucose concentration is maintained around a set point so the mammal can function efficiently, and asks for the name of the mechanism that achieves this. The word "around a set point" is the giveaway — the variable is being kept close to one value by a corrective response to any deviation.
Approach
Read the command word: "Name". This requires a single term, not an explanation. The term that describes any system which keeps a variable close to a set point by reversing deviations is the one required.
Step-by-Step Reasoning
- Blood glucose rises after a meal and falls during exercise. Both deviations are corrected by responses that move the concentration back towards the set point.
- A mechanism that opposes (i.e. reverses) the direction of the original change, and therefore keeps the variable around the set point, is called negative feedback.
- No other single term fits the description in the question stem.
Key Takeaways
- "Negative feedback" is the standard CIE term for the corrective mechanism that maintains a variable around a set point.
- Negative feedback is the dominant control mechanism in homeostasis; positive feedback is rare.
Common Mistakes
- Writing "positive feedback" — this would amplify, not correct, the deviation.
- Writing a full sentence such as "the pancreas releases insulin" — the question asked for the name of the mechanism, not the effector response.
Things to Be Careful About
- A single word/term is sufficient for a 1-mark "Name" question; do not waste time writing out a definition.
Fig. 10.1 shows how the blood glucose concentration varies before, during and after a period of exercise.
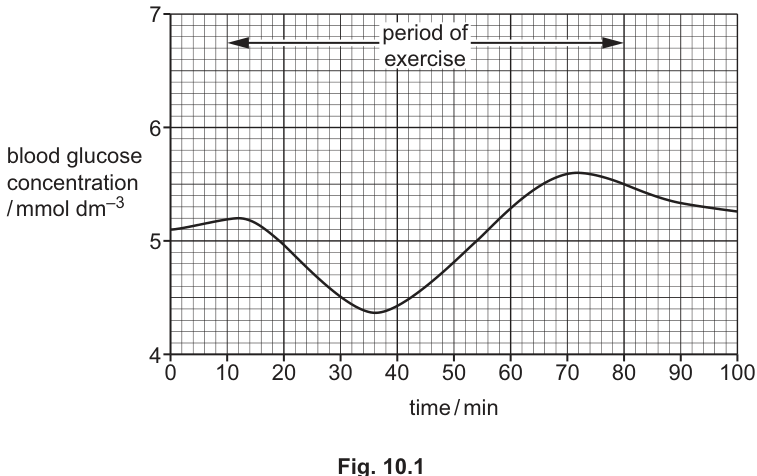
Explain the results shown in Fig. 10.1 between 15 minutes and 70 minutes.
Answer
- (Blood) glucose concentration decreases (between 15 and ~37 min) because muscle respiration increases during exercise, using glucose to generate ATP for contraction.
- The decrease is detected and the α-cells of the islets of Langerhans in the pancreas release glucagon.
- Glucagon acts on liver cells, stimulating glycogenolysis — the breakdown of glycogen to glucose.
- Glucose is released from the liver into the blood, so (blood) glucose concentration rises and returns towards the set point by 70 min.
Decrease from increased respiration during exercise; glucagon released from the pancreas acts on liver cells, stimulating glycogenolysis, so glucose is released into the blood and concentration returns to the set point.
Background Concept
Blood glucose concentration is tightly regulated in mammals. The two key pancreatic hormones are:
- Insulin, secreted by β-cells when blood glucose rises above the set point. It stimulates the uptake of glucose by muscle and other body cells, and the conversion of glucose to glycogen (glycogenesis) in the liver and muscles, lowering blood glucose.
- Glucagon, secreted by α-cells when blood glucose falls below the set point. It acts on the liver to stimulate glycogenolysis (breakdown of glycogen to glucose) and gluconeogenesis (synthesis of glucose from non-carbohydrate sources), raising blood glucose.
During exercise, skeletal muscles contract repeatedly and so respire much more rapidly. They take up more glucose from the blood to support aerobic respiration (and, if oxygen is limiting, anaerobic respiration), which lowers blood glucose concentration. The homeostatic response is dominated by glucagon, which restores the concentration towards the set point.
Understanding the Question
Fig. 10.1 shows blood glucose concentration from 0 to 100 min, with the period of exercise marked from 15 to 70 min. The trace shows:
- a slight rise before exercise (5.0 → 5.2 mmol dm⁻³),
- a fall during the first part of exercise to a minimum of ~4.4 mmol dm⁻³ at 37 min,
- a steady rise during the rest of exercise to a peak of ~5.6 mmol dm⁻³ at 72 min, and
- a gradual fall back to ~5.2 mmol dm⁻³ after exercise ends.
The question asks you to explain the results between 15 and 70 min (the exercise period), so you must cover both the drop and the recovery.
Approach
- Identify the two distinct phases in the graph within 15–70 min: the initial decrease (15–37 min) and the subsequent rise (37–70 min).
- For the decrease, link it to the increased demand for glucose during exercise (muscle respiration → ATP for contraction).
- For the rise, identify the corrective hormonal response (glucagon) and the metabolic process (glycogenolysis in the liver) that brings glucose back towards the set point.
Step-by-Step Reasoning
- Marking point 1 — why glucose falls: During exercise, skeletal muscle cells respire at a much higher rate to provide the ATP needed for contraction. The extra ATP demand increases the rate of glucose uptake from the blood by the muscles, so blood glucose concentration drops (visible from 15 to 37 min).
- Marking point 2 — the corrective hormone: The fall in blood glucose is detected by α-cells in the islets of Langerhans of the pancreas, which secrete glucagon into the blood.
- Marking point 3 — site and mode of action: Glucagon travels in the blood to the liver, where it binds to receptors on hepatocytes and (via a cAMP second-messenger cascade) activates the enzymes that break down glycogen.
- Marking point 4 — result: Glycogenolysis releases glucose, which diffuses out of the liver cells into the blood, raising the blood glucose concentration back towards the set point (visible as the rise from 37 to 70 min).
- Optional extra (AVP) — if blood glucose remains low, glucagon also stimulates gluconeogenesis in the liver, synthesising new glucose from amino acids and other non-carbohydrate precursors.
Key Takeaways
- Exercise lowers blood glucose because working muscles take up and respire more glucose.
- Glucagon is the corrective hormone for a fall in blood glucose; it stimulates glycogenolysis in the liver.
- A successful explanation links each phase of the graph to a specific physiological process and the hormone that triggers it.
Common Mistakes
- Saying "insulin" is released when glucose falls. Insulin is released when glucose is high; the corrective response to a fall is glucagon.
- Stating that glucagon "increases blood glucose" without naming the source (glycogenolysis in the liver). The mark scheme requires both the process and the site.
- Failing to explain why glucose falls in the first place, so only describing the recovery half of the trace.
- Confusing glycogenolysis (breakdown of glycogen to glucose) with glycogenesis (formation of glycogen from glucose) — the latter is stimulated by insulin, not glucagon.
Things to Be Careful About
- "Liver cells" is more precise than "the body"; "glycogenolysis" is the specific term the mark scheme is looking for.
- Stay strictly within the 15–70 min window the question specifies — do not describe the post-exercise fall or the pre-exercise rise.
Type 1 diabetes in humans is a condition where the pancreas does not produce enough insulin to control blood glucose concentration.
Test strips are used to measure the concentration of glucose in a sample of urine. Two reactions take place on the test strip and a colour change occurs if glucose is present in the urine.
The equations for these reactions are:
Answer
A — gluconic acid (accept gluconolactone)
B — chromogen (a colourless substrate that is oxidised to a coloured product)
A = gluconic acid (gluconolactone); B = chromogen
Background Concept
Urine glucose test strips carry two immobilised enzymes plus a colourless dye precursor. The two reactions occur in sequence on the pad:
- Glucose oxidase specifically oxidises glucose, using O₂ as the electron acceptor. The products are gluconic acid (sometimes written as gluconolactone, the immediate product that hydrates to gluconic acid) and hydrogen peroxide (H₂O₂).
- Peroxidase then uses the H₂O₂ generated in step 1 to oxidise a colourless organic dye precursor — called a chromogen — into a coloured form. The intensity of the colour is proportional to the original glucose concentration.
This "enzymatic cascade" links the specific detection of glucose to a visible colour change, allowing semi-quantitative estimation of glucose in the urine.
Understanding the Question
You are given the two equations with blanks for compound A and the identity of compound B:
You need to identify what A is (the other product of glucose oxidation) and what kind of substance B is (the colour-generating substrate).
Approach
For A, balance the glucose oxidase equation. Glucose (C₆H₁₂O₆) loses two hydrogens (it is oxidised) and gains an oxygen; the product is gluconic acid (or its lactone form). For B, recognise that the peroxidase reaction is a colour-generating step, so B must be a colourless precursor that is converted to a coloured product — i.e. a chromogen.
Step-by-Step Reasoning
- Glucose oxidase catalyses the oxidation of the aldehyde group on C1 of glucose to a carboxylic acid group. The 2 H atoms removed are accepted by O₂, giving H₂O₂. The remaining organic product is the corresponding acid — gluconic acid (or, transiently, gluconolactone).
- Peroxidase uses H₂O₂ to oxidise another substrate; this second substrate is chosen so that its oxidised form is brightly coloured. The colourless reduced form is, by definition, a chromogen (a "colour generator" once oxidised).
- Hence A = gluconic acid (or gluconolactone) and B = chromogen.
Key Takeaways
- Glucose oxidase produces gluconic acid (or gluconolactone) + H₂O₂ from glucose + O₂.
- Peroxidase reactions on test strips use a chromogen — a colourless precursor that is oxidised to a coloured product.
- The two-enzyme system couples the specific detection of glucose to an easily visible colour change.
Common Mistakes
- Writing A as "glucose oxidase" (the enzyme, not the product) or as "H₂O₂" (already given on the other side of the equation).
- Writing A as "gluconate" without context — accept "gluconic acid" (the acid) or "gluconolactone" (the cyclic form).
- Writing B as a specific named dye (e.g. "benzidine") — the mark scheme requires the generic term "chromogen".
- Confusing the two reactions: the chromogen is oxidised in the second (peroxidase) reaction, not the first.
Things to Be Careful About
- The mark scheme accepts either "gluconic acid" or "gluconolactone" for A — do not write both unless asked.
- "Chromogen" is the term the mark scheme requires; a vague answer such as "dye" or "indicator" would not be credited.
Most people with diabetes mellitus use a biosensor to obtain their blood glucose concentration.
Suggest the advantages of using a biosensor rather than test strips.
Answer
Any two of:
- A biosensor measures glucose in the blood directly, rather than indirectly via glucose in the urine (so a fall in blood glucose is detected immediately, not only after the kidney threshold is exceeded).
- A biosensor gives a quantitative (numerical) reading, while a test strip only gives a semi-quantitative colour comparison.
- A biosensor is reusable, whereas a test strip is single-use.
- A small drop of blood from a finger-prick is sufficient — quick and convenient, allowing frequent measurements throughout the day.
- Readings can be stored digitally and transferred to a phone/clinic, helping long-term monitoring.
Biosensor gives a direct, quantitative, reusable blood-glucose measurement, whereas a test strip only gives a semi-quantitative indication of glucose that has already spilled into the urine.
Background Concept
A urine test strip detects glucose only when the blood glucose concentration is high enough to exceed the renal threshold (~10 mmol dm⁻³ in healthy kidneys), so glucose "spills over" into the urine. This makes the test insensitive to low or normal values and gives only a rough, colour-based estimate. By contrast, a glucose biosensor (the small hand-held meter people with diabetes use) places a drop of capillary blood on a single-use strip that contains immobilised glucose oxidase. The H₂O₂ produced (or, in modern versions, the electrons transferred directly to an electrode) is measured electrochemically, giving a numerical reading in mmol dm⁻³ within seconds.
Understanding the Question
The question asks you to suggest advantages of using a biosensor rather than test strips. You are not asked to list every possible difference; two clear, distinct advantages will earn the 2 marks. Mark-scheme points are credited as long as they are genuine, justifiable advantages, and several alternatives are accepted.
Approach
Compare the two methods across the dimensions that matter for self-monitoring: the sample (blood vs urine), the type of reading (numerical vs colour-based), the cost-per-use (reusable meter + disposable electrode vs single-use strip), speed, sensitivity, and the ability to record data. Pick the two strongest, most distinct advantages.
Step-by-Step Reasoning
- Direct measurement of blood glucose. A biosensor uses capillary blood, so it measures the variable of interest directly. Test strips measure urine glucose, which is only a delayed, indirect indicator: glucose only appears in urine once blood glucose is high enough to saturate reabsorption in the proximal tubule.
- Quantitative / numerical result. The biosensor's electrochemical readout is quantitative (e.g. 7.2 mmol dm⁻³) and more accurate, allowing dose decisions. Test strips rely on comparing a colour to a printed chart — a subjective, semi-quantitative estimate.
- Reusable meter. The meter itself is reused indefinitely; only the small electrode strip is replaced per test. Urine test strips are typically single-use.
- Convenience and data storage. A finger-prick is quick, so readings can be taken many times a day. Many meters store readings, plot trends, and connect to phones or clinical software, supporting long-term management.
Key Takeaways
- A biosensor gives a direct, quantitative, blood-based measurement; a test strip gives an indirect, semi-quantitative, urine-based estimate.
- The major practical advantage is the ability to detect and respond to low or high blood glucose values in real time, including before hypoglycaemia becomes symptomatic.
Common Mistakes
- Saying only that a biosensor is "more accurate" or "faster" without qualifying in what way (e.g. quantitative vs colour, blood vs urine, reusable vs single-use).
- Stating that a biosensor "detects glucose", which a test strip also does — the difference lies in the sample, the sensitivity and the form of the result.
- Vague "it is more convenient" answers that the mark scheme would not credit without an explicit reason.
Things to Be Careful About
- "Quantitative" and "numerical" are both acceptable ways to express the same idea; pair the advantage with the contrast (test strip = colour comparison).
- Do not invent advantages not supported by the mark scheme (e.g. cost) — the question is "suggest", so any reasonable advantage counts, but make it specific.