Biology 9700/41 — May/June 2024
Cambridge A-Level · A Level Structured Questions · worked solutions for every part, with the mark scheme
Topics Selection and Evolution · Control and Coordination · Inheritance · Genetic Technology · Energy and Respiration · Homeostasis · +2 more
Oxygen is needed for aerobic respiration in cells.
In eukaryotic cells, the mitochondrion is the organelle used for aerobic respiration.
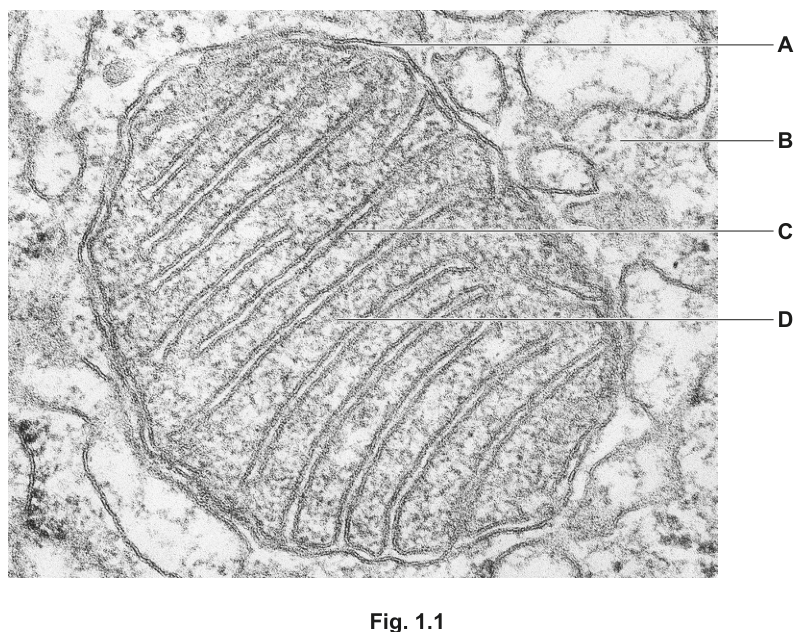
Fig. 1.1 shows a transmission electron micrograph of a mitochondrion.
Table 1.1 lists the four stages of aerobic respiration.
With reference to Fig. 1.1, complete Table 1.1 using the letters A–D to show where each stage occurs.
Each letter may be used once, more than once or not at all.
Table 1.1
| stage of respiration | letter |
|---|---|
| glycolysis | ……… |
| link reaction | ……… |
| Krebs cycle | ……… |
| oxidative phosphorylation | ……… |
Answer
| stage of respiration | letter |
|---|---|
| glycolysis | B |
| link reaction | D |
| Krebs cycle | D |
| oxidative phosphorylation | C |
Glycolysis: B; Link reaction: D; Krebs cycle: D; Oxidative phosphorylation: C
Background Concept
A mitochondrion is a double-membrane organelle in eukaryotic cells with four named regions:
- the outer membrane, which separates the organelle from the cytoplasm;
- the inner membrane, which is thrown into numerous folds called cristae that greatly increase its surface area;
- the intermembrane space, lying between the two membranes;
- the matrix, the gel-like central compartment enclosed by the inner membrane.
The four stages of aerobic respiration are located as follows:
- Glycolysis — in the cytoplasm/cytosol (it does not require a mitochondrion).
- Link reaction — in the matrix.
- Krebs cycle — in the matrix.
- Oxidative phosphorylation — on the inner mitochondrial membrane (cristae), where electron carriers and ATP synthase are embedded.
Understanding the Question
The candidate is shown a TEM of a mitochondrion with four labelled regions, A–D, and must complete Table 1.1 by writing the letter corresponding to the site of each stage. Letters may be used more than once.
From Fig. 1.1:
- A = outer mitochondrial membrane
- B = cytoplasm surrounding the mitochondrion
- C = cristae (folded inner membrane)
- D = matrix
Approach
Match each stage to the letter that points to its known location. Glycolysis uses the cytoplasm letter (B); the link reaction and Krebs cycle share the matrix letter (D); oxidative phosphorylation uses the cristae letter (C); A (outer membrane) is not the site of any of the four stages.
Step-by-Step Reasoning
- Glycolysis occurs in the cytoplasm → B.
- The link reaction occurs in the matrix → D.
- The Krebs cycle also occurs in the matrix → D.
- Oxidative phosphorylation occurs on the cristae → C.
- The outer membrane (A) is not the site of any of the four stages.
Key Takeaways
- Glycolysis is the only stage of aerobic respiration that occurs outside the mitochondrion, in the cytosol.
- Both the link reaction and Krebs cycle occur in the mitochondrial matrix.
- Oxidative phosphorylation requires the cristae because the electron transport chain carriers and ATP synthase are embedded in the inner membrane.
- The folded cristae provide a large surface area for the many ETC carriers and ATP synthase complexes needed for ATP production.
Common Mistakes
- Putting glycolysis in the matrix (it is in the cytoplasm).
- Putting oxidative phosphorylation in the matrix (it is on the inner membrane / cristae).
- Putting the link reaction or Krebs cycle on the cristae.
- Forgetting that the same letter can be used more than once (link reaction and Krebs cycle are both in the matrix).
Things to Be Careful About
- Glycolysis must be matched to a region OUTSIDE the mitochondrion — its site is the cytosol.
- Two stages share the same site (D), so do not hesitate to repeat a letter.
- The outer membrane (A) is not a site for any of these four stages — only the inner membrane, matrix and cytosol are.
In anaerobic conditions, no ATP can be synthesised by oxidative phosphorylation because the process stops.
Explain why ATP synthesis by oxidative phosphorylation stops in anaerobic conditions.
Answer
- Oxygen is the final/terminal electron acceptor of the electron transport chain (ETC).
- Without oxygen, the electron transport chain stops because the electrons have nowhere to go.
- Fewer/no protons () are pumped into the intermembrane space, so no proton/electrochemical gradient forms across the inner mitochondrial membrane.
- Fewer/no protons flow back through ATP synthase, so no ATP is produced by oxidative phosphorylation.
- In addition, NAD and FAD are not recycled, so the link reaction and Krebs cycle also slow or stop.
Without oxygen as the terminal electron acceptor the ETC stops; protons are not pumped into the intermembrane space; no proton gradient forms; no protons flow through ATP synthase; so no ATP is made by oxidative phosphorylation.
Background Concept
Oxidative phosphorylation is the final stage of aerobic respiration. It takes place on the inner mitochondrial membrane (cristae) and has two linked parts:
- The electron transport chain (ETC) — a series of carrier proteins embedded in the inner membrane.
- ATP synthase — a transmembrane enzyme that makes ATP from ADP and .
The mechanism (chemiosmosis) works as follows:
- Reduced coenzymes (NADH + and ) donate electrons to the ETC.
- Electrons pass from carrier to carrier, releasing energy.
- This energy is used to pump protons () from the matrix into the intermembrane space.
- A proton (electrochemical) gradient builds up across the inner membrane.
- Protons flow back down their gradient into the matrix, through ATP synthase, which uses this flow to phosphorylate ADP → ATP.
- At the end of the ETC, electrons are handed to oxygen, the final/terminal electron acceptor. Oxygen combines with the electrons and protons to form water.
Understanding the Question
The stem says ATP synthesis by oxidative phosphorylation stops under anaerobic conditions. The command word is explain, so the candidate must give a mechanistic chain of cause and effect, not just a statement that oxygen is needed.
Approach
Start from oxygen's role as the terminal electron acceptor, then trace the cascade: ETC stop → no proton pumping → no proton gradient → no ATP synthase activity → no ATP. Mark each step in the chain; the marks reward four distinct points in this logical sequence.
Step-by-Step Reasoning
- Oxygen is the final/terminal electron acceptor of the ETC. Removing it removes the destination of the electrons.
- With no oxygen to accept electrons, the ETC cannot pass electrons along and stops.
- Without electron flow, no energy is released by the carriers, so fewer/no protons are pumped from the matrix into the intermembrane space.
- A proton/electrochemical gradient does not form (or is much smaller) across the inner mitochondrial membrane.
- Without a proton gradient, protons do not flow back through ATP synthase into the matrix.
- With no proton flow, ATP synthase cannot phosphorylate ADP, so no ATP is produced by oxidative phosphorylation.
- As a knock-on effect, NAD and FAD are not regenerated, so the link reaction and Krebs cycle also slow or stop, although this is an additional rather than the primary point being tested.
Key Takeaways
- Oxidative phosphorylation depends on oxygen as the terminal electron acceptor — the chain has to "dispose" of its electrons somewhere.
- The proton gradient is the immediate driver of ATP synthase, so anything that prevents the gradient also stops ATP synthesis.
- Without the ETC, NAD/FAD cannot be reoxidised, so the whole respiratory pathway is impaired.
Common Mistakes
- Simply saying "oxygen is needed for respiration" without giving the mechanism — this is too vague for the marks.
- Omitting the proton gradient or ATP synthase.
- Confusing intermembrane space with matrix (the gradient is between these two compartments).
- Saying "no respiration" rather than "no ATP from oxidative phosphorylation" specifically.
Things to Be Careful About
- Each marking point corresponds to one link in the cascade; make sure all four are present.
- Use precise terminology: terminal electron acceptor, proton/electrochemical gradient, ATP synthase.
- The chemiosmotic link (proton gradient → ATP synthase) is the heart of the answer.
Up to 60% of the ATP that is produced in cancer cells comes from lactate fermentation of glucose, even though oxygen is present.
Scientists are developing cancer treatments to inhibit the enzyme that catalyses the last step of lactate fermentation.
Explain how the inhibition of this enzyme reduces the production of ATP in cancer cells.
Answer
- The enzyme that catalyses the last step of lactate fermentation is lactate dehydrogenase.
- Inhibiting it means less/no pyruvate is converted to lactate.
- This means less/no NAD is regenerated/recycled.
- Without NAD, less/no triose phosphate (TP) is converted to pyruvate in glycolysis.
- Therefore less/no ATP is produced by substrate-level phosphorylation in glycolysis, reducing the total ATP output of the cancer cell.
Inhibiting lactate dehydrogenase reduces lactate formation, so less NAD is regenerated, glycolysis slows (less TP → pyruvate), and less ATP is made by substrate-level phosphorylation.
Background Concept
Glycolysis splits one glucose (6C) into two pyruvate (3C) molecules. The pathway produces a small amount of ATP by substrate-level phosphorylation, particularly at the step in which triose phosphate (TP) is converted to pyruvate, where NADH + is also formed. For glycolysis to keep running, the NADH + must be reoxidised back to NAD.
Lactate fermentation regenerates that NAD:
The enzyme catalysing this step is lactate dehydrogenase. Note that lactate fermentation itself makes no ATP directly — its role is to keep glycolysis running so that glycolysis can keep producing ATP by substrate-level phosphorylation.
Some cancer cells show the Warburg effect: they carry out a high rate of glycolysis followed by lactate fermentation even when oxygen is available, generating up to 60% of their ATP this way.
Understanding the Question
The question states that up to 60% of ATP in cancer cells comes from lactate fermentation of glucose, even when oxygen is present, and that treatments are being developed to inhibit the enzyme that catalyses the last step of lactate fermentation. The candidate must explain how this inhibition reduces ATP production.
The command word is explain, so the candidate must give the causal chain, not just state the outcome.
Approach
Identify the enzyme (lactate dehydrogenase) and then trace the chain of consequences: blocked lactate production → no NAD regeneration → glycolysis stalls at the TP → pyruvate step → no substrate-level ATP from that step → cancer cell ATP supply falls.
Step-by-Step Reasoning
- The enzyme being inhibited is lactate dehydrogenase, which converts pyruvate to lactate.
- With the enzyme inhibited, less/no pyruvate is converted to lactate.
- The conversion of pyruvate to lactate is the step that regenerates NAD from NADH + . So inhibiting the enzyme means less/no NAD is regenerated.
- Glycolysis requires NAD (specifically at the glycerate-3-phosphate dehydrogenase step, equivalent to TP → pyruvate). Without NAD, less/no triose phosphate is converted to pyruvate, so glycolysis slows or stops.
- The TP → pyruvate step is the substrate-level phosphorylation step of glycolysis that produces ATP. With glycolysis blocked, less/no ATP is made by substrate-linked/substrate-level phosphorylation in glycolysis.
- Because the question states that up to 60% of the cancer cell's ATP comes from this route, blocking it makes a substantial dent in the cancer cell's total ATP supply.
Key Takeaways
- Lactate fermentation does not itself produce ATP; its value lies in regenerating NAD so that glycolysis can continue making ATP by substrate-level phosphorylation.
- The link between fermentation and ATP is indirect, via NAD recycling.
- The Warburg effect in cancer cells makes them unusually dependent on lactate fermentation, which is why inhibiting lactate dehydrogenase is a plausible therapeutic target.
Common Mistakes
- Saying lactate fermentation directly produces ATP — it does not; ATP is made in glycolysis.
- Failing to identify the enzyme as lactate dehydrogenase.
- Omitting the NAD-regeneration step (this is the critical link).
- Not naming substrate-level phosphorylation or the TP → pyruvate step.
- Saying the cancer cell dies — the question asks how ATP production is reduced, not about cell death.
Things to Be Careful About
- Use precise terminology: lactate dehydrogenase, regenerated/recycled NAD, substrate-level phosphorylation, triose phosphate → pyruvate.
- The mark scheme requires chaining: enzyme → lactate → NAD → glycolysis → ATP. A single point on its own will not earn full marks; the logic must be visible.
- Note that pyruvate from glycolysis can still be used by other pathways (e.g. aerobic respiration), but the question is about the lactate-fermentation route that supplies up to 60% of ATP.
Coordination in humans involves two main systems: the nervous system and the endocrine system. Paracrine cell signalling is a third way in which coordination occurs. In paracrine signalling, one cell secretes a chemical that diffuses a short distance to act upon cells that are very near to the secreting cell.
Identify one similarity and one difference between paracrine cell signalling and cell signalling that occurs as part of the endocrine system.
Answer
Similarity: Both use a chemical / signalling molecule (a ligand) released by one cell to act on another.
Difference: In endocrine signalling the chemical (hormone) travels in the blood / circulatory system to reach (distant) target cells, whereas in paracrine signalling the chemical only diffuses a short distance to act on cells that are very close to the secreting cell.
Similarity: both use a chemical signal. Difference: endocrine signal travels in the blood; paracrine signal diffuses a short distance to nearby cells.
Background Concept
Cells in a multicellular organism must communicate to coordinate their activities. Several modes of cell signalling exist, distinguished mainly by the type of chemical used and the distance it travels:
- Endocrine signalling — a gland releases a hormone into the bloodstream, which carries it to distant target cells bearing the appropriate receptor.
- Paracrine signalling — a cell secretes a chemical messenger that diffuses only a short distance through the extracellular fluid to act on cells in the immediate neighbourhood. Local mediators such as histamine, prostaglandins and many growth factors work this way.
- Autocrine signalling — a cell signals itself.
- Juxtacrine signalling — direct cell-to-cell contact.
In every mode, the secreted chemical is a ligand that binds a specific receptor on the target cell, triggering a response inside that cell.
Understanding the Question
The stem of part (a) defines paracrine signalling and contrasts it with endocrine signalling. The command word is "identify", so you simply state the points — you do not need to explain them in detail. The question is worth 2 marks: 1 for the similarity, 1 for the difference.
Approach
Place the two definitions side by side and look for:
- a feature that is shared → similarity
- a feature that clearly distinguishes them → difference
The mode of transport of the chemical is the most obvious distinguishing feature; the use of a chemical signal is the most obvious shared feature.
Step-by-Step Reasoning
- Similarity — both endocrine and paracrine signalling rely on a chemical messenger (a ligand) that is released by one cell and binds to a receptor on a target cell. The shared feature is therefore the use of a chemical signal.
- Difference — the two systems differ in how far the chemical travels. Endocrine hormones enter the bloodstream and are carried around the whole body, while paracrine signals simply diffuse through the tissue fluid for only a short distance before reaching their target cells. The distinguishing feature is the route / distance of travel.
Key Takeaways
- The defining features of any signalling mode are the type of chemical and the distance it travels.
- Endocrine = blood-borne, long-distance; paracrine = local diffusion, short-distance.
- Both rely on a ligand binding a specific receptor on the target cell.
Common Mistakes
- Giving only the similarity (or only the difference) — the question asks for BOTH and the mark scheme awards one mark for each.
- Stating the difference as "endocrine is slower / faster" — the mark scheme rewards the mode of transport (blood vs diffusion) as the key distinguishing point.
- Confusing endocrine signalling with the nervous system. The nervous system uses neurones and is much faster; endocrine signalling uses blood-borne hormones.
Things to Be Careful About
- Use precise biology terms: "chemical", "signalling molecule" or "ligand" are all accepted by the mark scheme; "messenger" on its own is too vague.
- The difference must mention BOTH halves — endocrine travels in the blood AND paracrine diffuses only a short distance — for full credit.
Explain why a neurotransmitter such as acetylcholine could be described as a paracrine signalling molecule.
Answer
Acetylcholine is a chemical released from the presynaptic membrane that diffuses a very short distance across the synaptic cleft (at a cholinergic synapse) or across the neuromuscular junction to act on receptors on the adjacent postsynaptic cell — fitting the definition of a paracrine signalling molecule exactly.
ACh diffuses a short distance across the synaptic cleft / neuromuscular junction to act on an adjacent cell.
Background Concept
Acetylcholine (ACh) is a neurotransmitter released by:
- cholinergic neurones in the central and peripheral nervous systems
- motor neurones at the neuromuscular junction (NMJ)
At the cholinergic synapse, an action potential arriving at the presynaptic terminal opens voltage-gated Ca²⁺ channels. Ca²⁺ influx triggers vesicles containing ACh to fuse with the presynaptic membrane, releasing ACh into the synaptic cleft (a gap of about 20–40 nm). ACh then diffuses across the cleft and binds to nicotinic (or muscarinic) receptors on the postsynaptic membrane, depolarising the postsynaptic cell. Acetylcholinesterase in the cleft rapidly breaks ACh down to terminate the signal.
Understanding the Question
The stem of part (a) defines a paracrine signal as a chemical that "diffuses a short distance to act upon cells that are very near to the secreting cell". You must explain why ACh fits that description. The command word is "explain", so you need both the mechanism and the reason it matches the definition (2 marks).
Approach
Recall the layout of a cholinergic synapse / NMJ and identify the features that match the paracrine definition:
- a chemical (ACh) is secreted;
- it travels by diffusion;
- the distance is very short (the synaptic cleft);
- the target is an adjacent cell.
You must state at least two of these features explicitly to earn both marks.
Step-by-Step Reasoning
- ACh is a chemical secreted by one cell — the presynaptic neurone (or motor neurone at the NMJ) packages ACh into vesicles and releases it into the synaptic cleft when triggered by Ca²⁺.
- It diffuses only a short distance — across the synaptic cleft, which is a very narrow gap (≈ 20–40 nm). The chemical does not enter the bloodstream and is not carried any distance; it simply moves by diffusion to the other side of the cleft.
- It acts on an adjacent cell — the postsynaptic neurone (or skeletal muscle cell at the NMJ), which is the cell immediately next to the secreting cell.
- It matches the paracrine definition because every element of the definition (chemical messenger, short diffusion distance, adjacent target cell) is satisfied.
Key Takeaways
- A neurotransmitter such as ACh is the textbook example of a paracrine signalling molecule.
- The defining feature is the very short diffusion distance — the synaptic cleft — not the nature of the chemical.
- The same logic applies to any neurotransmitter at any chemical synapse.
Common Mistakes
- Stating only that ACh is a "chemical messenger" — you must specifically say it diffuses a SHORT distance, and across what structure.
- Naming the wrong location (e.g. "across the blood" or "across the cell" is wrong). The mark scheme accepts "synapse", "synaptic cleft" or "neuromuscular junction".
- Confusing neurotransmitter release with hormone release — neurotransmitters do NOT travel in the blood.
Things to Be Careful About
- "Synaptic cleft", "synapse" and "neuromuscular junction" are all accepted by the mark scheme. Pick whichever fits the context you want to give.
- ACh binds to a receptor on the postsynaptic membrane; it does not enter the postsynaptic cell.
- The action is local and brief because acetylcholinesterase in the cleft rapidly hydrolyses ACh.
Human muscle cells show paracrine signalling. After muscle cells have been exposed to a substance called palmitate they:
• produce a signalling molecule
• show an increase in the expression of genes involved in a stress response (stress genes).
Scientists carried out three experiments to investigate the signalling molecule produced by muscle cells after they have been exposed to palmitate.
Experiment A
• Muscle cells were exposed to palmitate.
• The palmitate-exposed muscle cells were removed from the medium containing palmitate and then cultured in a nutrient medium for six days.
• The palmitate-exposed cells were removed from the nutrient medium and new muscle cells were placed in this used nutrient medium.
• The expression of stress genes in the new muscle cells was measured after 24 hours.
• A control using cells that had not been exposed to palmitate was also carried out.
Experiment B
Experiment A was repeated but the used nutrient medium for the palmitate-exposed cells and the control was boiled and then cooled before adding the new muscle cells.
Experiment C
Experiment A was repeated but the used nutrient medium from the palmitate-exposed cells and the control was treated to separate the lipid part. This lipid part was added to a new nutrient medium to culture the new muscle cells.
The results are shown in Fig. 2.1.
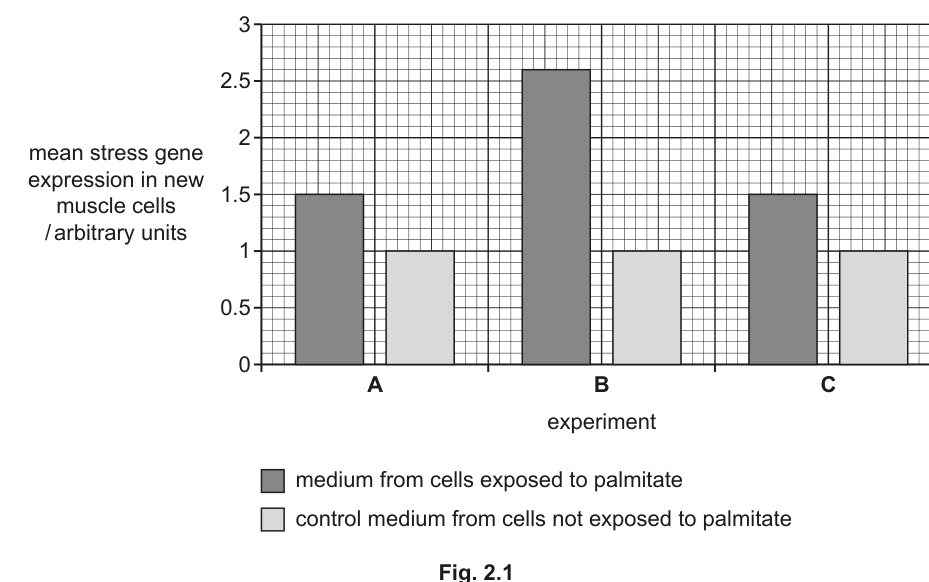
With reference to Fig. 2.1, outline the conclusions that can be drawn about the cell signalling molecule involved in human muscle cell paracrine signalling in response to palmitate.
Answer
- Experiment A: stress gene expression in the new muscle cells is higher (≈1.5) when the medium came from palmitate-exposed cells than from unexposed controls (1.0), so palmitate-exposed muscle cells release / secrete a signalling molecule into the medium that switches on (increases expression of) stress genes in other muscle cells.
- Experiment B: stress gene expression is still higher (≈2.6) after the used medium is boiled, so the signalling molecule is not destroyed by high temperature — it is therefore not a protein (proteins would be denatured by boiling).
- Experiment C: the lipid fraction of the used medium is still able to switch on stress genes (≈1.5 vs 1.0), so the signalling molecule is in the lipid fraction — it is therefore a lipid / lipid-soluble / hydrophobic molecule.
Palmitate-exposed muscle cells release a lipid-soluble, heat-stable (non-protein) signalling molecule that activates stress gene expression in other muscle cells.
Background Concept
Paracrine signalling molecules can be chemically very diverse. The two main classes relevant here are:
- Peptide / protein signals (e.g. many growth factors, cytokines) — these have a defined tertiary structure held together by hydrogen bonds and other weak interactions. They are DENATURED by high temperature: boiling permanently disrupts their 3-D shape so they can no longer bind their receptor.
- Lipid / lipid-derived signals (e.g. steroid-like molecules, eicosanoids such as prostaglandins) — these are small hydrophobic molecules. They have no tertiary structure to disrupt, so boiling does not destroy them, and they partition into the lipid fraction when a mixture is separated by solvent extraction.
A standard test for whether a biological signal is a protein is therefore its heat-stability: if it survives boiling, it is unlikely to be a protein.
Understanding the Question
Part (b) describes three experiments:
- Experiment A shows that the medium in which palmitate-exposed muscle cells have been cultured can switch on stress genes in NEW muscle cells (compared with medium from unexposed cells).
- Experiment B repeats A but the used medium is boiled first.
- Experiment C repeats A but only the lipid fraction of the used medium is applied to new cells.
Fig. 2.1 plots mean stress gene expression in the new muscle cells for each experiment, with the two conditions (palmitate-exposed medium vs control medium) shown side by side.
The command word is "outline" — you should draw out the main conclusions supported by the data, not just describe the bars. The question is worth 3 marks.
Approach
Compare the palmitate bar to the control bar in each of the three experiments and ask:
- Is there a difference? (Yes in all three — the palmitate bar is higher.)
- What does the difference tell us about the signal?
- How does the size of the difference change between experiments, and why?
The key contrasts are:
- A vs B → boiling does not destroy the signal → not a protein
- A vs C → the signal is in the lipid fraction → it is a lipid
Step-by-Step Reasoning
-
Experiment A: the palmitate bar (≈1.5) is higher than the control (≈1.0). The only variable that differs between the two conditions is whether the cells producing the medium were exposed to palmitate. So palmitate-exposed muscle cells must secrete something into the medium that switches on stress genes in fresh muscle cells — the existence of a secreted signalling molecule is confirmed.
-
Experiment B: the palmitate bar is even higher (≈2.6) after boiling, and still well above the control (≈1.0). Boiling denatures proteins by disrupting their tertiary structure. The fact that the signal is still active (in fact, slightly more active) after boiling means it cannot be a protein — it must be heat-stable. The slight rise could be because boiling evaporates water and concentrates the signal, or because boiling destroys an inhibitor originally present in the medium.
-
Experiment C: the lipid fraction alone reproduces the effect (≈1.5 vs 1.0). When the used medium is separated into lipid and aqueous (non-lipid) parts, only the lipid part switches on stress genes. So the signalling molecule must be a lipid, or at least very lipid-soluble / hydrophobic.
-
Putting it together — the signal is a heat-stable, lipid-soluble, non-protein molecule released by palmitate-exposed muscle cells, and it acts on neighbouring muscle cells to switch on stress genes. This is the classic profile of a lipid paracrine mediator.
Key Takeaways
- Heat-stability is the classic discriminator between protein and non-protein signals.
- Lipid signals are not destroyed by boiling and partition into the lipid fraction when a mixture is separated.
- The experimental logic relies on a single-variable-at-a-time comparison: only the medium changes between the palmitate and control conditions within each experiment.
- Always read off the y-axis values when describing a chart — vague phrases such as "the bar is bigger" do not score.
Common Mistakes
- Just restating the chart ("in A the bar is higher") without saying what the result MEANS for the nature of the signal.
- Saying the signal "is a lipid because it survived boiling" — boiling on its own only tells you it is NOT a protein; you need the fractionation result (C) to conclude it IS a lipid.
- Forgetting to mention that the control bars are all at 1.0 — the baseline stress gene expression is the same in all three experiments, so the difference is due to the treatment, not the experiment.
- Confusing the direction: the signal is being produced by the cells that were first exposed to palmitate, and is acting on the NEW cells placed in the used medium.
Things to Be Careful About
- AVP mark — a candidate could earn an extra mark by noting that the signal is even more active after boiling (2.6 vs 1.5), suggesting either concentration of the molecule by evaporation or destruction of an inhibitor. The mark scheme allows any valid additional point.
- The "control medium from cells not exposed to palmitate" is the SAME control in each experiment, which confirms the cells themselves are not producing the signal in the absence of palmitate.
- "Stress gene expression" is measured in arbitrary units; the absolute numbers don't matter, only the relative heights of the bars.
The process of protein translation is inhibited in developing muscle cells when stress genes are expressed.
Suggest how developing muscle cells that express stress genes will differ in structure from normal muscle cells.
Answer
If translation is inhibited, the developing muscle cells cannot make the proteins that build the contractile apparatus, so they will differ from normal muscle cells in having:
- less actin and less myosin (the main thin- and thick-filament proteins);
- less troponin and less tropomyosin (the regulatory proteins of the thin filament);
- fewer and / or smaller sarcomeres and myofibrils, and a less well-developed contractile apparatus.
Less actin, myosin, troponin, tropomyosin → fewer / smaller sarcomeres and myofibrils.
Background Concept
Striated (skeletal) muscle cells are packed with parallel myofibrils, each one a chain of contractile units called sarcomeres. A sarcomere is built from two types of protein filament:
- Thick filaments — made of myosin
- Thin filaments — made of actin, with troponin and tropomyosin bound along the actin helix as regulatory proteins
When Ca²⁺ is released from the sarcoplasmic reticulum during excitation–contraction coupling, it binds troponin, which moves tropomyosin off the myosin-binding sites on actin, allowing cross-bridge cycling and contraction. The energy for cross-bridge cycling and for detaching myosin from actin comes from ATP hydrolysis.
A developing muscle cell is one that is still assembling these contractile proteins and organising them into sarcomeres, so it is highly dependent on active protein synthesis (translation).
Understanding the Question
The stem of part (c) tells you that when stress genes are expressed in a developing muscle cell, translation is inhibited. You are asked to predict the structural consequences in that developing cell compared with a normal developing muscle cell. The command word is "suggest" — you need to reason from the information given (inhibited translation) to specific structural outcomes, using your knowledge of what proteins a muscle cell makes. The question is worth 3 marks.
Approach
Chain the logic:
- Stress gene expression → translation inhibited
- Translation inhibited → less of every protein the cell would normally make
- Muscle-cell-specific proteins (actin, myosin, troponin, tropomyosin) are reduced
- Structures made of those proteins (sarcomeres, myofibrils) are therefore fewer or smaller
Pick the most concrete, mark-scheme-friendly points to make.
Step-by-Step Reasoning
-
Translation makes proteins. If translation is blocked, the ribosomes cannot assemble polypeptides, so the cell cannot produce new protein. The pool of protein in the cell falls, and the cell cannot replace proteins that are turned over.
-
A muscle cell is dominated by a few specific proteins. Actin and myosin together make up the bulk of the contractile apparatus, and troponin and tropomyosin are the regulatory proteins on the thin filament. All of these are made by translation, so all of them will be reduced.
-
Sarcomeres and myofibrils are built from these proteins. With less actin, myosin, troponin and tropomyosin, the cell cannot lay down new sarcomeres as fast, and existing sarcomeres may shrink. The cell will therefore have fewer and / or smaller sarcomeres and myofibrils.
-
Other named proteins — the cell may also have fewer mitochondria (if mitochondrial proteins are reduced), fewer ribosomes (if ribosomal proteins are reduced) and less of the membrane proteins that form the sarcoplasmic reticulum and T-tubules. The mark scheme accepts any one of these as a creditworthy extra point.
-
Net effect on the cell — the developing muscle cell will have an underdeveloped contractile apparatus, with fewer / shorter myofibrils and possibly fewer mitochondria. Functionally it would generate less force and tire more easily, but the question only asks about structure.
Key Takeaways
- Gene expression produces mRNA, and translation turns mRNA into protein. Blocking translation blocks protein synthesis, not just one specific protein.
- Specific cell types are defined by which proteins they accumulate. A muscle cell's defining proteins are actin, myosin, troponin and tropomyosin, which build sarcomeres.
- The mark scheme for "suggest" questions like this rewards ANY specific named protein or structure; there is no single "right" list.
Common Mistakes
- Saying the muscle cell will be "smaller" without naming what is missing — the mark scheme requires specific proteins or structures.
- Confusing the direction of the effect — translation being inhibited means LESS protein, not more.
- Naming molecules that are NOT made by translation (e.g. glycogen, which is a carbohydrate, or lipids). The question is about protein translation specifically.
- Mixing up the levels: saying the cell will have "less DNA" or "fewer genes" — genes are not affected by translation; only their protein products are.
Things to Be Careful About
- "Fewer / smaller" is the right way to describe the change — translation does not necessarily halve every structure, but the trend is clearly downward.
- The cell is a DEVELOPING muscle cell, so it is in the process of building its contractile apparatus. Inhibiting translation is particularly damaging at this stage because there is no large pre-existing protein pool to fall back on.
- AVP: other named proteins that could be reduced include titin, nebulin, dystrophin, the Ca²⁺-ATPase of the sarcoplasmic reticulum, and myosin-binding protein C.
Stomata in leaves respond to changes in environmental conditions by opening and closing. This regulates carbon dioxide uptake and water loss.
Answer
- ions (protons) are actively pumped out of the guard cells, into the cell wall (apoplast).
- The inside of the guard cell becomes more negative / a negative potential develops; ions also enter the cell.
- Voltage-gated channels open and ions enter the guard cells down their electrochemical gradient.
- Solute accumulation lowers the water potential inside the guard cells, so water enters by osmosis (down the water potential gradient).
- The guard cells swell and become turgid, so the stoma opens.
H+ actively pumped out of guard cells → membrane hyperpolarised / Cl- enters → K+ enters via voltage-gated channels → water enters by osmosis → guard cells turgid → stoma opens
Background Concept
Stomata are pores in the leaf epidermis, each flanked by two guard cells. In dicots, guard cells are kidney-shaped with an unusual wall structure: the inner wall (facing the pore) is thicker and less elastic than the outer wall. This asymmetry is crucial — when the cells become turgid, the thin outer wall stretches more than the thick inner wall, so the cells bow apart and the pore opens.
The mechanism of opening is driven by a proton pump (H+-ATPase) in the guard cell plasma membrane. The pump uses ATP to actively transport ions out of the cell into the apoplast. This is the only step requiring metabolic energy. The loss of positive charge hyperpolarises the membrane (makes the inside more negative), which opens voltage-gated channels. ions flow in down their electrochemical gradient, and ions (and malate) also accumulate inside. The rising solute concentration lowers the cytoplasmic water potential, so water enters by osmosis. The guard cells swell and become turgid, and the stoma opens.
Blue light is the main trigger, acting via a receptor (phototropin) that activates the H+-ATPase. A fall in cytoplasmic (as photosynthesis begins) is a co-trigger.
Understanding the Question
"Describe the mechanism by which stomata open in sunlight." The command word describe with 4 marks and the word mechanism signal that the candidate must give a sequential account of cellular events, using precise terminology. The mark scheme rewards the energy-requiring step (H+ pump), the electrical/ionic consequences, K+ uptake, osmotic water entry, and the final turgor that opens the pore.
Approach
Write the steps in their causal order: start with the active step (H+ pump), then the immediate consequence (membrane potential change), then the secondary event that this allows (K+ entry), then the osmotic consequence (water entry), and finally the mechanical outcome (turgor → opening). Use the exact mark-scheme terms: actively pumped, voltage-gated channels, osmosis, turgid.
Step-by-Step Reasoning
- Sunlight activates the H+-ATPase in the guard cell plasma membrane.
- The pump actively transports ions out of the cell into the cell wall. This uses ATP and is the only energy-requiring step.
- The efflux of positive charge makes the inside of the cell more negative (membrane hyperpolarisation). ions may also enter the cell to balance the negative charge inside.
- The negative membrane potential opens voltage-gated channels; ions flow into the cell down their electrochemical gradient.
- The accumulation of (and and malate) lowers the water potential of the guard cell cytoplasm.
- Water enters the guard cells by osmosis from neighbouring cells and the apoplast.
- The guard cells swell and become turgid. Because the inner wall is thicker, the cells bow apart and the stoma opens.
Key Takeaways
- The mechanism is a classic example of structure-function: the asymmetric wall thickening means that turgor translates directly into pore opening.
- It is also a beautiful example of energy conversion: ATP → electrochemical gradient → osmotic gradient → mechanical force.
- The H+-ATPase is the only active step; all subsequent ion movements are passive, down gradients.
Common Mistakes
- Saying is "actively transported" — it is not; moves passively through voltage-gated channels once the membrane is hyperpolarised.
- Saying water enters "by diffusion" — the precise term is osmosis.
- Forgetting the link between H+ pumping and K+ entry: H+ pumping creates the negative potential that opens K+ channels.
- Saying the cells "burst" — they cannot, because the cell wall is intact; they become turgid.
- Omitting turgor entirely — turgor is the immediate cause of stoma opening.
Things to Be Careful About
- The mark scheme accepts "from guard cells" or "into guard cell wall" for H+ movement — either is fine.
- Mentioning entry is an alternative to mentioning the negative potential — both are credit-worthy, but only one is needed for the mark.
- The answer must be a sequence — the order matters. Random lists of points will not earn full marks.
- Do not confuse the direction of ion movement between opening (this part) and closing (covered in part b).
Stomatal conductance is a measure of the rate of water vapour loss from the intercellular air spaces of leaves to the atmosphere through the stomata.
A student investigated the effect of different concentrations of abscisic acid (ABA) on stomatal conductance in Helianthus annuus, the common sunflower.
The student treated the roots of 15 sunflower plants with different concentrations of ABA solution. The plants were left in standardised conditions for 24 hours.
After 24 hours, the student measured:
• the concentration of ABA in the xylem sap of each plant
• the stomatal conductance of the leaves of each plant.
The results are shown in Fig. 3.1.
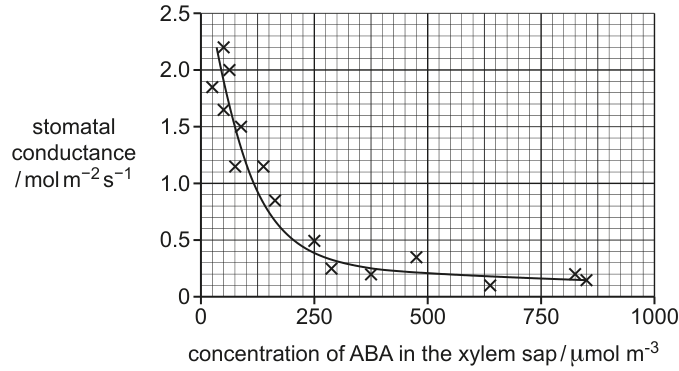
With reference to Fig. 3.1, describe the relationship between the concentration of ABA in the xylem sap and stomatal conductance.
Answer
- There is a negative correlation / inverse relationship: as the concentration of ABA in the xylem sap increases, stomatal conductance decreases.
- For example, at an ABA concentration of ~50 the stomatal conductance is ~2.2 , whereas at ~800 the conductance is only ~0.2 .
- The decrease is not linear: conductance falls steeply between 0 and ~150 ABA, then plateaus at a low value (~0.2 ) above ~400 .
Negative correlation: at ~50 μmol m⁻³ ABA, conductance ≈ 2.2 mol m⁻² s⁻¹; at ~800 μmol m⁻³ ABA, conductance ≈ 0.2 mol m⁻² s⁻¹. Steep decrease up to ~150 μmol m⁻³, plateau above ~400 μmol m⁻³.
Background Concept
Stomatal conductance is a measure of how easily water vapour (and other gases) can pass through the stomata. It depends on the size of the stomatal pores — the wider the pore, the more water vapour diffuses out (transpiration) and the more diffuses in. Guard cell turgor controls pore size: turgid guard cells open the pore; flaccid guard cells close it.
Abscisic acid (ABA) is a plant hormone produced in roots and leaves in response to water stress. It is transported in the xylem from roots to leaves, where it triggers stomatal closure. This reduces transpiration and conserves water when the plant is dehydrated.
Understanding the Question
"With reference to Fig. 3.1, describe the relationship between the concentration of ABA in the xylem sap and stomatal conductance." The command word describe requires the candidate to state the trend in words and to support it with evidence from the graph. The mark scheme requires: (1) the trend, (2) two x-y pairs of figures with units, and (3) a comment on the shape (steep initial decrease, then a plateau).
Approach
First, name the trend (negative correlation / inverse relationship). Then read off two specific x-y pairs with units to support it. Finally, describe the shape of the curve: steep decrease followed by a plateau.
Step-by-Step Reasoning
- Identify the trend: as x (ABA concentration) increases, y (stomatal conductance) decreases. This is a negative correlation.
- Read specific values from the graph to support the trend:
- At ABA ≈ 50 , conductance ≈ 2.2 (the highest data point)
- At ABA ≈ 800 , conductance ≈ 0.2 (the lowest cluster of points)
- Describe the shape of the curve: the decrease is not linear. From 0 to about 150 ABA, conductance drops steeply from ~2.2 down to ~0.7–0.8 . Above about 400 ABA, additional ABA has little further effect; the curve plateaus at a low conductance of ~0.1–0.2 .
- The shape indicates a saturating response — once enough ABA is present to close most stomata, extra ABA cannot close them any further.
Key Takeaways
- Reading values off a graph requires identifying the closest data point and including the units.
- A describe question on a graph always needs the trend (with an appropriate correlation term) AND supporting figures.
- The shape of the curve (here, exponential-decay-like) carries biological meaning: it indicates a saturable receptor response.
Common Mistakes
- Giving a trend without figures (no credit for the supporting point).
- Giving figures without units — the mark scheme requires units at least once.
- Saying the relationship is "linear" — it is clearly non-linear.
- Confusing x and y axes (ABA is x, conductance is y).
- Saying stomatal conductance increases with ABA — this is the opposite of what the graph shows.
Things to Be Careful About
- The mark scheme wants the trend (mp 1) and at least one set of x-y figures with units (mp 2); the shape (mp 3, 4) provides the remaining marks.
- "Negative correlation", "inverse correlation", or "as ABA increases conductance decreases" are all acceptable phrasings.
- Avoid saying "inversely proportional" unless you mean it strictly — the curve is not a strict inverse proportion.
Answer
- ABA binds to a receptor on the plasma membrane of the guard cells.
- This triggers ions to enter the cytoplasm (or to be released from internal stores); acts as a second messenger.
- ions leave the guard cells (through outward-rectifying channels).
- Solute loss raises the water potential of the guard cells, so water leaves by osmosis and the cells become flaccid.
- The stoma closes, so stomatal conductance decreases.
- AVP: at high ABA concentrations the receptors are saturated, so further ABA has little extra effect — this explains the plateau above ~400 .
ABA binds to guard cell receptor → Ca²⁺ enters as 2nd messenger → K⁺ leaves → water leaves by osmosis → guard cells flaccid → stomata close; AVP: receptor saturation explains the plateau.
Background Concept
Abscisic acid (ABA) is a plant hormone that signals water stress. It is synthesised in roots and leaves and travels in the xylem to the guard cells. ABA acts through a receptor (the PYR/PYL/RCAR receptor in the cytosol, with downstream signalling through PP2C and SnRK2 kinases) to trigger the loss of solutes and turgor from guard cells, closing the stomata. This is the reverse of the opening mechanism: instead of going in, goes out; instead of water entering, water leaves; instead of turgor increasing, turgor decreases.
The key second messenger is . ABA binding leads to a rise in cytoplasmic concentration, which activates anion channels that release and malate, depolarising the membrane. This in turn opens outward-rectifying channels, so flows out. The loss of solutes raises the water potential of the guard cells, water leaves by osmosis, and the cells become flaccid.
Understanding the Question
"Suggest explanations for the results shown in Fig. 3.1." The command word suggest means the candidate should apply biological knowledge to explain the data. The graph shows stomatal conductance falling as xylem ABA rises. The mechanism of ABA-induced stomatal closure must be described, and a candidate should also be able to comment on the shape of the curve (the plateau suggests receptor saturation).
Approach
Link the experimental observation (high xylem ABA → low conductance) to the molecular mechanism (ABA receptor binding → rise → efflux → water loss → flaccid cells → closed stomata). The shape of the curve (plateau at high ABA) suggests receptor saturation — this is the AVP.
Step-by-Step Reasoning
- ABA is delivered in the xylem sap from the roots to the leaves.
- ABA binds to specific receptors on (or in) the guard cells.
- This activates a signalling cascade that causes ions to enter the cytoplasm from outside the cell (or from internal stores such as the vacuole or endoplasmic reticulum). acts as a second messenger.
- The rise in cytoplasmic opens anion channels, releasing (and malate). The membrane depolarises.
- The depolarisation opens outward-rectifying channels; ions leave the guard cells down their electrochemical gradient.
- Loss of solutes raises (makes less negative) the water potential of the guard cells, so water leaves by osmosis.
- The guard cells become flaccid, lose turgor, and the stoma closes. This is observed as a fall in stomatal conductance.
- AVP: At very high ABA concentrations the receptors are saturated, so additional ABA cannot cause further closure — this is why the curve plateaus above ~400 .
Key Takeaways
- ABA-induced closure is the reverse of the opening mechanism: leaves rather than enters, water leaves rather than enters, the cells become flaccid rather than turgid.
- is the key second messenger — it is the link between the ABA signal at the membrane and the ion channels that execute the response.
- A saturating curve (plateau) is the signature of a receptor-limited response — a useful general concept.
Common Mistakes
- Saying the guard cells "become turgid" — they become flaccid (the opposite of opening).
- Saying enters the guard cells — it leaves.
- Confusing ABA signalling with auxin or gibberellin signalling — they use different mechanisms.
- Missing the link to the receptor — just saying "ABA causes closure" without the receptor step loses marks.
- Missing the second-messenger role of .
Things to Be Careful About
- The order matters: receptor binding → rise → efflux → water loss → flaccid cells → closed stomata.
- The mark scheme allows up to 5 points plus one AVP; giving 4 of the listed points is enough for full marks.
- "Flaccid" or "less turgid" is acceptable for the final cell state.
- The AVP for the plateau is a strong candidate answer — it explains a feature of the data that the basic mechanism does not.
Some transcription factors increase the rate of transcription of genes involved in the closure of stomata.
State where transcription factors bind to cause an increase in the rate of transcription.
Answer
/ the promoter (region upstream of the gene).
DNA / promoter
Background Concept
Transcription factors are proteins that bind to specific DNA sequences to regulate gene transcription. In eukaryotes, transcription is performed by RNA polymerase II, but it cannot bind to the promoter on its own. General transcription factors (such as TFIID) must first assemble on the promoter to form a pre-initiation complex. Activator transcription factors bind to enhancer sequences (which can be far from the gene) and, through co-activator proteins, increase the rate of transcription.
In the context of this question, the candidate is asked specifically where transcription factors bind to increase transcription. Two answers are credit-worthy:
- DNA — the general answer, since all transcription factors bind DNA.
- promoter — the specific region just upstream of the gene where the transcription-initiation complex forms.
Understanding the Question
"State where transcription factors bind to cause an increase in the rate of transcription." This is a 1-mark state question requiring a single specific term. The mark scheme accepts either "DNA" or "promoter".
Approach
Recognise that the question is asking about the location of the binding site on DNA, not the mechanism. The answer is the specific region of DNA where the transcription factor attaches.
Step-by-Step Reasoning
- Transcription factors are DNA-binding proteins.
- They bind to specific DNA sequences.
- The two acceptable answers are:
- "DNA" — the general answer (all transcription factors bind DNA)
- "promoter" — the specific region where the transcription-initiation complex forms, just upstream of the gene
- The mark scheme accepts either, so a single term is sufficient.
Key Takeaways
- Transcription factors bind DNA at specific sequences (promoters, enhancers, silencers, insulators).
- The term promoter is the most common and precise answer for general transcription factors in eukaryotes.
- This question is a quick recall test of the location of action of transcription factors.
Common Mistakes
- Saying "RNA" — transcription factors bind DNA, not RNA.
- Saying "the gene" or "the chromosome" — too vague; the mark scheme wants a specific DNA region.
- Saying "ribosome" or "nucleus" — wrong location (the nucleus is where transcription happens, but the question is asking about the binding site on DNA).
Things to Be Careful About
- The mark scheme accepts either "DNA" or "promoter" — both are correct.
- The word promoter is sometimes confused with promoter region — either is fine.
- This is part (c) of the question, set in the context of stomata, but the content being tested is transcription-factor biology, not stomata biology per se.
White-clawed crayfish, Austropotamobius pallipes, live in rivers and lakes in Europe.
In the 1850s, the North American signal crayfish, Pacifastacus leniusculus, was introduced to Europe. The introduced species carried a pathogen that causes a disease known as crayfish plague. This disease kills A. pallipes.
Since 1850, the population size of A. pallipes has reduced in many areas of Europe due to the spread of crayfish plague.
North American P. leniusculus can carry the crayfish plague pathogen without showing symptoms because they have evolved resistance to it.
Explain how P. leniusculus could have evolved resistance to the crayfish plague pathogen.
Answer
- A (random / spontaneous) mutation occurred that gave resistance to the crayfish plague pathogen.
- The crayfish plague acted as the selection pressure; crayfish without resistance died.
- Resistant crayfish survived and reproduced, passing the mutation / allele to their offspring.
- Over many generations the frequency of the resistance allele in the population increased (natural / directional selection).
See working
Background Concept
Natural selection is the differential survival and reproduction of individuals in a population because of heritable differences in their traits. It needs three ingredients: heritable variation (produced by random mutation), a selection pressure (an environmental factor that affects survival or reproduction), and differential reproductive success so that favourable alleles accumulate in the gene pool over generations. Disease resistance — in bacteria, insects, plants and animals — is one of the clearest real-world illustrations of this mechanism.
Understanding the Question
The question asks you to explain how the North American signal crayfish Pacifastacus leniusculus evolved resistance to the crayfish plague pathogen, given that these crayfish now carry the pathogen without showing symptoms. Four marks are available and the mark scheme rewards four linked points of the natural-selection narrative.
Approach
Walk through the canonical natural-selection sequence:
- Source of variation — a random mutation.
- Selection pressure — the plague pathogen.
- Differential survival — resistant crayfish survive and reproduce.
- Inheritance — the resistance allele increases in frequency over generations.
Step-by-Step Reasoning
- (Random) mutation produced resistance. Variation in a population originates from spontaneous changes in DNA. In P. leniusculus, a random mutation produced a version of a gene (e.g. one involved in pathogen recognition or immune defence) that conferred resistance. The mutation arose spontaneously — the pathogen did not 'cause' it.
- The plague pathogen acted as the selection pressure. The pathogen reduced the survival and reproductive success of crayfish that lacked the resistance mutation. Those that happened to inherit it had higher fitness when the pathogen was present.
- Resistant individuals survived and reproduced. Because non-resistant individuals died or reproduced less, the resistant crayfish contributed disproportionately to the next generation. The mutation gave a clear selective advantage.
- The resistance allele increased in frequency over generations. Each generation contained a higher proportion of the resistance allele as resistant parents passed it on. Over many generations, the population evolved resistance — this is natural (or directional) selection.
Key Takeaways
- Variation originates from random mutation, not from the environment.
- Natural selection requires heritable variation, a selection pressure, and differential reproductive success.
- Disease / pathogen resistance is a classic example of natural selection in real time.
- The allele (not the individual) changes in frequency across generations.
Common Mistakes
- Saying the pathogen 'caused' the mutation — wrong; mutation is random with respect to need.
- Saying the crayfish 'adapted' or 'got used to' the pathogen — this is Lamarckian inheritance and scores zero.
- Stopping at 'they survived' without stating that the resistance allele is passed on and increases in frequency.
- Vague phrases such as 'evolution happened' without naming the mechanism.
Things to Be Careful About
- The mark scheme explicitly requires the word 'allele' or 'mutation' for the frequency-increase point — avoid writing 'gene' unqualified (a gene is a region of DNA, not a variant).
- Describe the mechanism across generations, not within one individual's lifetime.
- 'Natural selection' or 'directional selection' are both accepted labels for the final point.
It is difficult to locate crayfish because they live underwater.
After an outbreak of crayfish plague in one country in Europe, researchers used an environmental DNA technique to find the locations in a river where populations of A. pallipes were still surviving.
Water samples were taken from locations along the river. Each water sample was filtered to obtain any cells or DNA that had been released by organisms into the water. The polymerase chain reaction (PCR) was carried out on this DNA using primers specific to A. pallipes DNA.
Answer
- Heat to 90–98 °C so that the DNA strands separate (denature).
- Cool to 50–65 °C so that the primers bind (anneal / base-pair) to the complementary sequences flanking the target region.
- Heat to 68–75 °C so that (heat-tolerant) Taq DNA polymerase adds nucleotides, synthesising the new DNA strand.
- The cycle is repeated many times so that the target DNA region is amplified exponentially.
See working
Background Concept
The polymerase chain reaction (PCR) is an in vitro technique that amplifies a specific DNA sequence exponentially. It needs: a DNA template, two short single-stranded DNA primers complementary to the flanks of the target sequence, free deoxynucleotide triphosphates (dNTPs), a heat-tolerant DNA polymerase (Taq, originally isolated from Thermus aquaticus) and a buffer with ions. The reaction is carried out in a thermocycler that rapidly cycles between temperatures. Because each new strand acts as a template in the next cycle, the number of target copies roughly doubles per cycle.
Understanding the Question
The question follows the eDNA workflow used to detect surviving A. pallipes along a river. (b)(i) asks you to outline AND explain the steps of PCR — i.e. for each step you must name both what happens and why that temperature is needed. Four marks are available.
Approach
Recall the three temperature stages and the molecular event at each, plus the reason the cycle is repeated. Present them in the order they occur in the thermocycler.
Step-by-Step Reasoning
- Denaturation (90–98 °C). High temperature breaks the hydrogen bonds between complementary base pairs, separating the double-stranded DNA into two single strands. This temperature is needed to overcome the energy of those hydrogen bonds; without denaturation the primers could not access their target sequences.
- Annealing (50–65 °C). Cooling allows the short synthetic primers to base-pair (anneal) with their complementary sequences at the two flanks of the target region on each single strand. The lower temperature is needed so that primers (which are short) form stable base pairs without the DNA strands simply re-annealing to each other.
- Extension (68–75 °C). Raising the temperature to the optimum for Taq polymerase allows it to add free nucleotides to the 3′ end of each primer, synthesising a new complementary DNA strand. Taq is used because it remains active at the high denaturation temperature; ordinary DNA polymerase would be denatured.
- Repetition. Each new strand acts as a template in the next cycle, so the number of target copies roughly doubles per cycle. Repeating the cycle ~25–35 times produces millions of copies from a single starting molecule — enough DNA to detect.
Key Takeaways
- The three temperatures correspond to denaturation, annealing and extension.
- Taq polymerase is essential because it survives the high denaturation temperature.
- Each cycle roughly doubles the amount of target DNA — amplification is exponential, not linear.
Common Mistakes
- Omitting the temperatures — the mark scheme requires them.
- Saying 'DNA is added' or 'primers are made' — primers are added once at the start.
- Confusing the order (e.g. extension before annealing) — PCR runs hot–cool–warm each cycle.
- Describing 'helicase unwinds the DNA' — wrong; PCR uses heat, not helicase.
- Forgetting to explain WHY each temperature is used (the question says 'outline AND explain').
Things to Be Careful About
- Quote temperatures as ranges (the mark scheme gives 90–98, 50–65, 68–75).
- The mark scheme uses 'denatures / strands separate' for step 1 — 'separate' alone is acceptable.
- The primer-annealing step is sometimes called 'binding' — both are accepted.
Answer
The researchers searched a (named) DNA sequence database (e.g. NCBI / GenBank / Ensembl) using bioinformatics to locate the A. pallipes DNA sequence and design primers complementary to it.
See working
Background Concept
PCR primers are short (~18–25 nt) single-stranded oligonucleotides that must base-pair with the DNA flanking the target region. To design them, you need to know the sequence of the target DNA so that you can choose stretches complementary to the two primer-binding sites. Modern bioinformatics tools compare, annotate and search published DNA sequences in databases such as NCBI GenBank, Ensembl, EMBL-EBI and UniProt, then software such as Primer3 designs suitable primer pairs.
Understanding the Question
Part (b)(ii) asks how the researchers obtained suitable primer sequences for A. pallipes. The parent stem notes that the primers were 'specific to A. pallipes DNA', meaning they had to be designed from prior knowledge of the species' DNA sequence.
Approach
Identify the standard source of primer sequences: an online DNA sequence database accessed via bioinformatics tools.
Step-by-Step Reasoning
- The A. pallipes genome (or at least the relevant gene region) has already been sequenced and deposited in a public database.
- Researchers used bioinformatics (e.g. BLAST searches, Primer3) to locate the sequence and identify short flanking regions that would serve as primer-binding sites.
- The primer sequences were then synthesised commercially.
The mark scheme accepts 'a (named) database / bioinformatics' as the answer.
Key Takeaways
- Primer design depends on prior knowledge of the target DNA sequence.
- Bioinformatics and sequence databases (GenBank, Ensembl, EMBL) underpin modern molecular biology.
Common Mistakes
- Saying 'they read the DNA' — too vague; specify a database or bioinformatics.
- Confusing this with reverse genetics or RNA-seq — irrelevant here.
Things to Be Careful About
- A named database (e.g. GenBank) is acceptable but not required; 'a database / bioinformatics' is sufficient.
The PCR technique used in this research is quantitative. A fluorescent dye binds to the DNA and the fluorescence is monitored throughout the process, showing the quantity of DNA present.
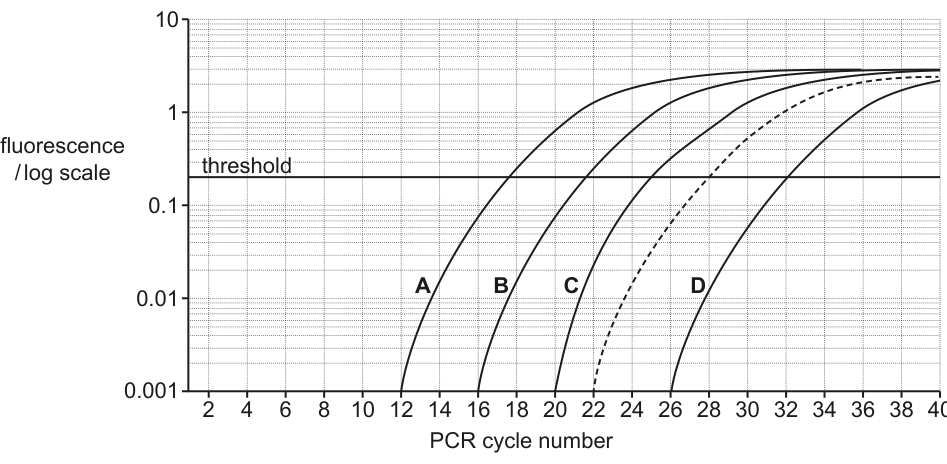
Fig. 4.1 shows standard curves for four known concentrations of DNA, A, B, C and D, and the result obtained for A. pallipes DNA at one location along the river (dotted line).
Answer
A
A
Background Concept
In quantitative PCR (qPCR) a fluorescent dye (commonly SYBR Green) binds to double-stranded DNA and the fluorescence is monitored after each cycle. The fluorescence curve shows a flat baseline phase (signal too low to detect), an exponential phase (the dye-bound DNA doubles each cycle) and a plateau (reagents become limiting). The cycle at which the fluorescence first crosses a fixed 'threshold' is the Ct (cycle threshold). Because each cycle doubles the amount of DNA, the sample that started with the highest concentration reaches the threshold in the fewest cycles.
Understanding the Question
Fig. 4.1 shows four standard curves (A, B, C, D) of known DNA concentrations, plus a dotted line for the A. pallipes sample. The question asks for the letter of the curve with the highest starting concentration. The further LEFT a curve crosses the threshold, the more starting DNA it had.
Approach
Read off which standard curve first reaches the horizontal threshold line at fluorescence . From the figure, curve A crosses the threshold at the lowest cycle number (around cycle 12–13), so curve A had the highest starting concentration.
Step-by-Step Reasoning
- Looking at Fig. 4.1, the four standard curves cross the threshold in the order A (earliest) → B → C → D (latest). The dotted sample line crosses the threshold later still (around cycle 28).
- The earlier a curve crosses the threshold, the more starting DNA was present — because fewer doubling cycles were needed to reach the detectable fluorescence.
- Therefore curve A has the highest starting concentration of DNA.
Key Takeaways
- In qPCR, the cycle threshold (Ct) is inversely related to the starting DNA concentration.
- A standard curve of serial dilutions lets you compare an unknown sample's Ct to known standards and back-calculate the original concentration.
Common Mistakes
- Picking the curve with the highest fluorescence plateau — wrong; the plateau is set by reagent limitation, not starting amount.
- Picking the rightmost curve assuming it has 'more' DNA — it actually started with LESS and needed more cycles to be detected.
Things to Be Careful About
- The fluorescence axis is logarithmic — don't be misled by the shape.
- All curves share the same plateau height by the end, because reagents run out at similar absolute amounts of DNA.
The quantity of A. pallipes DNA reaches a threshold (marked as a horizontal line on Fig. 4.1) at 28 cycles. The DNA in curve C reaches the threshold after 25 cycles. In one cycle of PCR the concentration of DNA doubles.
Calculate the relative difference in the starting concentrations of A. pallipes DNA and the DNA in curve C.
Working
Difference in cycle number = 28 − 25 = 3 cycles.
Each cycle doubles the DNA, so the ratio of starting concentrations is:
The A. pallipes sample had 8 times LESS DNA than curve C (equivalently, curve C had 8 times MORE DNA than the sample).
Answer
8 (times less)
8
Background Concept
In PCR (and qPCR) the amount of target DNA doubles with each cycle, so after cycles the amount is times the starting amount. If two samples reach the same fluorescence threshold but one took more cycles than the other, then the first sample must have started with times MORE DNA than the second (equivalently, the second has times less).
Understanding the Question
You are told the A. pallipes sample reaches the threshold at 28 cycles and curve C reaches it at 25 cycles. You must calculate the relative difference in starting concentrations. The key relationship is that each PCR cycle doubles the DNA.
Approach
Find the difference in cycle number, then raise 2 to that power. The answer is the fold-difference.
Step-by-Step Reasoning
- Cycle difference: cycles.
- DNA doubles per cycle, so the sample that reached the threshold 3 cycles earlier must have started with times more DNA.
- Curve C started with times more DNA than the A. pallipes sample.
- Equivalently, the A. pallipes sample started with 8 times less DNA than C.
Key Takeaways
- PCR is exponential: over cycles.
- The threshold-cycle difference directly gives the fold-difference in starting DNA.
Common Mistakes
- Forgetting to take the difference in cycles first.
- Multiplying rather than raising 2 to the power (e.g. saying '3 × 2 = 6').
- Inverting the answer — stating '8 times more' instead of '8 times less' (or vice versa) without making clear which sample is the reference.
- Saying 'the sample has 8 times the DNA' without specifying relative to what.
Things to Be Careful About
- The mark scheme accepts either '8' alone or '' as the working.
- The question is about RELATIVE difference, not absolute concentration.
- Choose one direction ('times less' or 'times more') and state it clearly; either is correct as long as the direction is unambiguous.
Fluorescent molecules have other uses in gene technology.
Fig. 4.2 shows an agar plate with normal bacteria and genetically modified bacteria. The genetically modified bacteria make a green fluorescent protein.
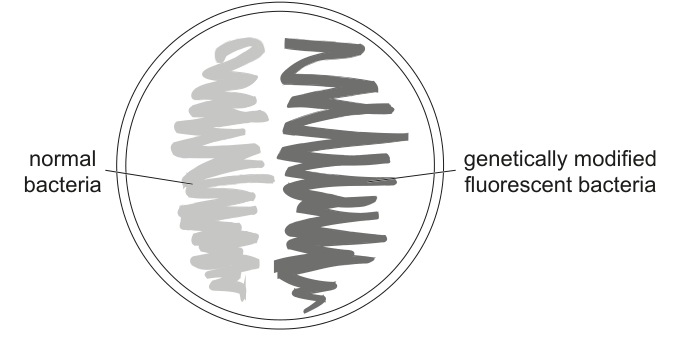
Identify the component that is taken up by normal bacteria to produce the genetically modified bacteria in Fig. 4.2 and state what this component contains to allow the bacteria to make green fluorescent protein.
Answer
- The bacteria take up a plasmid (vector).
- The plasmid contains the gene (DNA) coding for green fluorescent protein (GFP).
- The plasmid also contains a (prokaryotic / bacterial) promoter so that the GFP gene is transcribed by the host bacterium.
See working
Background Concept
Bacteria do not naturally take up whole chromosomes from other species, but they can be persuaded to take up small, circular, self-replicating DNA molecules called plasmids. By inserting a target gene (along with a promoter the bacterium's RNA polymerase can recognise) into a plasmid, the bacterium's own transcription and translation machinery expresses the gene as a protein. The plasmid thus acts as a cloning and expression vector. A selectable marker (often an antibiotic-resistance gene) is usually included so that only transformed bacteria grow on selective agar.
Understanding the Question
Fig. 4.2 shows normal (non-fluorescent) bacteria on the left and genetically modified, fluorescent bacteria on the right of an agar plate. (d)(i) asks: what component do normal bacteria take up to become the GM strain, and what must that component contain for the bacteria to make green fluorescent protein (GFP)?
Approach
Identify the vector (a plasmid), then name the two essential features inside it: the GFP gene itself and a promoter that the bacterium can recognise.
Step-by-Step Reasoning
- The component is a plasmid (vector). Bacteria readily take up plasmids, especially after treatments such as CaCl₂ plus heat-shock or electroporation. The plasmid replicates independently inside the bacterium, copying the inserted gene along with its own DNA.
- It contains the gene (DNA) for green fluorescent protein. The GFP gene originally comes from the jellyfish Aequorea victoria. It codes for a protein that fluoresces green under UV / blue light. Without this gene, the bacterium cannot make GFP.
- It contains a (prokaryotic) promoter. A promoter is the DNA sequence that RNA polymerase binds to in order to start transcription. Bacteria will only transcribe genes downstream of a promoter they recognise. The plasmid must therefore carry a bacterial (prokaryotic) promoter upstream of the GFP gene so that the host's RNA polymerase initiates transcription.
Additional features such as a selectable marker gene (e.g. antibiotic resistance) and restriction sites for inserting the GFP gene are typically also present, but the question only asks what is needed 'to allow the bacteria to make green fluorescent protein'.
Key Takeaways
- A plasmid is a small, circular DNA molecule used as a vector to introduce new genes into bacteria.
- For a bacterium to express a foreign gene, the plasmid must carry the gene itself AND a promoter the bacterium's RNA polymerase can recognise.
- GFP from Aequorea victoria is widely used as a visual marker.
Common Mistakes
- Saying 'a gene' without specifying that it is the GFP gene.
- Forgetting the promoter — without it the bacterium cannot transcribe the gene.
- Confusing 'gene' with 'allele' or 'protein'.
- Saying the bacteria take up 'DNA' generically — too vague; specify a plasmid / vector.
Things to Be Careful About
- The mark scheme requires three explicit points: (1) plasmid / vector, (2) GFP gene, (3) prokaryotic promoter.
- 'Promoter for bacteria' or 'bacterial promoter' is acceptable for the third point.
Suggest why the gene for green fluorescent protein is sometimes transferred in addition to the desired gene in genetic engineering.
Answer
GFP is used as a marker / reporter gene: only bacteria (or organisms) that have successfully taken up the recombinant plasmid will fluoresce, making it easy to identify the genetically modified cells.
See working
Background Concept
A marker (or reporter) gene is a gene whose phenotype is easily detected and which is co-transferred with the gene of interest. Common markers include antibiotic-resistance genes (selection on selective agar) and fluorescent-protein genes (visual identification under UV / blue light). If the marker is expressed, the cell must contain the construct — so the marker tells you whether transformation was successful.
Understanding the Question
Part (d)(ii) asks why the GFP gene is sometimes transferred IN ADDITION to the desired gene. The implication is that GFP is not itself the gene of interest but a tool.
Approach
Recognise that GFP is a marker / reporter. Its purpose is to identify cells that have taken up the plasmid — those cells will glow under UV light.
Step-by-Step Reasoning
- When a plasmid carrying both the gene of interest AND the GFP gene is taken up by a bacterium, the bacterium will express both proteins.
- Under UV / blue light, only successfully transformed bacteria fluoresce green — non-transformed bacteria do not.
- This makes it easy to visually identify and select GM bacteria (or any GM organism) that carry the desired gene.
- It also confirms that the construct is being expressed, not merely carried.
Key Takeaways
- Marker / reporter genes allow rapid identification of successfully transformed cells.
- GFP is a visual marker; antibiotic-resistance genes are selectable markers.
- Co-transferring a marker is a standard element of most genetic-engineering constructs.
Common Mistakes
- Saying 'to make the bacteria glow for fun' — misses the purpose.
- Saying 'so the bacteria produce GFP' without explaining the identification role.
- Confusing a marker gene with a selectable marker (they overlap, but 'marker' is the broader term the mark scheme uses).
Things to Be Careful About
- The mark scheme accepts three phrasings: 'marker / reporter gene', 'identify recombinant organisms', or 'show expression of another transferred gene' — any one is sufficient for the single mark.
Photosynthesis is the energy transfer process that occurs in chloroplasts.
Fig. 5.1 shows some biochemical events that occur in a chloroplast during the light-dependent stage of photosynthesis. Photosystems I and II (PSI and PSII) and some associated proteins of the thylakoid membrane are shown.
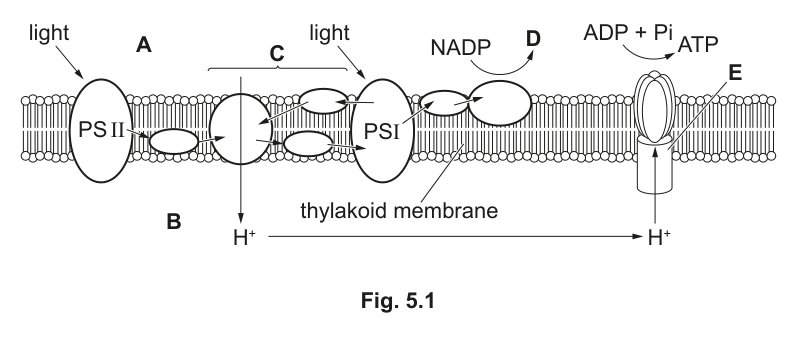
Answer
- A = stroma
- B = thylakoid (lumen / space)
A: stroma; B: thylakoid lumen/space
Background Concept
A chloroplast has two internal aqueous regions separated by the thylakoid membrane. The stroma is the fluid matrix that surrounds the thylakoids and contains the enzymes of the Calvin cycle (including rubisco). The thylakoid space (also called the thylakoid lumen) is the interior of each thylakoid disc, enclosed by the thylakoid membrane. The thylakoid membrane carries the photosystems, electron carriers, and ATP synthase used in the light-dependent stage.
Understanding the Question
The figure shows the thylakoid membrane in cross-section with PSII and PSI embedded in it. Area A lies outside the thylakoid (on the same side as NADP being reduced to product D and ATP being made from ADP + Pi), while area B lies inside the thylakoid (where H⁺ accumulates and from which H⁺ flows back through ATP synthase). The task is to name these two aqueous compartments.
Approach
Match each labelled region to the correct compartment using its position relative to the thylakoid membrane and the events happening on each side: reduction of NADP and ATP synthesis occur on the stromal side; proton accumulation occurs on the luminal side.
Step-by-Step Reasoning
- A is on the side of the thylakoid membrane where NADP is reduced to D (reduced NADP) and where ADP + Pi is converted to ATP by ATP synthase. Both of these reactions occur in the stroma, so A = stroma.
- B is enclosed by the thylakoid membrane and is the region into which H⁺ ions are pumped during electron transport. This is the thylakoid space (also accepted as thylakoid lumen).
Key Takeaways
The stroma and the thylakoid lumen are chemically distinct compartments; the proton gradient that drives ATP synthesis is built up across the thylakoid membrane separating them.
Common Mistakes
Writing "grana" instead of stroma for A (grana are stacks of thylakoids, not the surrounding fluid); calling B "the thylakoid membrane" rather than the lumen/space inside it.
Things to Be Careful About
The mark scheme accepts "thylakoid lumen", "thylakoid space" or simply "thylakoid" (with lumen/space implied) for B — but rejects "inside the thylakoid membrane". Use one of the precise terms.
The group of proteins labelled C, PSI and the protein labelled E are involved in a specific biochemical process during the light-dependent stage of photosynthesis.
Name this specific biochemical process and the protein labelled E.
process ______
E ______
Answer
- Process: cyclic photophosphorylation
- E: ATP synthase
Process: cyclic photophosphorylation; E: ATP synthase
Background Concept
In the light-dependent stage of photosynthesis there are two routes by which electrons can flow. In non-cyclic photophosphorylation electrons pass from water (via PSII) through an electron-transport chain to PSI and finally to NADP, producing both reduced NADP and ATP. In cyclic photophosphorylation only PSI is used: an excited electron leaves PSI, passes through a chain of electron carriers (including an electron-transport complex analogous to the one between PSII and PSI), and returns to PSI. Only ATP is produced — no reduced NADP, no O₂, no photolysis of water. The energy released as electrons flow through the chain is used to pump H⁺ into the thylakoid lumen; the resulting proton gradient drives ATP synthesis as H⁺ flows back through ATP synthase (an enzyme that uses chemiosmotic coupling to phosphorylate ADP).
Understanding the Question
The figure shows PSI, the protein complex C on the stromal side of PSI (which receives electrons from PSI and passes them back), and protein E spanning the membrane with H⁺ flowing through it to make ATP. Note that no electrons are shown leaving to reduce NADP in this loop and PSII is not part of the cycle — this is the diagnostic feature of the cyclic pathway.
Approach
Identify which photosystem(s) the electrons are cycling through and what the membrane protein E (with H⁺ passing through it to make ATP) must be.
Step-by-Step Reasoning
- Electrons leave PSI, pass through complex C, and return to PSI — only PSI is involved, so this is cyclic photophosphorylation (mark 1).
- Protein E sits in the thylakoid membrane, has a channel through which H⁺ flows down their electrochemical gradient from the lumen to the stroma, and is shown making ATP from ADP + Pi as H⁺ passes through. This is the structure and function of ATP synthase (mark 2).
Key Takeaways
Cyclic photophosphorylation is an ATP-only pathway that uses PSI and an electron-transport complex. ATP synthase is the enzyme that uses the proton gradient to phosphorylate ADP.
Common Mistakes
Naming the process "non-cyclic photophosphorylation" (only PSI is used here, and no NADP reduction is shown). Calling protein E "a channel protein" or "a proton pump" — it is specifically ATP synthase; pumps pump H⁺ against the gradient, ATP synthase lets H⁺ flow down the gradient.
Things to Be Careful About
The mark scheme accepts "ATP synth(et)ase" so either spelling is fine. The process mark requires "cyclic photophosphorylation" — do not abbreviate to "cyclic phosphorylation" or describe it in words.
Product D is used during the Calvin cycle.
Identify product D and describe its specific role in the Calvin cycle.
Answer
- D = reduced NADP (NADPH)
- Role in the Calvin cycle: reduced NADP reduces glycerate 3-phosphate (GP) to triose phosphate (TP) by providing hydrogen (and electrons).
D: reduced NADP; it reduces GP to triose phosphate (TP) in the Calvin cycle
Background Concept
The two stages of photosynthesis are linked by ATP and reduced NADP produced in the light-dependent stage. In the light-dependent stage water is split at PSII, electrons flow through the electron-transport chain to PSI, and NADP is reduced to reduced NADP (NADPH) on the stromal side of the thylakoid membrane. Reduced NADP then carries that reducing power into the Calvin cycle, where it is used in the reduction step: CO₂ is first fixed by rubisco onto RuBP to give glycerate 3-phosphate (GP), and GP is then reduced to triose phosphate (TP) using both ATP (to phosphorylate GP) and reduced NADP (to supply the hydrogen). TP can then be used to regenerate RuBP or to build carbohydrates.
Understanding the Question
The figure shows NADP being converted into product D on the stromal side of the thylakoid. The question asks for the identity of D and for its specific role in the Calvin cycle. Three marks are available: one for identification and two for the role.
Approach
Identify D as the reduced form of NADP (NADPH), then state which substrate it reduces and what that substrate becomes. Use the exact Calvin-cycle abbreviations GP and TP that the mark scheme expects.
Step-by-Step Reasoning
- NADP gains electrons and H⁺ in the light-dependent stage to become reduced NADP, so D = reduced NADP (mark 1).
- In the Calvin cycle, the carbon-fixing enzyme rubisco produces GP from CO₂ and RuBP (mark scheme abbreviations).
- Reduced NADP supplies hydrogen (and electrons) to reduce GP, forming TP (mark 2 for reducing GP; mark 3 for forming TP).
Key Takeaways
Reduced NADP and ATP carry the chemical products of the light-dependent stage into the Calvin cycle. Reduced NADP is specifically used in the reduction of GP to TP; ATP is used in the same step and to regenerate RuBP. Together they couple the two stages of photosynthesis.
Common Mistakes
Writing "NADP" without "reduced" — NADP itself is the oxidised form and cannot reduce anything. Saying reduced NADP "provides energy" or "is used in respiration" — it supplies reducing power (hydrogen), not energy directly. Calling the product "glucose" or "G3P" — these are downstream, not the immediate product of this reduction step.
Things to Be Careful About
Use the abbreviations GP and TP exactly as the mark scheme does, and spell "glycerate (3-)phosphate" and "triose phosphate" in full at least once. State both halves of the reduction: GP is reduced TO TP. Don't say reduced NADP "produces" TP — it is a cofactor that reduces GP.
The rate at which plants use photosynthesis to transfer light energy into chemical energy that is stored in plant biomass can be measured in megajoules per square metre per year ().
Fig. 5.2 compares the rates of energy transfer for different ecosystems.
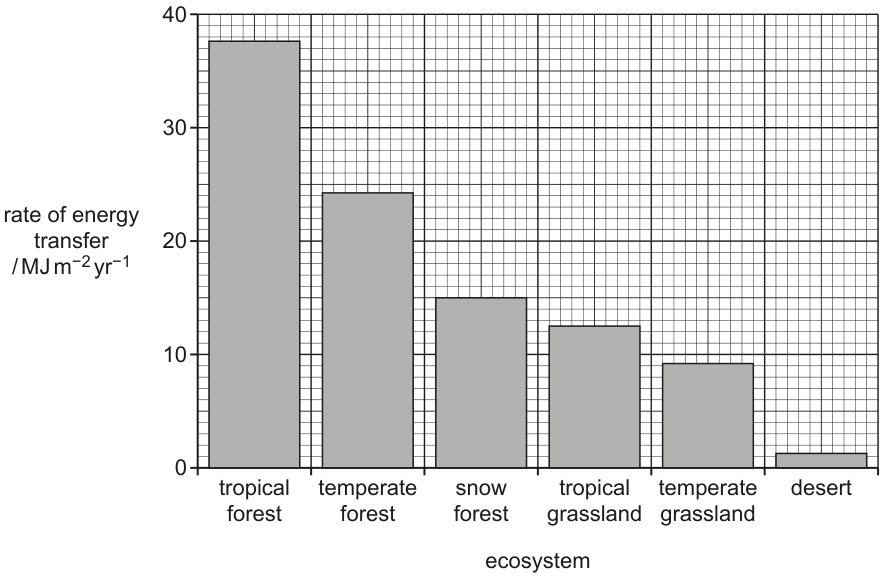
Limiting factors affect the rate of photosynthesis.
Describe and suggest how the results for tropical forest, temperate forest and snow forest in Fig. 5.2 show the effect of limiting factors on photosynthesis.
Answer
- Tropical forest has the highest rate of energy transfer (≈ ), snow forest the lowest of the three forests (≈ ), with temperate forest in between (≈ ).
- Tropical forest has a higher temperature (and a longer growing season) than the cooler forests.
- Tropical forest has a higher light intensity / duration than the cooler forests.
- These differences indicate that temperature and light intensity are limiting factors on photosynthesis.
Rate is highest in tropical forest (≈ 37 MJ m⁻² yr⁻¹) and lowest in snow forest (≈ 15 MJ m⁻² yr⁻¹); tropical forest has higher temperature and light intensity/duration, showing these are limiting factors.
Background Concept
The rate of photosynthesis is limited by whichever environmental factor is in shortest supply relative to demand. The three classical limiting factors are light intensity, carbon dioxide concentration and temperature. Light intensity limits the light-dependent reactions directly; temperature affects the activity of Calvin-cycle enzymes (notably rubisco) and so limits the light-independent reactions; CO₂ concentration limits carbon fixation. When a factor is in short supply, raising the others does not increase the rate.
In real ecosystems, plants experience a combination of all three; the factor that is most different from the optimum controls the local rate. Tropical forests are warm, wet and brightly lit for most of the year; snow forests are cold, with a short growing season and low sun angles for much of that time.
Understanding the Question
Fig. 5.2 shows a bar chart of rate of energy transfer (in ) for six ecosystems. The three forest ecosystems form a clear descending order — tropical forest highest, then temperate forest, then snow forest — and the question asks you to (1) describe that pattern with a paired data quote (i.e. read two values and compare them, including units) and (2) suggest the biological reason in terms of limiting factors.
Approach
First read the chart carefully: tropical ≈ 37, temperate ≈ 24, snow ≈ 15 (units ). Then link each difference to an environmental variable that is biologically limiting — temperature and light intensity are the two variables the mark scheme rewards.
Step-by-Step Reasoning
- D1: rate of energy transfer is highest for tropical forest and lowest for snow forest, with temperate forest in between (mark 1).
- D2: quote paired values with units, e.g. tropical ≈ vs snow ≈ (mark 2).
- S3: tropical forest has the highest temperature of the three; cold temperatures slow enzyme-controlled reactions (mark 3 — S3 if D2 was used; otherwise substitute).
- S4: tropical forest has the highest light intensity and longest growing season, providing more photons per unit area per year (mark 4).
- S5: therefore temperature and/or light intensity are acting as limiting factors on photosynthesis in the cooler forests (mark 5).
Key Takeaways
A bar chart can demonstrate a limiting-factor effect if the only systematic environmental difference along the trend matches a known limiting factor. Reading off paired values with units is an essential skill on these questions, and the conclusion must name the factor.
Common Mistakes
Stating the trend without quoting numbers and units (no mark for D2). Saying "more rainfall" or "more biodiversity" as the cause — neither is a photosynthesis limiting factor. Saying "more plants" in tropical forest — the chart shows per-area energy transfer, so the rate per unit area, not total biomass, is what differs.
Things to Be Careful About
Always quote the units at least once in the answer (the mark scheme requires "with units at least once"). Limit your suggested factors to the three classical limiting factors (light, CO₂, temperature) — extra "explanations" that are not factors will not score.
Suggest reasons why grasslands and desert have a lower rate of energy transfer by photosynthesis than forests.
Answer
- Grasslands and desert have higher rates of transpiration / greater water loss from leaves (because of higher temperature, more wind and/or lower humidity).
- To conserve water, stomata close, which reduces CO₂ entry into the leaf / gas exchange.
- Therefore CO₂ concentration becomes a limiting factor on photosynthesis.
- Grasslands and desert also have fewer / smaller plants and less plant cover, so the total leaf surface area absorbing light is smaller; less light is therefore absorbed.
More water loss → stomata close → CO₂ limiting; fewer/smaller plants → less leaf area → less light absorbed.
Background Concept
Two environmental realities dominate grasslands and desert: water scarcity and open, less productive vegetation. Plants in dry, hot or windy habitats lose water rapidly through their stomata. To conserve water they close their stomata, but in doing so they also restrict the inward diffusion of CO₂ — so the Calvin cycle runs out of carbon substrate and CO₂ becomes a limiting factor even when light and temperature are favourable. In addition, deserts and grasslands support fewer individual plants per unit area, and those plants are often smaller (grasses, scattered shrubs) than forest trees. The total leaf area index is therefore much lower, so the proportion of incoming light actually intercepted by photosynthesis is much smaller. Forest canopies, by contrast, present multiple layers of leaves that together absorb almost all incoming light.
Understanding the Question
The question extends the comparison in Fig. 5.2 from forest-to-forest (5b i) to forests versus the open ecosystems. You must suggest why the open ecosystems have a lower rate of energy transfer by photosynthesis. Three marks are available, taken from a list that includes transpiration, stomatal closure, CO₂ limitation, plant cover, leaf area and light absorption.
Approach
Two parallel arguments both work here:
- Water-loss / CO₂-limitation pathway: open, dry habitats → high transpiration → stomatal closure → CO₂ entry falls → CO₂ becomes limiting → photosynthesis rate falls.
- Plant-cover / light-limitation pathway: open habitats have fewer, smaller plants → less total leaf area per m² → less light absorbed per m² → lower energy transfer per m².
Either pathway alone can score all three marks; combining them strengthens the answer.
Step-by-Step Reasoning
- Mark 1: grasslands/desert have more transpiration / water loss from leaves.
- Mark 2: stomata close, reducing CO₂ entry / gas exchange.
- Mark 3: therefore CO₂ (concentration) becomes a limiting factor.
- Alternative Mark 1: grasslands/desert have fewer plants / smaller plants / less plant cover.
- Alternative Mark 2: this gives a smaller total leaf surface area.
- Alternative Mark 3: therefore less light is absorbed.
Key Takeaways
The rate of photosynthesis per unit area depends both on how efficiently each leaf photosynthesises (limited by CO₂, light, temperature) and on how much leaf area is present per unit ground area. Open ecosystems suffer on both counts: water stress limits the CO₂ supply to each leaf, and sparse vegetation limits the total light intercepted.
Common Mistakes
Saying "because deserts are dry" without spelling out the mechanism (stomatal closure → CO₂ entry falls). Confusing plant biomass with leaf area index — the chart is per m² of ground, not per plant. Saying "less chlorophyll" — chlorophyll per leaf is not the issue; it is total leaf area and stomatal aperture.
Things to Be Careful About
The mark scheme accepts any three from the listed points; an AVP (additional valid point) can be credited. Make sure each sentence carries one distinct idea: don't combine "stomata close" with "CO₂ limiting" into one sentence — the mark scheme treats them as two separate points.
Many different genes are involved in the production of pigments in mammals. One example is the TYR gene.
In humans the TYR gene is located on chromosome 11.
Fig. 6.1 shows the homologous pair for chromosome 11.
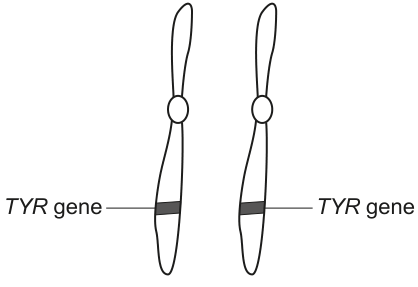
Homologous chromosomes have the same genes located at the same loci.
State one other feature shared by homologous chromosomes.
Answer
The two chromosomes are the same length and the centromere is in the same position.
(Equally acceptable: they show the same banding pattern when stained.)
Same length (or same centromere position, or same banding pattern).
Background Concept
A homologous pair of chromosomes carries the same genes at the same loci — one chromosome inherited from the mother, the other from the father. As well as having the same loci, homologous chromosomes share a number of structural features that allow them to pair up precisely during prophase I of meiosis and to undergo crossing over. The features that define a homologous pair are: same length, same shape, centromere in the same position, and — when chromosomes are stained for karyotyping — the same banding pattern.
Understanding the Question
The stem has already told the candidate that homologous chromosomes share the same genes at the same loci. The question asks for ONE OTHER shared feature. This is a single-mark, single-fact recall item.
Approach
Recall the structural features that define a homologous pair and pick any one that is not already mentioned in the stem. The mark scheme accepts any one of: same size / length, same shape / position of centromere, or same banding pattern.
Step-by-Step Reasoning
The mark scheme offers three acceptable answers; the candidate needs only one. A complete sentence is not required — naming the feature is enough to score the mark. If pressed for the most reliable answer, 'same length' is the textbook definition.
Key Takeaways
- A homologous pair shares: the same genes, the same loci, the same length, the same shape, the same centromere position and the same banding pattern.
- These shared structural features are what allow synapsis and crossing over to occur accurately during meiosis I.
Common Mistakes
- Restating that they have 'the same genes at the same loci' — this is given in the question and gains no credit.
- Writing 'they have the same alleles' — this is incorrect; homologues may carry different alleles of the same gene, which is precisely why they are not identical.
Things to Be Careful About
- The question says 'one other feature', so do not pad the answer with extra features; one mark requires one correct feature.
Albinism in humans can be caused by recessive mutations of the TYR gene.
Explain why a person who is homozygous recessive for the TYR gene shows albinism.
Answer
- The recessive (mutant) allele codes for a faulty / inactive form of the enzyme tyrosinase.
- Without working tyrosinase, melanocytes cannot convert tyrosine into melanin, so no pigment is made.
- The lack of melanin leaves the skin, hair and iris without pigment, producing the albino phenotype.
The recessive allele codes for non-functional tyrosinase, so melanocytes cannot make melanin, leaving skin, hair and iris unpigmented.
Background Concept
The TYR gene codes for the enzyme tyrosinase, which is made inside melanocytes (pigment-producing cells). Tyrosinase catalyses the first step in the pathway that converts the amino acid tyrosine into melanin — the dark pigment that colours skin, hair and the iris. A recessive mutation in TYR usually alters the active site, producing a non-functional enzyme. Because albinism is recessive, a person only shows the phenotype if BOTH copies of the gene carry the mutant allele; one functional copy is enough to make sufficient tyrosinase for normal pigmentation.
Understanding the Question
The stem gives the inheritance pattern (recessive) and asks for an explanation of the MOLECULAR and CELLULAR basis of the phenotype. The command word is 'explain', worth three marks, so the answer must build a chain of reasoning: allele → protein → biochemical product → cell function → tissue phenotype.
Approach
Work outwards from the gene: identify what the protein is, what happens when it is faulty, which cells are affected, which biochemical product is missing, and which tissues show the visible phenotype. The mark scheme rewards any three of the following four points:
- recessive (mutant) allele = faulty / inactive / no tyrosinase
- (melanocytes) do not produce melanin / pigment
- reference to skin / hair / iris
- any valid extra point (AVP) — e.g. tyrosinase converts tyrosine to melanin; both alleles are non-functional so no working enzyme is produced.
Step-by-Step Reasoning
- A homozygous recessive individual has two mutant TYR alleles, so every tyrosinase molecule made is non-functional.
- Without working tyrosinase, melanocytes cannot convert tyrosine into the intermediates that polymerise to form melanin.
- The absence of melanin in skin, hair and iris produces the visible albino phenotype (very pale skin, white hair, pink/red iris because the blood vessels of the eye show through).
The mark scheme accepts any three of the four creditable points; the strongest answer names all of them.
Key Takeaways
- Genes code for proteins; a recessive mutation usually means the protein is non-functional.
- The phenotype (albinism) is the direct consequence of a missing enzyme in a specific cell type (melanocytes).
- This question links genotype → protein → cell biochemistry → tissue phenotype — the classic 'gene expression' chain.
Common Mistakes
- Saying 'the gene is not expressed' — too vague; the mark scheme requires the answer to specify that the protein (tyrosinase) is faulty or absent.
- Saying the person 'cannot make the right colour' — the precise wording is 'cannot make melanin / pigment'.
- Only describing the phenotype ('white skin and hair') without explaining the underlying biochemistry — this loses marks because the question asks to explain.
Things to Be Careful About
- Use the word 'tyrosinase' (the protein the gene codes for); do not substitute vague terms such as 'colour-making protein'.
- Name the cell type (melanocyte) and the tissues affected (skin, hair and iris) to access all three marks.
- 'AVP' on the mark scheme means any other valid biological point — for example, the two recessive alleles mean the heterozygote 'escape' (one working copy) does not apply, so no working enzyme is produced at all.
Fur colour in rabbits involves a number of different genes. Some of these genes interact.
Gene 1 has two alleles, B and b.
• The dominant allele, B, results in black fur.
• The recessive allele, b, results in brown fur.
Gene 2 has two alleles, F and f.
• The dominant allele, F, codes for a protein that allows the expression of gene 1.
• The recessive allele, f, codes for a protein that does not allow the expression of gene 1, resulting in white fur.
The two genes are on different pairs of autosomes.
Complete the genetic diagram for a cross between two black rabbits that are heterozygous for both genes and show the ratio of possible offspring phenotypes.
parental phenotypes: black black
parental genotypes: BbFf BbFf
Punnett square
ratio of offspring phenotypes: ______
Working
parental genotypes: BbFf × BbFf
gametes from each parent: BF, Bf, bF, bf
Phenotype rules (gene 2 is epistatic over gene 1 when homozygous recessive):
- B_ F_ → at least one B AND at least one F → black fur (9 offspring)
- bb F_ → no B, but at least one F → brown fur (3 offspring)
- __ ff → ff masks gene 1 → white fur (4 offspring)
Total = 9 + 3 + 4 = 16 ✓
Answer
9 black : 3 brown : 4 white
9 black : 3 brown : 4 white
Background Concept
Two genes control fur colour in these rabbits. Gene 1 has alleles B (black, dominant) and b (brown, recessive). Gene 2 has alleles F (allows gene 1 to be expressed) and f (prevents expression of gene 1, producing white). This is a classic example of recessive epistasis: when an individual is homozygous ff, the effect of gene 1 is completely masked and the fur is white, regardless of the B/b genotype. Because the two genes are on different (autosomal) chromosomes, they assort independently in meiosis, giving the standard 4 × 4 Punnett square for a dihybrid cross — but the phenotype ratio is modified from the usual 9:3:3:1 to 9:3:4.
Understanding the Question
The stem gives the parental phenotypes (both black) and genotypes (BbFf × BbFf) and asks the candidate to complete a Punnett square already laid out in the question, then state the offspring phenotype ratio. Four marks are available: one for the gametes, two for the offspring genotypes and matching phenotypes in the square, and one for the final ratio.
Approach
- List the four gametes each parent can make (independent assortment gives 2² = 4 gamete types): BF, Bf, bF, bf.
- Fill a 4×4 Punnett square with the 16 offspring genotypes.
- Apply the phenotype rules to each offspring, remembering that ff is epistatic (always white).
- Count the phenotypes and write the ratio in lowest whole numbers.
Step-by-Step Reasoning
Gametes — A BbFf individual makes 4 gamete types because the two genes are on different chromosomes and assort independently: BF, Bf, bF, bf, each at 1/4 frequency.
Punnett square (16 offspring):
| BF | Bf | bF | bf | |
|---|---|---|---|---|
| BF | BBFF (black) | BBFf (black) | BbFF (black) | BbFf (black) |
| Bf | BBFf (black) | BBff (white) | BbFf (black) | Bbff (white) |
| bF | BbFF (black) | BbFf (black) | bbFF (brown) | bbFf (brown) |
| bf | BbFf (black) | Bbff (white) | bbFf (brown) | bbff (white) |
Phenotype rules:
- At least one B AND at least one F → gene 1 is expressed; B is dominant over b → black (9 offspring: BBFF, BBFf ×2, BbFF ×2, BbFf ×4)
- bb AND at least one F → gene 1 is expressed but b is homozygous → brown (3 offspring: bbFF, bbFf ×2)
- ff (any B/b combination) → ff protein blocks expression of gene 1 → white (4 offspring: BBff, Bbff ×2, bbff)
Total: 9 + 3 + 4 = 16 ✓
Ratio: 9 black : 3 brown : 4 white. The 9:3:4 ratio is the diagnostic signature of recessive epistasis, where the recessive homozygous class (ff) masks the effect of the other gene.
Key Takeaways
- When two genes interact, the offspring phenotype ratio is not always 9:3:3:1.
- Recessive epistasis gives a 9:3:4 ratio; the recessive homozygous class (here ff) masks the effect of the other gene.
- Always assign phenotype AFTER writing all 16 genotypes; count by hand and check the total equals 16.
- A Punnett square for a dihybrid cross has 4 × 4 = 16 cells; omitting a row or column loses marks.
- The parental genotypes, the gametes, the square's offspring genotypes, the square's phenotypes, and the final ratio are scored independently — each one is required for full marks.
Common Mistakes
- Forgetting that both parents are heterozygous for both genes, and writing only one or two gamete types — wrong because the genes are on different chromosomes and so assort independently.
- Treating the cross as standard dihybrid and writing the ratio as 9:3:3:1 — the question has a different ratio because of epistasis.
- Writing ff as a phenotype other than 'white' (e.g. 'albino', 'no colour') — the question explicitly states ff produces white fur, so the phenotype must be 'white'.
- Counting errors in the Punnett square (e.g. counting 10 black instead of 9) — careful counting and a check that the total is 16 is essential.
- Forgetting to write the phenotype under each genotype in the square — the mark scheme gives a separate mark for the phenotype row.
Things to Be Careful About
- The mark scheme gives separate marks for: (1) listing all four gametes, (2) the offspring genotypes in the square, (3) the phenotypes written under each genotype, and (4) the final ratio. All four are needed for full marks.
- The ratio must be in the format '9 black : 3 brown : 4 white' (or equivalent) — the 9:3:4 numbers must be stated clearly.
- The genes are on different autosomes, so independent assortment applies; do not attempt a linked-gene cross.
- The question's stem defines 'f' as 'white fur' — never replace this with a different phenotype word.
It has been hypothesised that the mutation rate of an animal species may affect how fast animals of that species age and how long they live (lifespan).
Table 7.1 compares the mutation rate and lifespan of five species of mammal.
Table 7.1
| species | mutation rate per million base pairs per year | mean lifespan / years |
|---|---|---|
| cattle | 0.08 | 20 |
| ferret | 0.20 | 8 |
| horse | 0.05 | 30 |
| human | 0.02 | 75 |
| house mouse | 0.28 | 3.6 |
Answer
As mutation rate increases, lifespan decreases (negative / inverse correlation).
As mutation rate increases, lifespan decreases (negative / inverse correlation).
Background Concept
A mutation rate is the frequency at which new changes in DNA sequence arise in a germline, usually expressed per base pair per year. Mean lifespan is the average number of years an individual of a species lives. When two variables are measured across a number of species and plotted against each other, the resulting pattern is a correlation — a relationship, not a proof of cause. A negative (inverse) correlation means that as one variable increases, the other decreases.
Understanding the Question
Table 7.1 lists five mammal species with two measurements each: a mutation rate (per million base pairs per year) and a mean lifespan (years). The command word is describe, which only requires the candidate to state the trend shown in the data — not to explain why the trend exists.
Approach
Rank the species by mutation rate and see what happens to lifespan:
- human: 0.02 → 75 years
- horse: 0.05 → 30 years
- cattle: 0.08 → 20 years
- ferret: 0.20 → 8 years
- mouse: 0.28 → 3.6 years
As mutation rate rises (0.02 → 0.28), lifespan falls (75 → 3.6). One variable goes up while the other goes down: a negative correlation.
Step-by-Step Reasoning
- The species with the lowest mutation rate (human, 0.02) has the longest lifespan (75 years).
- The species with the highest mutation rate (mouse, 0.28) has the shortest lifespan (3.6 years).
- The intermediate species (horse, cattle, ferret) lie between these extremes in both columns, in the same order.
- Therefore: as mutation rate increases, lifespan decreases. This is the mark-worthy description.
Key Takeaways
- A 'describe' command word only needs the trend and its direction; no causal explanation is required.
- Negative correlation is the correct technical term, and 'as X increases, Y decreases' is the safest phrasing.
Common Mistakes
- Stating only 'they are related' without specifying the direction of the relationship — this does not earn the mark.
- Calling the relationship 'positive' — wrong: as one variable rises the other falls.
- Offering a causal explanation ('mutation causes ageing') when the question only asks to describe the pattern.
Things to Be Careful About
- Describe means what the data show, not why. Keep the answer to the observed pattern.
- 'Inverse' and 'negative' are both acceptable; 'indirect' is not standard and should be avoided.
Use Table 7.1 to explain how these species may differ in the rate at which they can adapt if environmental selection pressures change.
Answer
- A higher mutation rate produces more new (beneficial) alleles / greater genetic variation, increasing the raw material on which selection can act.
- A shorter lifespan means a shorter generation time, so more generations occur per unit time and selection has more opportunities to act.
- Therefore species with a high mutation rate and a short lifespan (e.g. mouse, ferret) can adapt / evolve faster than species with a low mutation rate and a long lifespan (e.g. human, horse, cattle).
Higher mutation rate supplies more beneficial alleles; shorter lifespan gives more generations per unit time; species with both (mouse/ferret) adapt faster.
Background Concept
Evolution by natural selection needs two ingredients: (1) genetic variation in the population, so that some individuals carry alleles better suited to a new environment, and (2) time — measured in generations, since each generation is one round of selection. Mutation is the ultimate source of new alleles; without it, selection has nothing new to act on. The number of generations per unit time is the inverse of the mean generation time, and for mammals this scales closely with lifespan.
Understanding the Question
The data in Table 7.1 show two features that both vary across the five species. The command word is explain, so the answer must connect these features to a biological outcome — the rate at which each species could adapt if the environment changed. The mark scheme offers five acceptable points and three marks are available.
Approach
- Ask: what does each of the two variables (mutation rate, lifespan) contribute to adaptation?
- mutation rate → new alleles / new genetic variation
- lifespan → generation time → number of generations per year
- Combine: a species high in both adapts fastest because it both generates more variation and tests it more often.
- Then apply to the named species in the table.
Step-by-Step Reasoning
- Point 1 (mutation → variation). A higher mutation rate per base pair per year means more new DNA changes arise in the germline each generation. This raises the standing genetic variation in the population and increases the chance that a beneficial allele — one conferring, say, resistance to a new pathogen or a new food source — will appear. Without such an allele, selection has nothing to favour and adaptation cannot occur.
- Point 2 (lifespan → generations). A shorter mean lifespan (e.g. mouse at 3.6 years) means a shorter generation time and therefore more generations per year than a long-lived species (e.g. human at 75 years). Each generation is one cycle of selection: the better-adapted individuals leave more offspring. The more cycles per unit time, the faster allele frequencies can change in response to a new selection pressure.
- Point 3 (combining the two). Mouse and ferret have both the highest mutation rates and the shortest lifespans, so they have the most new variation and the most generations in which selection can act on it. They are predicted to adapt fastest. Cattle, horse and human have low mutation rates and long lifespans, so they should adapt more slowly. The two effects compound.
- An additional valid point (AVP) would be to note that small effective population sizes can sometimes reduce the benefit of high mutation rates (drift can eliminate new variants), but this is not required.
Key Takeaways
- Rate of adaptation ≈ (supply of new beneficial alleles) × (number of generations per unit time) that selection can act on.
- Mutation rate supplies the alleles; lifespan determines the number of selection cycles per year.
- Mouse/ferret should evolve faster than cattle/horse/human when environments change.
Common Mistakes
- Only mentioning mutation rate or only mentioning lifespan, without linking both to adaptation.
- Saying 'they have more mutations' without stating that this gives more genetic variation / more alleles / more chance of a beneficial allele.
- Failing to make the final link to 'adapt / evolve faster'.
- Naming only 'mouse' when both mouse and ferret satisfy the criteria.
- Confusing the direction: saying species with high mutation rates adapt slower (they do not — the mark scheme explicitly says the opposite).
Things to Be Careful About
- Three distinct ideas are needed for three marks: variation, generation time, and the combined prediction of faster adaptation.
- 'Genetic variation', 'alleles' and 'beneficial allele' are the precise terms the mark scheme credits.
Compare the timescales needed for selective breeding and genetic engineering to increase the frequency of a rare allele in cattle. Give a reason for your answer.
Answer
Comparison: Genetic engineering is faster than selective breeding at increasing the frequency of a rare allele in cattle.
Reason: Selective breeding increases the allele frequency gradually over many generations, whereas with genetic engineering the desired allele can be introduced into embryos and all cows can act as surrogate mothers, so the allele frequency can be increased dramatically in a single generation.
Genetic engineering is faster than selective breeding because selective breeding requires many generations, whereas genetic engineering can use all cows as surrogate mothers in a single generation.
Background Concept
Selective breeding is the traditional method of changing the genetic makeup of a population: the breeder identifies individuals with the desired trait, allows only those individuals to reproduce, and repeats the process generation after generation. Each generation produces only a small shift in allele frequency because inheritance is halved at every cross and the chosen parents may not be homozygous. Genetic engineering inserts a chosen allele directly into fertilised eggs (or early embryos), which are then transferred into surrogate mothers. The engineered individuals carry the allele in the heterozygous state at minimum, and breeding from them in a single subsequent generation can fix it.
Understanding the Question
The stem defines the task precisely: compare the timescales needed for selective breeding and for genetic engineering to raise the frequency of a rare allele in cattle, and give a reason for the comparison. Two marks are available — one for the comparison and one for the reason. The candidate must therefore make an explicit comparative statement and then justify it.
Approach
- Recall the reproductive biology of cattle: one calf per pregnancy, ~9-month gestation, puberty at ~1 year. So a generation is at least a year, and increasing an allele from rare to common by selecting parents typically needs many generations.
- Recall the GE route: an allele can be inserted into many embryos at once, and every cow in the herd can be implanted with an engineered embryo.
- The timescale gap is therefore many generations (selective breeding) versus one generation (GE), i.e. decades versus months.
Step-by-Step Reasoning
- C1 — comparison. Genetic engineering is faster than selective breeding at increasing the frequency of a rare allele in cattle.
- R2 — generation-time reason. Selective breeding acts on the existing allele frequency generation by generation; in cattle, a generation is at least one year, so even under intense selection it takes many years (often decades) to shift a rare allele to a useful frequency.
- R3 — surrogate-mother reason (alternative). With genetic engineering, a single allele can be inserted into many embryos in the laboratory and all of the cows in the herd can be used as surrogate mothers, each carrying an engineered calf to term. This raises the frequency of the allele in the next generation dramatically — potentially from rare to majority in one step.
- Either R2 or R3 (or both) earns the second mark. R3 is the more striking reason and is the one the mark scheme highlights first.
Key Takeaways
- Selective breeding is slow because each generation produces only a small, statistical change in allele frequency.
- Genetic engineering is fast because it bypasses the need for natural or selected reproduction — surrogate mothers multiply the engineered embryos in parallel.
- The comparison and a reason are both required for full marks.
Common Mistakes
- Stating only that 'GE is faster' with no justification — the comparison earns one mark but the reason mark is lost.
- Giving the wrong direction ('selective breeding is faster') — the rare allele would have to be concentrated by slow, gradual selection, which is the very thing GE avoids.
- Confusing the timescale: in cattle a generation is roughly a year, so 'many generations' is many years, not many weeks.
- Saying 'GE is faster because it is more accurate' — accuracy is not what makes it faster; it is the parallel use of surrogates / avoidance of generations.
Things to Be Careful About
- Two distinct ideas for two marks: comparison, then reason.
- A valid reason must be biological (generations, surrogates), not vague ('because it is modern' is rejected).
Genetic engineering could be used to improve farmed animals, such as dairy cattle.
State two features of dairy cattle that could be improved by genetic engineering.
Answer
Any two from:
- quality of the milk (e.g. higher protein or butterfat content, or altered milk composition such as A2 casein)
- quantity / yield of milk per lactation
- disease resistance (e.g. resistance to mastitis)
- feed conversion efficiency / growth rate
- longevity of productive life
Two of: milk quality; milk yield; disease resistance; growth rate / feed conversion efficiency.
Background Concept
Genetic engineering of farmed animals aims to introduce alleles that improve commercially important traits. For dairy cattle the most economically valuable outputs are the milk itself (its composition and the volume produced per cow per lactation) and the health and longevity of the cow (which affect how many lactations she completes in her lifetime). Disease resistance is a major target because infection (especially mastitis — inflammation of the udder) is one of the largest costs in dairy farming.
Understanding the Question
The stem names the context: genetic engineering of dairy cattle. The command word is state, so the candidate simply needs to name two features — no explanation is required. Two marks are available.
Approach
Ask 'what makes a dairy cow profitable to a farmer?' The answer falls into three broad buckets:
- What comes out of her — quantity and quality of milk.
- What keeps her healthy — resistance to common, costly diseases.
- How efficiently she converts feed into milk — growth rate and feed conversion efficiency.
Any two of these (or a more specific sub-feature) earn the marks.
Step-by-Step Reasoning
- Milk quality. This covers the composition of the milk — higher protein or butterfat content, altered casein profile, reduced lactose for low-lactose milk, or the presence of added beneficial compounds. The mark scheme credits 'quality of milk' (or quality of the animal) without requiring a specific example, but a specific example strengthens the answer.
- Milk quantity / yield. Volume of milk per lactation is the most direct measure of dairy productivity. Engineering cows to produce more milk per day or per lactation is a well-established target.
- Disease resistance (AVP). Mastitis resistance is the most common example, but resistance to bovine tuberculosis, tick-borne diseases or other endemic infections are all valid.
- Growth rate / feed conversion efficiency (AVP). Faster growth or more efficient use of feed reduces the cost per litre of milk and shortens the time to first lactation.
- Any two distinct, plausible features earn both marks.
Key Takeaways
- Dairy cattle improvement targets either the product (milk) or the producer (cow health/efficiency).
- 'Quality' and 'quantity' are the two simplest, most general terms the mark scheme accepts.
- A specific example is not required but is rewarded (an AVP).
Common Mistakes
- Naming traits that apply to beef cattle (e.g. 'meat quality', 'carcase conformation') rather than dairy cattle — the question specifies dairy.
- Vague answers such as 'make them better' or 'improve them' — these do not name a feature and score zero.
- Repeating the same idea in two forms (e.g. 'more milk' and 'higher milk yield' are the same feature and would earn only one mark).
- Naming a feature that genetic engineering could not realistically target in cattle (e.g. 'intelligence' is not a commercial target).
Things to Be Careful About
- Two distinct features are needed for two marks.
- Keep the answer focused on dairy, not beef, traits.
- 'State' means a short, named feature — no explanation is required or expected.
Bears are several species of mammal in the family Ursidae.
Climate change and loss of habitats due to human activity have reduced the size of some bear populations in recent years.
The International Union for Conservation of Nature (IUCN) has a role in the conservation of species, such as species of bear.
Outline the role of the IUCN in the conservation of species.
Answer
Any three from:
- Assesses / categorises / ranks species by their threat level / conservation status.
- Maintains the Red List of Threatened Species.
- Influences / advises countries, governments and policy makers on conservation.
- Educates the public / raises awareness of conservation issues.
- Promotes the sustainable use / management of natural resources.
See working.
Background Concept
The International Union for Conservation of Nature (IUCN) is the world's largest and oldest global environmental organisation. It provides scientific information and assessment of the conservation status of species, habitats and ecosystems, and it influences international, national and local conservation policy. Its most publicly visible activity is the maintenance of the IUCN Red List of Threatened Species, which classifies species into categories such as Least Concern, Near Threatened, Vulnerable, Endangered, Critically Endangered, Extinct in the Wild and Extinct.
Understanding the Question
Part (a) is a 3-mark "outline" question — it requires a short, organised account of the main activities the IUCN carries out in conserving species such as bears. The mark scheme allows the candidate to choose any three points from a list of five, so the candidate simply needs to cover three distinct credible roles.
Approach
List the major, distinct activities of the IUCN: (1) assessment/listing using the Red List, (2) advising governments and shaping policy, (3) education/awareness, (4) promoting sustainable use, (5) supporting on-the-ground conservation. Pick three that are clearly different and supported by the mark scheme.
Step-by-Step Reasoning
The mark scheme credits the following five points, of which any three earn the 3 marks:
- Assess / categorise / rank species by their threat level or conservation status — the IUCN does this for tens of thousands of species.
- Reference to the Red List (of Threatened Species) — the IUCN's flagship publication, which classifies each species into one of the threat categories.
- Influence / advise countries, governments and policy makers — the IUCN produces guidelines that are used in international agreements (e.g. CITES listings, national wildlife legislation).
- Educate / raise awareness — through publications, campaigns and media output about biodiversity loss.
- Promote sustainable use / management of (natural) resources — e.g. its work on sustainable forestry, fisheries and protected-area management.
A response naming any three of these (with the precise biological vocabulary the mark scheme requires) scores full marks.
Key Takeaways
- The IUCN's central role is assessment, and its central publication is the Red List.
- Beyond listing species, the IUCN advises governments and educates the public, and promotes sustainable use of natural resources.
- "Outline" style questions reward distinct, bullet-style points — each point should describe a separate activity.
Common Mistakes
- Writing vague statements such as "they help save animals" without naming the specific IUCN activity — this gains no credit.
- Confusing the IUCN with other conservation bodies such as WWF, CITES or national parks services.
- Repeating the same idea in different words (e.g. "they assess species" and "they rank species") — this only earns one mark.
Things to Be Careful About
- "Outline" means a brief, organised account — long narrative is unnecessary and risks missing the precise terminology.
- Stick to roles genuinely performed by the IUCN rather than general "conservation" actions (e.g. captive breeding is the role of zoos, not the IUCN).
Grizzly bears, Ursus arctos horribilis, and polar bears, Ursus maritimus, are found in North America.
Fig. 8.1 shows a grizzly bear and a polar bear.
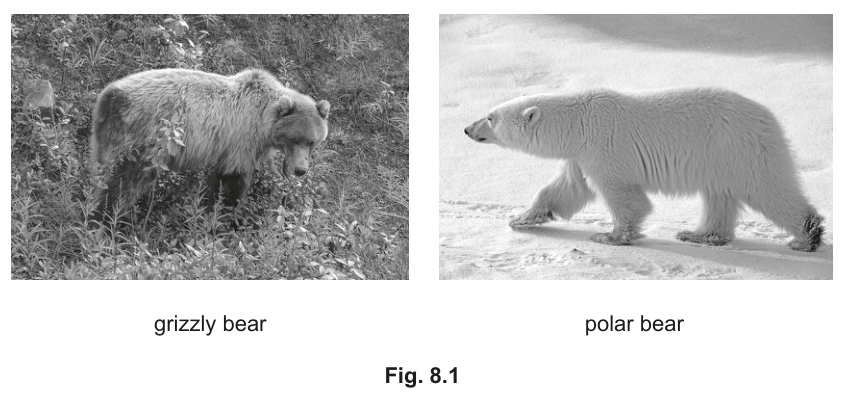
Grizzly bears have:
• a varied diet that includes grasses, roots, berries, nuts, rodents, insects and fish
• a habitat of woodland or grassland
• a maximum mass of 270 kg.
Polar bears have:
• a diet that consists of other animals, such as seals
• a habitat of land and sea ice
• a maximum mass of 450 kg.
Climate change has caused populations of grizzly bears to spread further north and populations of polar bears to spread further south. In some areas there is habitat overlap and, on rare occasions, breeding between grizzly bears and polar bears has occurred.
The offspring of grizzly bears and polar bears are known as pizzly bears.
Pizzly bears can breed together in the wild.
Fig. 8.2 shows a pizzly bear.
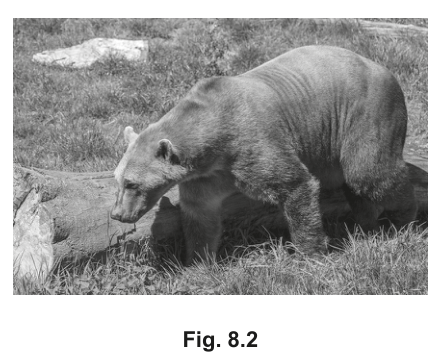
With reference to three different species concepts, discuss whether grizzly bears and polar bears should be classified as separate species.
Answer
Biological species concept
- Grizzly bears and polar bears are NOT separate species because they can interbreed in the wild to produce fertile offspring (pizzly bears), which can themselves breed together. They are therefore not reproductively isolated.
Morphological species concept
- Grizzly bears and polar bears ARE separate species because they show clear morphological differences: fur colour (brown vs white), body size / mass (max 270 kg vs max 450 kg), and the size of the shoulder hump. Fig. 8.1 shows these visible differences.
Ecological species concept
- Grizzly bears and polar bears ARE separate species because they occupy different ecological niches: they have different diets (varied omnivore vs carnivore feeding mainly on seals) and different habitats (woodland/grassland vs land and sea ice).
Conclusion
- Different species concepts give different answers. Under the biological concept they are one species, but under the morphological and ecological concepts they are two species. This shows that species classification depends on which species concept is applied.
See working — conclusion depends on species concept applied.
Background Concept
There is no single, universally agreed definition of "species"; instead, biologists use several species concepts, each capturing a different aspect of what makes populations distinct. The CIE syllabus requires familiarity with:
- Biological species concept — a species is a group of organisms that can interbreed to produce fertile offspring, and which is reproductively isolated from other such groups.
- Morphological species concept — a species is a group of organisms that share a distinct set of physical (morphological) features and differ from other such groups.
- Ecological species concept — a species is a group of organisms that occupy a distinct ecological niche (a particular combination of habitat, diet and role in the ecosystem).
- Genetic / phylogenetic species concept — a species is a group with a distinct gene pool or evolutionary lineage (requires DNA sequence or other genetic data).
Different concepts often give different answers in borderline cases, such as the grizzly–polar bear hybridisation described here.
Understanding the Question
Part (b) is a 6-mark "discuss" question that provides a real biological case study — climate-change-induced range overlap between Ursus arctos horribilis (grizzly) and Ursus maritimus (polar), with documented hybridisation producing fertile "pizzly" offspring. The candidate must apply three different species concepts and reach a judgement in each case. The mark scheme credits six points drawn from four concepts (biological, morphological, ecological, genetic/phylogenetic); the candidate should pick the three concepts that produce the most coherent discussion.
Approach
Treat each species concept as a separate mini-argument. State (i) what the concept says, (ii) what evidence in the question supports it, and (iii) the conclusion it leads to. Aim for two clear marks per concept: one for the judgement and one for the supporting evidence. End with a short synthesis acknowledging that different concepts yield different answers.
Step-by-Step Reasoning
Biological species concept
- Definition: organisms belong to the same species if they can interbreed to produce fertile offspring.
- Evidence in question: grizzly and polar bears have produced pizzly bears in the wild, and pizzly bears can themselves breed.
- Conclusion: under this concept they are NOT separate species — they are the same species because they are not reproductively isolated.
- Mark scheme credits points 1 and 2 here.
Morphological species concept
- Definition: species are distinguished by their observable physical features.
- Evidence in question: grizzly bears are brown-furred with a maximum mass of 270 kg, while polar bears are white-furred with a maximum mass of 450 kg and a different body shape (smaller hump, longer neck). Fig. 8.1 shows these visible differences clearly.
- Conclusion: under this concept they ARE separate species because of distinct morphology (colour, size, mass, hump).
- Mark scheme credits points 3 and 4 here.
Ecological species concept
- Definition: species are groups that occupy a distinct ecological niche.
- Evidence in question: grizzly bears occupy woodland/grassland habitats and are omnivores (grasses, roots, berries, nuts, rodents, insects, fish); polar bears live on land and sea ice and are carnivores (mainly seals).
- Conclusion: under this concept they ARE separate species because their niches (habitat and diet) differ.
- Mark scheme credits points 5 and 6 here.
Optional fourth concept — genetic/phylogenetic
- Evidence in question: no DNA sequence or other genetic data is provided.
- Conclusion: cannot judge — we don't know how genetically similar they are.
- Mark scheme credits this as an alternative valid AVP; useful if the candidate wants to show that data is missing.
Synthesis
Different species concepts lead to different classifications of the same pair of populations. This illustrates that "species" is a human-imposed category and that real biological cases can sit awkwardly between concepts, particularly when recent evolutionary divergence is combined with ongoing gene flow.
Key Takeaways
- A "species" depends on the species concept used; the same pair of populations can be one species or two depending on the lens.
- The biological species concept depends on reproductive isolation, the morphological concept on visible features, the ecological concept on niche, and the phylogenetic concept on genetic data.
- Hybrid zones such as the grizzly–polar bear case illustrate the practical limitations of applying a single rigid definition.
Common Mistakes
- Applying only one concept (e.g. only the biological one) and ignoring morphological and ecological evidence — the question requires reference to THREE different concepts.
- Saying "they are different species because they look different" without naming the concept being used.
- Stating "they cannot interbreed" — the question states that they have produced fertile pizzly bears, which is direct evidence to the contrary.
- Confusing the polar bear/grizzly bear classification with the unrelated distinction between grizzly bear, Kodiak bear and brown bear subspecies.
- Failing to reach a balanced conclusion when concepts disagree.
Things to Be Careful About
- "Discuss" means present both sides; the candidate should explicitly state "under concept X they ARE/NOT separate species because …" for each concept.
- Be precise about which trait supports which concept (e.g. colour and mass support morphological; diet and habitat support ecological).
- A concluding statement that recognises the disagreement between concepts is a strong, integrative finish.
Human activity has disturbed the habitat of many populations of spectacled bear, Tremarctos ornatus. The spectacled bear feeds on a variety of plant and animal species.
Scientists compared the diversity of the food eaten by two populations of spectacled bear by analysing their faeces. One population lived in an undisturbed habitat and the other population lived in a habitat that had been disturbed by road building.
The scientists analysed the faeces from 60 bears in each population. They identified the species present and the number of individuals of each species in the faeces.
The scientists calculated the diversity of species in the faeces of the two populations using Simpson’s Index of Diversity.
The formula for Simpson’s Index of Diversity is:
= number of individuals of each species present in the sample
= total number of all individuals of all species
Table 8.1 shows the results and some of the steps for calculating the value for the disturbed population.
Table 8.1
| species eaten by bear | number of individuals | ||
|---|---|---|---|
| Gracilinanus aceramarcae | 3 | 0.048 | 0.002 |
| Oligorizomys sp. | 5 | 0.081 | 0.007 |
| Hesperomeles cuneata | 4 | 0.065 | 0.004 |
| Puya atra | 28 | 0.452 | 0.204 |
| Vaccinium floribundum | 2 | 0.032 | 0.001 |
| Pernettya prostrata | 8 | 0.129 | 0.017 |
| Gaultheria hapalotricha | 12 | ……… | ………. |
| total | 62 | ………. |
Calculate Simpson’s Index of Diversity by completing Table 8.1 in the spaces provided.
Write the value for Simpson’s Index of Diversity on the dotted line.
Simpson’s Index of Diversity () = ______
Working
For Gaultheria hapalotricha:
Total :
Simpson's Index of Diversity:
Answer
| species | |||
|---|---|---|---|
| Gracilinanus aceramarcae | 3 | 0.048 | 0.002 |
| Oligorizomys sp. | 5 | 0.081 | 0.007 |
| Hesperomeles cuneata | 4 | 0.065 | 0.004 |
| Puya atra | 28 | 0.452 | 0.204 |
| Vaccinium floribundum | 2 | 0.032 | 0.001 |
| Pernettya prostrata | 8 | 0.129 | 0.017 |
| Gaultheria hapalotricha | 12 | 0.194 | 0.037 |
| total | 62 | 0.272 |
Simpson's Index of Diversity () = 0.728
D = 0.728
Background Concept
Simpson's Index of Diversity is one of several diversity indices used in ecology to summarise how many different species are present in a sample and how evenly their individuals are distributed. It ranges from 0 (lowest diversity — all individuals belong to a single species) up to a maximum approaching 1 (very high diversity, with many evenly represented species).
The formula is:
where is the number of individuals of one species and is the total number of individuals across all species. Subtracting the sum from 1 converts a "dominance" measure (large when one species dominates) into a "diversity" measure (large when no species dominates).
Understanding the Question
Part (c)(i) is a 3-mark calculation. The candidate is given a partially completed table for the disturbed population, with one row (Gaultheria hapalotricha) and the total still to complete, and must finish the calculation to obtain . The undisturbed population is given later for comparison.
Approach
Three steps, each worth a mark:
- Compute for Gaultheria hapalotricha (and its square).
- Sum all the values.
- Subtract the sum from 1 to give .
Show working clearly so each step is visible to the examiner.
Step-by-Step Reasoning
Step 1 — proportions for Gaultheria hapalotricha
With and :
Squared:
Step 2 — sum of
Adding the seven squared proportions:
Step 3 — Simpson's Index
Sanity check — the disturbed population is dominated by Puya atra (28 of 62 individuals ≈ 45%), so should be well below 1; 0.728 is consistent with moderate-to-low diversity. By contrast, the undisturbed population has , indicating more even representation across species — consistent with the biological expectation that undisturbed habitat supports more diverse feeding.
Key Takeaways
- Simpson's Index uses individuals (not just species counts) — so a community with one super-abundant species scores lower than a community with several evenly represented species, even if both have the same species richness.
- is dimensionless and bounded between 0 and 1.
- The arithmetic is straightforward but each step (proportion, square, sum, subtract) must be shown explicitly to earn the marks.
Common Mistakes
- Using the species richness (number of species = 7) instead of the formula — this is not Simpson's Index and scores 0.
- Forgetting to square the proportion, or summing the proportions instead of the squared proportions.
- Rounding too early — squaring 0.19 instead of 0.194, which gives a slightly different total.
- Misreading — the total is 62, not 60 (60 bears were sampled but the total individuals across all food species is 62 because some faeces contained more than one prey item, or some contained none — the mark scheme uses 62).
- Reporting as a percentage, or with units — has no units and lies between 0 and 1.
Things to Be Careful About
- Match the precision given in the question (the other squared proportions are given to 3 decimal places), so report to match the mark scheme.
- Round only the final displayed value, not intermediate workings.
- The total in the final row is the sum of the column only — do not add the column.
The scientists calculated a value of 0.833 for the undisturbed population.
Explain what is shown by the difference in the values between the two populations of bear.
Answer
The undisturbed population (higher value) has a greater / higher (food) species diversity / variation than the disturbed population (lower value).
The undisturbed population (higher D) has greater food-species diversity than the disturbed population.
Background Concept
Simpson's Index of Diversity increases as both the number of species and the evenness of their representation increase. A higher therefore corresponds to greater diversity in the community being sampled.
Understanding the Question
The candidate is told that the undisturbed population has (calculated in part (c)(i) as for the disturbed population). The 1-mark question asks what the difference between these two values shows about the two populations.
Approach
Identify which population has the higher , then state what a higher means biologically. One clear sentence is enough.
Step-by-Step Reasoning
- and .
- .
- A higher means more diversity (more species, or the same number of species more evenly distributed).
- Therefore the undisturbed population eats a greater variety of food species than the disturbed population.
This matches the mark scheme: "undisturbed / higher D, has, larger / higher / more, (food), diversity / variation".
Key Takeaways
- is a comparative index — always interpret it in relation to another , or against a benchmark.
- A higher reflects greater species diversity AND greater evenness of species representation, not simply more species.
Common Mistakes
- Saying "more species" without using the word "diversity" or "variation" — the mark scheme specifically rewards the term "diversity".
- Stating that the disturbed population has more diversity because it has fewer species — the direction of the comparison is the opposite.
- Vague answers such as "the populations eat different food" — the question asks specifically what the difference in shows.
Things to Be Careful About
- The marks reward the term "diversity" or a clear synonym ("variation"); avoid hedging with "number of animals".
- Keep the comparison explicit: state which population has the higher and what that means.
The harlequin ladybird, Harmonia axyridis, is an insect that shows discontinuous variation in colour pattern and continuous variation in body size.
Within a species, the variation that is observed for a particular characteristic can be described as discontinuous or continuous.
Discontinuous variation has a different genetic basis from continuous variation.
State two differences between discontinuous variation and continuous variation, other than having a different genetic basis.
Answer
Any two of:
- Discontinuous variation shows distinct / discrete categories with no intermediates, whereas continuous variation shows a range / many values / many intermediates.
- Discontinuous variation does not show a normal distribution (e.g. a bar chart with few bars), whereas continuous variation does show a normal distribution / bell-shaped curve.
- Discontinuous variation is little affected by the environment (genes only), whereas continuous variation is strongly affected by the environment.
See working
Background Concept
Variation between individuals of the same species can be classified in two main ways. Discontinuous variation is produced when a characteristic falls into a small number of clearly separate categories with nothing in between (e.g. ABO blood group, seed shape). It is controlled by one or a few genes (often with large effect alleles), so the environment has little influence on which phenotype appears. Continuous variation is produced when a characteristic varies across a range of values with no clear breaks between them (e.g. height, mass, body size). Many genes (polygenes) each contribute a small effect, and the environment substantially modifies the phenotype.
Understanding the Question
Part (a) asks for two differences between these two types of variation, but explicitly excludes the genetic basis (i.e. it does not want "discontinuous is one/few genes, continuous is many genes/polygenes"). Any two other valid differences are accepted.
Approach
The mark scheme gives three pairs of contrasting points. Pick the two you can state most confidently and concisely:
- Whether the categories are discrete or form a range.
- Whether the distribution shows normal distribution / bell-shaped curve or not.
- Whether the environment has little or large effect.
Step-by-Step Reasoning
Pair 1 (categories): Discontinuous phenotypes do not overlap — each individual sits in one named category. Continuous phenotypes grade into each other across a spectrum.
Pair 2 (distribution): Plotted as a bar chart, discontinuous data give a few separated bars. Continuous data give many values that, when grouped, approximate a bell-shaped (normal) curve.
Pair 3 (environment): Discontinuous variation is essentially genetic (e.g. eye colour). Continuous variation has a strong environmental component in addition to its genetic component (e.g. body mass depends on nutrition as well as genotype).
Key Takeaways
- Discontinuous = few discrete categories, often single-gene, environmental influence minimal.
- Continuous = full range of values, polygenic, environment has a large effect.
Common Mistakes
- Restating the genetic-basis difference ("few genes vs many genes") — explicitly excluded by the question.
- Confusing "no effect" with "no environment". The correct contrast is "little / no effect" (discontinuous) vs "some / large effect" (continuous).
- Saying discontinuous has no distribution at all — it has a distribution, just not a normal one.
Things to Be Careful About
Read the question carefully: "other than having a different genetic basis" rules out the obvious genetic-contrast answer. Use the wording the mark scheme accepts — "discrete", "intermediates", "normal distribution", "bell-shaped", "effect from environment".
Fig. 9.1 shows three of the colour patterns seen in H. axyridis and the percentage of each in a population.
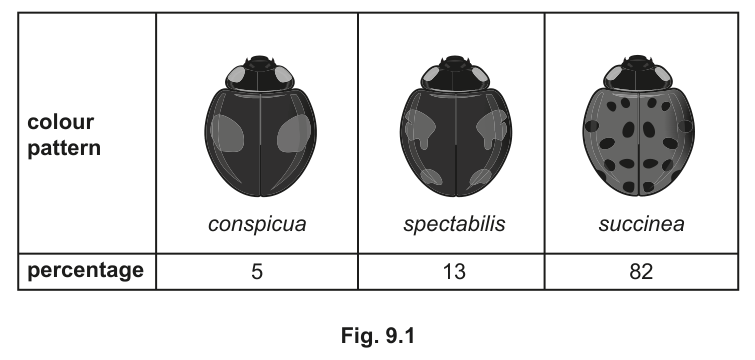
Suggest the genetic basis of the variation in colour pattern in H. axyridis.
Answer
Any two of:
- Colour pattern is controlled by one / two genes.
- Different alleles of a gene have a large effect.
- There are multiple / three alleles at the locus / gene concerned.
- There is gene interaction / epistasis between two genes.
(The most commonly credited explanation is that the three discrete phenotypes are produced by multiple alleles at a single locus; alternatively, two interacting genes (epistasis) can also give three phenotypes.)
See working
Background Concept
When discrete (non-overlapping) phenotypes are seen in a population, the underlying genetics usually involves one or a few genes with alleles of large effect. Two ways to obtain several discrete phenotypes from a small genetic system are:
- Multiple alleles — a single locus has more than two alleles in the population (e.g. ABO blood group with three alleles , , ).
- Epistasis — two (or more) genes interact, with one gene masking or modifying the expression of another (e.g. a 9 : 3 : 4 ratio in a dihybrid cross).
Understanding the Question
Fig. 9.1 shows three distinct colour-pattern phenotypes in H. axyridis — conspicua, spectabilis, succinea — at frequencies 5 %, 13 % and 82 %. The question stem states that colour pattern shows discontinuous variation. The task is to suggest a genetic explanation that fits three discrete phenotypes.
Approach
Three discrete phenotypes from one character can be generated by either (a) one gene with three (or more) alleles, or (b) two genes interacting (epistasis). Identify the option most often credited and state it clearly.
Step-by-Step Reasoning
Multiple alleles: A single locus with ≥3 alleles (say , , — or the real situation in H. axyridis, where >100 alleles are known) can produce three phenotypes when each allele has a large, distinguishable effect.
Epistasis: Two genes, where the dominant allele of one masks the effect of the other, can collapse the classic 9 : 3 : 3 : 1 dihybrid ratio into 9 : 3 : 4 or 12 : 3 : 1, again giving three phenotypic classes.
Large-effect alleles / few genes: Either way, the variation is consistent with discontinuous variation because the underlying genetics is simple (one or two loci) with alleles whose effects are large enough to produce non-overlapping phenotypes.
Key Takeaways
- The number of discrete phenotypes hints at the genetic architecture: three classes → multiple alleles at one locus, OR epistasis between two loci.
- Discontinuous variation in phenotype is consistent with few genes and large-effect alleles.
Common Mistakes
- Saying "polygenes" or "many genes each with small effect" — that describes continuous variation, not the three discrete colour patterns shown.
- Naming a mechanism without linking it to the three phenotypes seen.
- Confusing multiple alleles with multiple genes.
Things to Be Careful About
H. axyridis in reality has more than three alleles at one locus, but the mark scheme accepts "multiple alleles" or "epistasis". Either is fine; do not muddle the two ideas. "Gene interaction" is a synonym of "epistasis" and is credited.
The body size of adult H. axyridis varies from 5 mm to 8 mm. Adult ladybirds do not grow or change size. Adults develop from larvae that hatch from eggs.
State two environmental factors that may affect adult body size in H. axyridis.
Answer
Any two of:
- Temperature during larval development.
- Food (supply) during larval development.
- Size / diet of the mother, which determines egg size (and hence the resources available to the larva).
See working
Background Concept
Body size in insects is determined during the larval (feeding) stages — once the larva pupates and emerges as an adult, the cuticle is fixed and the adult cannot grow. Therefore any environmental factor that influences growth rate or duration during larval life will affect adult body size. The two classic abiotic and biotic factors are temperature and food supply. Maternal effects (egg size and composition, which depend on the mother's diet and condition) provide a further environmental input before the larva even hatches.
Understanding the Question
Part (c) gives the important biological detail that adult ladybirds do not grow, so the relevant environmental factors must act before adulthood — i.e. on the egg or on the larva. The mark scheme explicitly credits factors plus the developmental stage they act on.
Approach
List two factors that affect growth during the life stages in which size can still change. Pair each factor with the stage at which it acts if you can.
Step-by-Step Reasoning
- Temperature — affects the rate of metabolism and growth in the larva; cooler conditions or temperature extremes produce smaller adults.
- Food supply / nutrition during larval development — more or better food allows the larva to reach a larger final instar size.
- Maternal factors — the size/diet/condition of the mother influences egg size and yolk content, so a well-fed mother produces eggs with more reserves, supporting larger larvae.
Key Takeaways
- Adult insects are fixed in size; environmental effects must act on earlier life stages.
- For continuous traits like body size, both genotype (polygenes) and environment (temperature, nutrition, maternal effects) contribute.
Common Mistakes
- Naming factors that act on the adult (e.g. "food eaten by the adult") — the stem explicitly states adults do not grow.
- Forgetting to specify when the factor acts (during larval development / via the mother).
- Naming vague factors like "weather" or "predators" — these don't change adult size directly.
Things to Be Careful About
The mark scheme credits the timing: a factor plus its developmental stage scores the mark. For example, "temperature during larval development" is safer than just "temperature". Always think about when the environmental variable can still influence the phenotype.
Humans detect the sweet taste of sucrose sugar using chemoreceptor cells in taste buds on the tongue. The red admiral butterfly, Vanessa atalanta, detects sucrose using chemoreceptor cells located on its antennae and on its tarsi (feet). The mode of action of the chemoreceptors in V. atalanta is similar to that in humans.
Fig. 10.1 shows the locations of the chemoreceptor cells on V. atalanta.
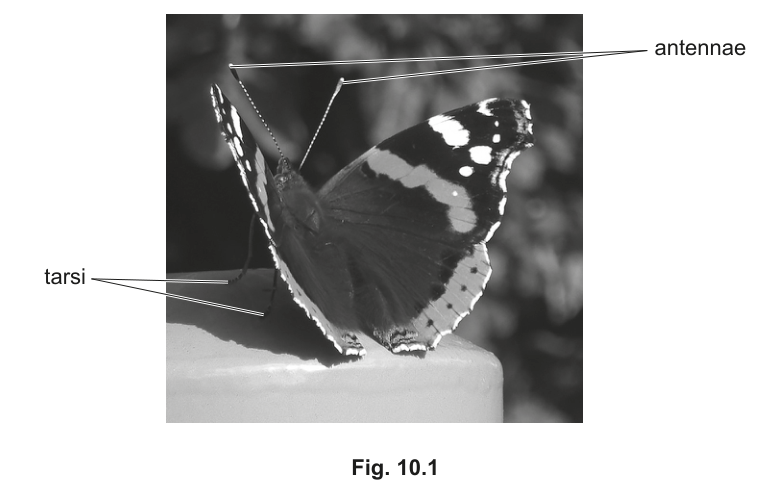
Describe how the presence of sucrose causes an action potential in the sensory neurone associated with a chemoreceptor cell in V. atalanta.
Answer
- Sucrose binds to a receptor protein (cell surface receptor) on the chemoreceptor cell.
- A second messenger is produced inside the chemoreceptor cell.
- Na⁺ ions enter the chemoreceptor cell down their electrochemical gradient, depolarising the membrane and producing a receptor (generator) potential.
- If threshold is reached, voltage-gated Ca²⁺ channels open and Ca²⁺ ions enter the chemoreceptor cell.
- Ca²⁺ causes (named) neurotransmitter-containing vesicles to move to and fuse with the presynaptic membrane, releasing neurotransmitter by exocytosis into the synaptic cleft.
- The neurotransmitter binds to receptors on the postsynaptic membrane of the sensory neurone, opening ligand-gated Na⁺ channels; Na⁺ enters the sensory neurone, depolarising it to threshold and triggering an action potential.
Six marking points covered as above.
Background Concept
A chemoreceptor is a sensory cell that transduces a chemical stimulus (here, sucrose) into an electrical signal. Chemoreceptors do not have long axons of their own; instead, they form a synapse onto the sensory neurone that carries the signal to the central nervous system. Two stages are therefore needed: (i) the receptor cell converts sucrose binding into a depolarising receptor (generator) potential, and (ii) that depolarisation triggers Ca²⁺-dependent neurotransmitter release onto the sensory neurone, where the neurotransmitter produces a depolarising postsynaptic potential. Only if that postsynaptic depolarisation reaches threshold does an action potential fire in the sensory neurone.
Key ideas to keep in mind:
- Receptor / generator potential — a graded depolarisation produced by the opening of non-voltage-gated channels in the receptor cell when the stimulus molecule binds. It is graded (larger stimulus → larger depolarisation) and decremental (it decays with distance).
- Second messengers — many chemoreceptors use G-protein coupled signalling. Binding of the stimulus activates a G-protein, which activates an effector enzyme that generates a small intracellular second messenger (e.g. cAMP, IP₃) that opens or closes ion channels, producing the receptor potential.
- Threshold and the action potential — an action potential is an all-or-none event that fires only when a membrane is depolarised to a critical voltage (threshold). The receptor potential and the postsynaptic potential are both graded; only when their sum reaches threshold do voltage-gated Na⁺ channels open and an action potential propagate.
- Synaptic transmission — Ca²⁺ entry through voltage-gated Ca²⁺ channels is the trigger that drives synaptic vesicles to fuse with the presynaptic membrane and release neurotransmitter. The neurotransmitter diffuses across the cleft and opens ligand-gated cation channels on the postsynaptic (sensory neurone) membrane, depolarising it.
Understanding the Question
The stem tells us:
- The red admiral butterfly Vanessa atalanta has chemoreceptors on its antennae and tarsi.
- These chemoreceptors work in a similar way to human sweet-taste chemoreceptors.
- The diagram (Fig. 10.1) simply identifies where the receptors sit — it does not require annotation.
The command word is describe, which in CIE usage means a sequential, linked account of the process — the answer must be a logical chain, not an unstructured list. Six marks means we need six well-articulated points arranged in the correct biological order.
The chain to describe is:
sucrose → receptor binding → receptor potential in the chemoreceptor cell → Ca²⁺ entry → neurotransmitter release → neurotransmitter binding on sensory neurone → depolarisation to threshold → action potential.
Approach
The strategy is to follow the signal from the outside of the chemoreceptor cell to the inside of the sensory neurone, hitting six discrete, mark-worthy points. A good sequence is:
- Stimulus binds to a cell-surface receptor protein.
- A second messenger is involved.
- The membrane of the chemoreceptor cell depolarises (Na⁺ entry) producing a receptor/generator potential.
- Ca²⁺ enters the chemoreceptor cell.
- Vesicles containing neurotransmitter fuse with the presynaptic membrane (exocytosis).
- Neurotransmitter crosses the cleft and binds to receptors on the sensory neurone, opening ligand-gated Na⁺ channels, depolarising it to threshold and triggering an action potential.
Step-by-Step Reasoning
- Sucrose binds to the receptor protein on the outer surface of the chemoreceptor cell. The receptor is specific for the stimulus; this specificity is what makes the chemoreceptor a chemoreceptor rather than a mechanoreceptor or photoreceptor.
- A second messenger is generated inside the cell. In taste (and many other chemoreceptors) binding activates a G-protein, which activates an enzyme (e.g. phospholipase C or adenylate cyclase) that produces a second messenger such as IP₃ or cAMP. This second messenger opens or closes ion channels, producing the receptor potential.
- Na⁺ ions enter the chemoreceptor cell, down their electrochemical gradient, depolarising the membrane and producing a receptor (generator) potential. The size of this depolarisation depends on how much sucrose is bound.
- Ca²⁺ ions enter through voltage-gated Ca²⁺ channels that open as the receptor potential depolarises the cell. Ca²⁺ entry is the trigger for vesicle fusion.
- Neurotransmitter-containing vesicles move to the presynaptic membrane and fuse with it, releasing neurotransmitter by exocytosis into the synaptic cleft.
- Neurotransmitter diffuses across the cleft and binds to receptors on the postsynaptic (sensory neurone) membrane. This opens ligand-gated Na⁺ channels so that Na⁺ flows in, depolarising the sensory neurone. If this depolarisation reaches threshold, voltage-gated Na⁺ channels open and an action potential is generated and propagated along the sensory neurone.
Each of the six steps above corresponds to a markable idea from the mark scheme; choosing the strongest six of these gives the candidate full marks.
Key Takeaways
- Sensory transduction in a chemoreceptor uses a receptor (generator) potential, not an action potential directly. The action potential only arises in the postsynaptic sensory neurone.
- Second messengers amplify the signal inside the receptor cell.
- Ca²⁺ entry is the universal trigger for neurotransmitter release at chemical synapses.
- Threshold is the gate that converts a graded receptor/postsynaptic potential into an all-or-none action potential.
- The chain described here (receptor binding → receptor potential → Ca²⁺ → exocytosis → postsynaptic depolarisation → action potential) is the generic sequence for any chemical synapse between a receptor cell and an afferent neurone.
Common Mistakes
- Skipping the receptor potential and going straight to "action potential in the sensory neurone" — examiners want to see the graded depolarisation in the receptor cell first.
- Writing "Ca²⁺ causes neurotransmitter to be released" without naming vesicle fusion / exocytosis — the mark scheme credits the fusion step separately.
- Saying "an impulse crosses the synapse" — synapses are chemical, not electrical; the signal is a neurotransmitter diffusing across the cleft.
- Saying "Na⁺/K⁺ pump" or "active transport" when describing the depolarisation — the depolarisation is Na⁺ diffusion through ligand-gated channels, not pumping.
- Forgetting to mention threshold, so the answer floats without showing why the action potential fires when it does.
Things to Be Careful About
- Use the precise term receptor (or generator) potential for the depolarisation in the chemoreceptor cell — it is graded and decremental.
- Distinguish receptor protein (a cell-surface receptor) from the receptor cell (the chemoreceptor) and from the postsynaptic receptor on the sensory neurone.
- Be explicit that the neurotransmitter acts on ligand-gated ion channels on the sensory neurone.
- Mention Ca²⁺ entry, not just "ions"; the mark scheme names the ion.
- The six marks are independent and can be awarded in any order, but the narrative must remain logical. Read the mark scheme for any specific terms it requires (e.g. "receptor protein", "synaptic cleft", "threshold") and use them.