Biology 9700/52 — February/March 2024
Cambridge A-Level · Planning, Analysis and Evaluation · worked solutions for every part, with the mark scheme
Topics Planning · Analysis, Conclusions and Evaluation
Onions are vegetables that are harvested from the plant Allium cepa. In many countries, small onions are used to make pickled onions. Pickled onions can be stored for a long time because the growth of microorganisms is prevented.
Pickled onions are made using this method.
- Remove the dry outer layer from small onions.
- Place the onions in a sodium chloride solution for several hours.
- Remove the sodium chloride solution and place the onions in a solution of ethanoic acid (vinegar).
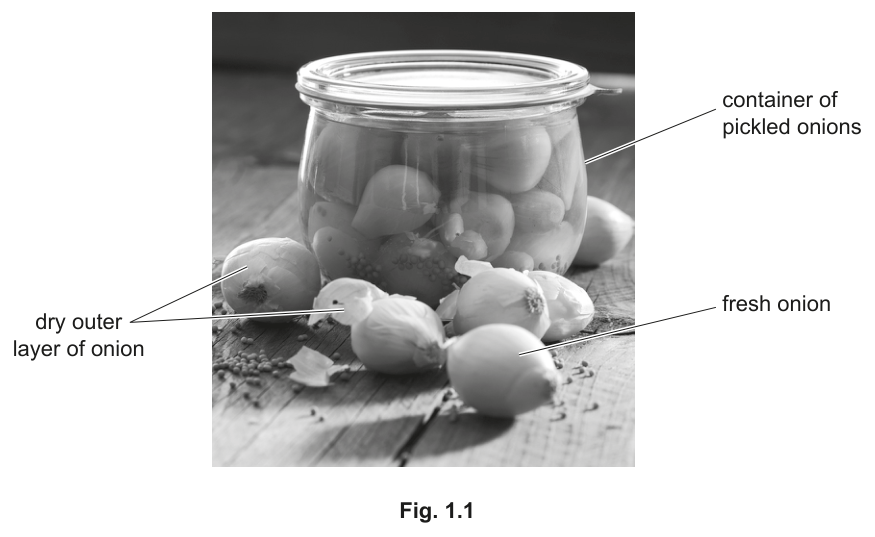
Fig. 1.1 shows a container of pickled onions and some fresh onions that have not been pickled.
Some students decided to investigate how placing small onions in different concentrations of sodium chloride solution affects the mass of the onions.
Answer
concentration of sodium chloride (solution)
concentration of sodium chloride (solution)
Background Concept
The independent variable in any experiment is the factor that the investigator deliberately changes in order to test its effect on the dependent variable. It must be something that can be set to different, measurable values during the experiment. In contrast, the dependent variable is the factor that is measured to assess the effect of the change, and controlled variables are all the other factors that are kept constant so that any change in the dependent variable can be attributed to the change in the independent variable.
Understanding the Question
The students' investigation is described in the stem of part (a): 'to investigate how placing small onions in different concentrations of sodium chloride solution affects the mass of the onions.' The phrase 'different concentrations' tells us the factor that is being changed, and 'mass of the onions' is what is being measured.
Approach
Read the aim carefully, identify the factor that is being deliberately varied, and state it using the precise wording of the investigation. The wording in the stem ('concentrations of sodium chloride solution') is the clearest and most precise answer.
Step-by-Step Reasoning
The aim states that the students 'place small onions in different concentrations of sodium chloride solution' and observe the 'mass of the onions.' The factor that is deliberately altered is the concentration of sodium chloride solution, while the mass is what is being measured. Therefore the independent variable is the concentration of sodium chloride solution.
Key Takeaways
- Independent variable: the factor that is deliberately changed.
- Dependent variable: the factor that is measured.
- Controlled variables: factors kept the same.
- A good answer uses the exact wording from the aim of the investigation.
Common Mistakes
- Stating 'type of solution' or 'solution used' – too vague; the mark scheme requires 'concentration of sodium chloride (solution)'.
- Stating 'mass of the onions' – this is the dependent variable, not the independent variable.
- Stating 'time' – although time is varied in part (b), within any one experimental run the time is fixed and is therefore a controlled variable, not the independent variable in this investigation.
Things to Be Careful About
In multi-stage experiments, students sometimes confuse which variable is the 'main' independent variable. The clue is always the wording of the stated aim of the investigation.
The students were given a stock solution of sodium chloride. The students decided to use the stock solution to make sodium chloride solutions with concentrations of , , , , and .
The students made of these solutions in separate beakers.
Complete Table 1.1 to show how of these solutions could be made by proportional dilution of the stock solution of sodium chloride.
Table 1.1
| percentage concentration of sodium chloride solution | volume of sodium chloride solution / | volume of ______ / |
|---|---|---|
| 0.0 | ||
| 1.0 | ||
| 5.0 | ||
| 10.0 | ||
| 15.0 | ||
| 20.0 |
Working
For a proportional dilution from a stock into a total volume of :
and .
Answer
| percentage concentration of NaCl / % | volume of 20.0% NaCl / cm³ | volume of distilled water / cm³ |
|---|---|---|
| 0.0 | 0 | 140 |
| 1.0 | 7 | 133 |
| 5.0 | 35 | 105 |
| 10.0 | 70 | 70 |
| 15.0 | 105 | 35 |
| 20.0 | 140 | 0 |
see working
Background Concept
A stock solution is a solution of known, high concentration from which more dilute working solutions can be prepared. Diluting a stock with a suitable diluent (here, distilled water) reduces the concentration without changing the total amount of solute. For a proportional dilution the relationship
applies, where and are the concentration and volume of the stock, and and are the concentration and volume of the diluted solution. The diluent must be the same solvent (water) and should not itself contain any of the solute (so that the only contribution to the final concentration is from the stock).
Understanding the Question
The students have a stock solution of NaCl and want of each of six working concentrations: , , , , and . 'Proportional' means each concentration is prepared by mixing an appropriate volume of the stock with distilled water so that the final volume is exactly . The third column of the table is the volume of diluent (the second blank in the table head), which should be filled in as 'distilled water' (or deionised/pure water).
Approach
- For each target concentration, calculate the volume of stock required using with , = the target percentage, and .
- The volume of water required is the difference between the total volume and the volume of stock: .
- Write the volumes into the table.
- Label the third column 'distilled water' (or equivalent acceptable diluent).
Step-by-Step Reasoning
Using for each target concentration:
- : ; .
- : ; .
- : ; .
- : ; .
- : ; .
- : ; .
Two marks are awarded: one for correctly identifying the diluent as distilled/deionised/pure water in the column heading, and one for the correct volumes in the table.
Key Takeaways
- A proportional dilution always uses to find the volume of stock needed.
- The diluent must be the same solvent as the stock (water) and free of the solute.
- Volumes must add up to the required total volume of working solution.
- The percentage stock and the percentage target should be in the same units, and the volumes should be in the same units (here both ).
Common Mistakes
- Filling in the column heading as 'water' without specifying 'distilled' – tap water contains dissolved ions and would alter the experiment.
- Using the wrong total volume (e.g. adding the stock and water without checking that the total is exactly for each row).
- Calculating the stock volume for as – the dilution factor from to is , not .
Things to Be Careful About
The diluent label is part of the mark – the mark scheme explicitly rejects tap water and only allows distilled/deionised/pure water. Make sure the table heading is filled in completely and the volumes are correct to whole cm³ precision.
The students carried out this procedure.
- The dry outer layer was removed from 30 small onions.
- Five of the small onions were placed into each of the six beakers containing the sodium chloride solutions prepared by the students.
- The onions were left in the sodium chloride solutions for 2 hours.
- The mean percentage change in mass of the five small onions in each beaker was calculated.
The students then repeated the whole procedure using a new set of 30 small onions. This time the onions were left in the sodium chloride solutions for 48 hours.
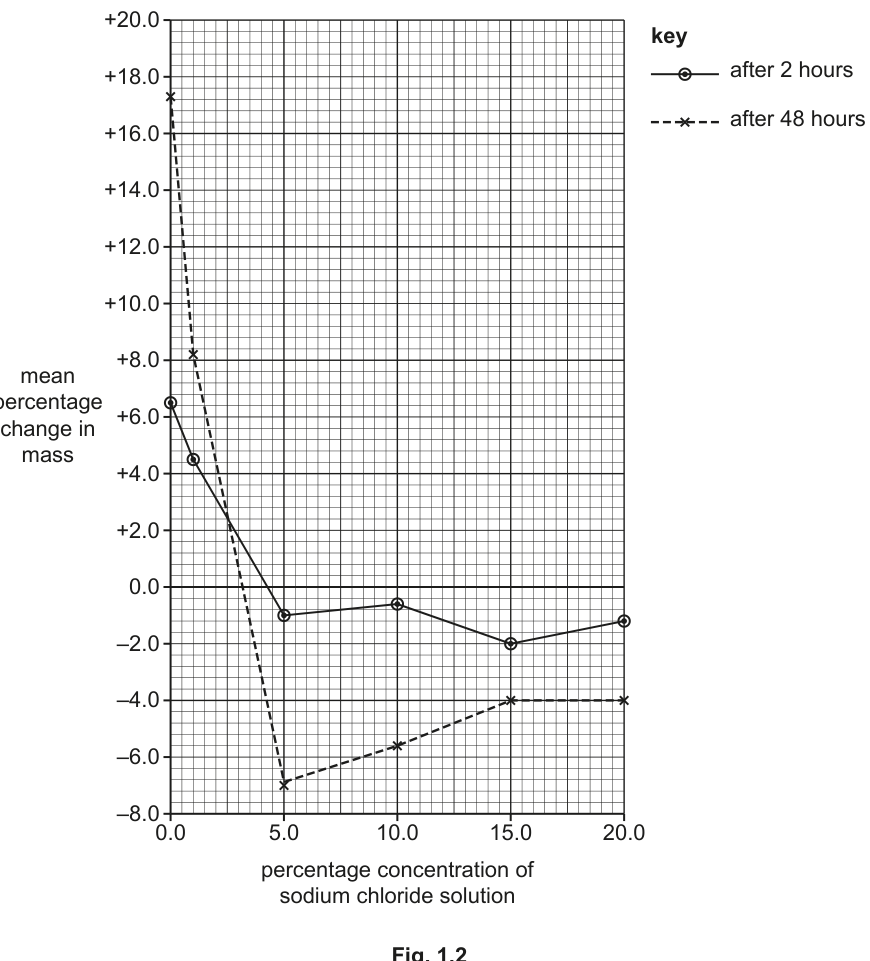
Fig. 1.2 shows the results of the investigation.
Answer
so that the results for the different concentrations can be validly compared, because the initial masses of the five onions in each beaker were not the same
so that the results for the different concentrations can be validly compared, because the initial masses of the five onions in each beaker were not the same
Background Concept
When an experiment uses living tissue such as onion bulbs, individual specimens will not have exactly the same starting mass even when they look similar. If we recorded only the change in mass in grams, a 1 g change in a 5 g onion looks more impressive than a 1 g change in a 10 g onion, even though the larger onion has lost a smaller proportion of its mass. Percentage change normalises the data to a common scale (a percentage of the original value), so that specimens of different starting size can be compared directly.
Understanding the Question
The students weighed five small onions into each beaker, but each onion had its own initial mass. The question asks why they converted their raw mass measurements into a percentage change before taking the mean.
Approach
Identify what the percentage change does mathematically, and link this to the experimental need to compare onions of different starting masses. The mark scheme accepts any wording that makes the 'valid comparison' or 'non-constant initial mass' point.
Step-by-Step Reasoning
A 1 g loss on a 4 g onion is of its mass, while the same 1 g loss on a 10 g onion is only . Without the percentage step, the mean of the absolute mass changes would be skewed by the size of the individual onions. By expressing each change as a percentage of its own initial mass, the students can take a fair mean across five onions and also compare the means between beakers containing different concentrations of NaCl.
Key Takeaways
- Percentage change = (change in value / original value) × .
- Normalising data allows valid comparison when starting values are not constant.
- For living tissues, individual variation in size is the norm, so percentage change (or rate per unit mass) is the appropriate processing step.
Common Mistakes
- Saying 'so the results are more accurate' – the calculation is not about accuracy (closeness to a true value), it is about fair comparison.
- Saying 'to make the results smaller' – meaningless; percentage change can be larger or smaller than the absolute change.
- Stating only one half of the argument (either 'so we can compare' or 'because the masses were different') – both halves together are needed for the clearest explanation.
Things to Be Careful About
The mark scheme offers two alternative answers that each earn the single mark: (1) the comparison justification or (2) the non-constant initial mass justification. Either is acceptable, but combining them gives the most robust answer.
One of the students concluded that:
The water potential of the onion cells is the same as the water potential of a sodium chloride solution.
With reference to the information provided, including the results shown in Fig. 1.2, suggest reasons why this conclusion should not be accepted.
Answer
- The conclusion of only applies to the onions left for 2 hours; for 48 hours the 0% change in mass line crosses the x-axis at NaCl, so the value depends on the time the onions are left in the solution.
- No intermediate concentrations between and were tested, so the precise point of zero change cannot be confirmed.
- No statistical analysis (e.g. standard error or confidence intervals) was carried out, so we cannot tell whether and are significantly different from each other or from the true water potential.
- Not all onion cells will have the same water potential, so quoting a single value is an over-simplification of a range of values across the tissue.
The conclusion is not supported because it applies only to the 2-hour data, intermediate concentrations were not tested, no statistical analysis was performed and onion cells do not all share the same water potential.
Background Concept
When the water potential inside plant cells is the same as that of the surrounding solution, there is no net movement of water by osmosis, and the mass of the tissue does not change. The concentration of NaCl at which the mean percentage change in mass is zero therefore gives an estimate of the cell water potential. However, an estimate from a graph is only as good as the experimental design that produced the data and the analysis applied to it.
Understanding the Question
The student has read off the x-intercept of the 'after 2 hours' line on Fig. 1.2 and concluded that the cell water potential corresponds to a NaCl solution. The question asks us to suggest reasons why this conclusion should not be accepted. We are expected to combine what we can see on the graph with knowledge of good experimental practice and biological variation.
Approach
Read the graph carefully: the 2-hour line crosses zero at about , but the 48-hour line crosses zero at about . Note also that the only concentrations tested were , , , , and , so the true crossing point is an interpolation, not a direct measurement. The mark scheme lists eight possible points and the best four should be selected.
Step-by-Step Reasoning
- Time dependence: the value obtained depends on how long the onions are left. The 48-hour line crosses at , not , so the conclusion is only true of the 2-hour experiment, not a fixed property of the cells. (mark point 1)
- Intermediate concentrations not tested: between and no solutions were used, so the precise x-intercept is an interpolation between widely spaced points, with a correspondingly large uncertainty. (mark point 6)
- No statistics: without standard errors, confidence intervals or another statistical test, we cannot tell whether the difference between and is significant or simply the result of random variation. (mark point 7)
- Cell-to-cell variation: a sample of onion tissue contains many cells with slightly different water potentials, so quoting a single value is an over-simplification. (mark point 8)
Other possible points (not all needed for full marks):
- The line of best fit might give a slightly different value at zero, especially if anomalous points are present (mark points 4 and 5).
- There is general experimental error in measuring masses and in preparing the dilution series (mark point 3).
Key Takeaways
- Always check whether a graph-derived value is consistent across the conditions tested (here, the 2-hour vs 48-hour lines give different values).
- The spacing of independent-variable values controls the precision of any reading taken off the resulting graph.
- Statistical analysis (standard error, CI, t-tests) is needed to know whether a difference is real.
- A tissue is made of many cells, so its 'water potential' is an average; a single value hides cell-to-cell variation.
Common Mistakes
- Stating that the experiment is 'inaccurate' without saying what specifically is wrong – the mark scheme wants named limitations (no intermediate concentrations, no statistics, time dependence, etc.).
- Saying 'we should repeat the experiment' without identifying what specific improvement would help (more concentrations, more replicates, statistical analysis).
- Confusing the 2-hour and 48-hour x-intercepts – the question states the student used , so it is the 2-hour line that gives this value.
Things to Be Careful About
The student concluded NaCl, but the 48-hour line gives – both are interpolated from the same sparse data set. The strongest criticisms are therefore about the dependence on time and the lack of intermediate concentrations and statistics.
The turnip, Brassica rapa, is a root vegetable. Turnips are grown in many parts of the world.
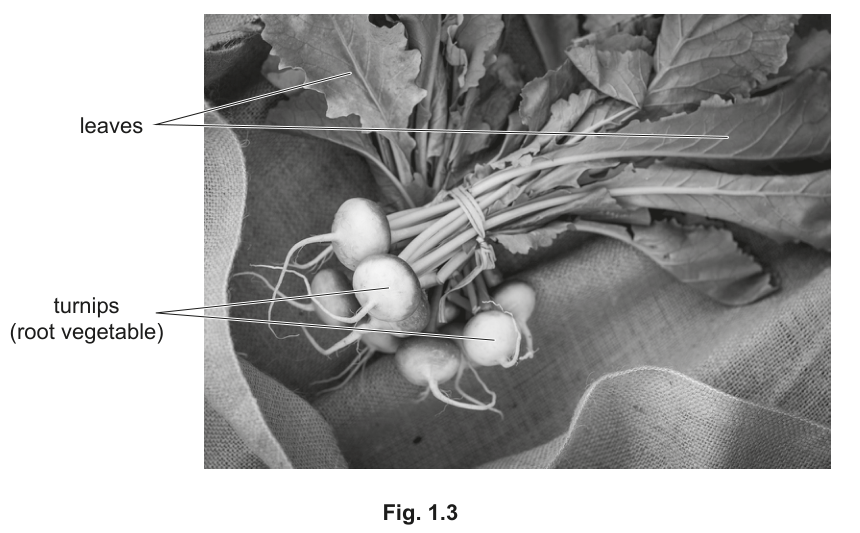
Fig. 1.3 shows freshly harvested turnips with the leaves still attached.
A student decided to investigate the effect of temperature on the rate of osmosis in turnips.
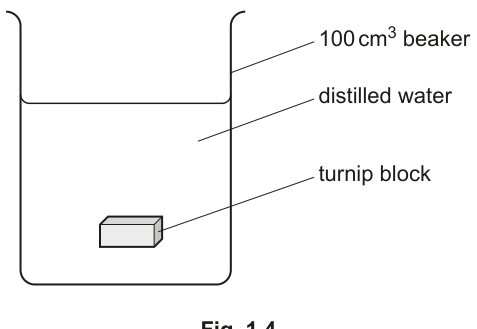
In an initial test, the student removed the outer layer from a turnip and cut the turnip into small blocks. The student placed one of the turnip blocks into a beaker of distilled water, as shown in Fig. 1.4. Water entered the block by osmosis.
The student was provided with additional turnips and standard laboratory apparatus.
Describe a method that the student could use to investigate the effect of increasing the temperature, over a range from to , on the rate of osmosis in turnip blocks.
Do not include the risk assessment or how to calculate the rate of osmosis from the results.
Your method should be set out in a logical order and be detailed enough to allow another person to follow it.
Method
- Prepare uniform blocks of turnip flesh (e.g. use a cork borer of stated diameter and trim to a stated length with a scalpel) so that each block has the same dimensions. Use turnips of the same variety and approximate age/ size.
- Weigh each block on a top-pan balance and record its initial mass.
- Set up a water bath at the lowest test temperature () and leave it to equilibrate; check with a thermometer.
- Place three (or more) turnip blocks into a beaker of fresh distilled water of known volume (e.g. ) at in the water bath. Start a stop-clock.
- After a set time (e.g. minutes), remove the blocks, blot them dry gently with a paper towel to remove surface water, and reweigh each block. Record the final mass.
- Repeat the procedure at , , and using fresh distilled water and new turnip blocks for each temperature. Maintain each temperature with the water bath (or thermostatically controlled bath) throughout the experiment.
- For each temperature, calculate the mean change in mass of the (at least three) replicate blocks.
- Use the same stated time, the same block size, the same variety of turnip and the same volume of distilled water for every temperature so that only temperature varies.
See method
Background Concept
Osmosis is the net movement of water molecules across a partially permeable membrane from a region of higher water potential to a region of lower water potential. In plant tissue, the partially permeable membrane is the cell-surface membrane and the tonoplast, and water moves in or out of the vacuole depending on the relative water potentials. The rate of osmosis depends on the steepness of the water-potential gradient and on the kinetic energy of the water molecules. Increasing the temperature increases the kinetic energy of the water molecules, so the rate of osmosis should increase as the temperature rises.
In this experiment the rate of osmosis in a turnip block is being inferred from the change in mass of the block while it sits in distilled water (water potential ). The block will gain mass because the cell water potential is more negative than that of pure water, so water moves in by osmosis.
Understanding the Question
A student is given turnips and standard laboratory apparatus. They must describe a method to investigate how temperature, over a range to , affects the rate of osmosis in turnip blocks. We should not include a risk assessment and we should not explain how to calculate the rate from the results. The method must be set out in a logical order and detailed enough for another person to follow.
Approach
A good plan should make explicit:
- the independent variable and how it is set (at least five temperatures between and );
- the dependent variable and how it is measured (change in mass of a turnip block);
- the controlled variables and how each is standardised (size and source of block, volume of water, time, etc.);
- the replication (at least three blocks per temperature, mean calculated);
- the procedure in a clear order.
Step-by-Step Reasoning
The mark scheme offers nine credit-worthy points; any six are needed for full marks. A clean method hits all of them.
- Five or more temperatures – e.g. , , , , . (mark point 1)
- Maintain a constant temperature – use a thermostatically controlled water bath (or a beaker of water in a larger water bath at the required temperature) for each replicate. (mark point 2)
- Same variety and age of turnip – to keep cell composition and water potential consistent across the experiment. (mark point 3)
- Same dimensions of turnip block – so that the surface-area-to-volume ratio (and hence the rate of osmosis) does not vary. (mark point 4)
- Apparatus to obtain uniform blocks – a cork borer and a scalpel/razor on a tile allow blocks of the same diameter and length to be cut. (mark point 5)
- Fresh distilled water at each temperature – place the blocks in a beaker of distilled water at the stated temperature; use a new beaker of water for each temperature to avoid contamination and ensure the temperature is correct. (mark point 6)
- Initial mass and final mass after a set time – record the initial mass of each block, leave it for a stated time interval (e.g. minutes), then reweigh. (mark point 7)
- At least three blocks per temperature and a mean – replication allows a mean change in mass to be calculated for each temperature, reducing the effect of random variation. (mark point 8)
- Remove excess water before reweighing – gently blot the surface of each block with a paper towel before reweighing, so that the final mass reflects only the water inside the tissue. (mark point 9)
A complete method mentions all of the above in a logical sequence.
Key Takeaways
- A planning answer should always state the variables, the controls, the replication, the timing, and the technique used to obtain a clean measurement (here, surface drying before reweighing).
- For osmosis experiments the rate is inferred from a change in mass; the same surface-drying step is needed every time, otherwise the reading is biased by surface water.
- A water bath is the standard way to control temperature; the block, water and any contact apparatus must all equilibrate to the same temperature before the timed interval begins.
- Replication and the calculation of a mean are essential to any quantitative investigation.
Common Mistakes
- Forgetting to standardise the size of the turnip blocks – blocks of different sizes have different surface-area-to-volume ratios and so different rates of osmosis.
- Failing to mention that the block must be blotted dry before reweighing – without this step the final mass includes surface water, and the change in mass is meaningless.
- Re-using the same distilled water for several temperatures – it will no longer be at the correct temperature and may contain leaked cell contents.
- Using only one block per temperature – the mean cannot be calculated and the result is not reliable.
- Omitting the timing of the experiment – without a stated time interval, the rate cannot be calculated.
Things to Be Careful About
The question says 'do not include the risk assessment or how to calculate the rate of osmosis from the results' – so the answer should describe only the experimental procedure. The method must be set out in a logical order, not as a bulleted list of disconnected points.
Complete the sketch graph shown in Fig. 1.5 to predict the effect of increasing the temperature, over a range from to , on the rate of osmosis in turnips.
Include axis labels with units in your answer.
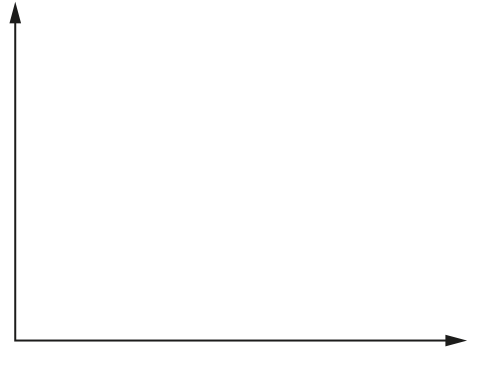
Answer
- Horizontal axis (x): temperature , ranging from to .
- Vertical axis (y): rate of osmosis (any suitable unit, e.g. ).
- Line shape: a smooth increasing line from left to right, starting low at and reaching a maximum at (a straight line of positive gradient, or a curve that rises and then plateaus, is acceptable).
Axes labelled 'temperature / °C' (x) and 'rate of osmosis' (y); a line that increases as temperature increases from 10 °C to 50 °C.
Background Concept
Osmosis is a passive process driven by the random thermal motion of water molecules. As temperature rises, the average kinetic energy of the water molecules increases, so more of them have sufficient energy to cross the partially permeable membrane per unit time, and the rate of osmosis rises. There is no enzyme-catalysed step in simple osmosis, so the rate does not show a sharp optimum followed by a decline in the way that enzyme-catalysed reactions do – although, in living tissue, very high temperatures may begin to damage membrane lipids and proteins, causing a small deviation from linearity.
Understanding the Question
The student is given an empty set of axes (Fig. 1.5) and must complete the sketch graph to predict the effect of temperature, between and , on the rate of osmosis in turnips. The axes must be labelled with both the quantity and the unit, and the line must be the right shape.
Approach
- Label the x-axis with the independent variable: temperature, with unit , scale from to .
- Label the y-axis with the dependent variable: rate of osmosis (any reasonable unit, e.g. mass change per unit time).
- Draw an increasing line of the correct shape.
Step-by-Step Reasoning
- X-axis label: 'temperature / ' is required. (mark point 1)
- Y-axis label: 'rate of osmosis' is required. (mark point 1)
- Line shape: a line that increases as temperature increases. (mark point 2) A straight line of positive gradient, or a curve that rises and then plateaus, are both acceptable. The line should not be horizontal and should not slope downwards.
Key Takeaways
- The independent variable goes on the x-axis and the dependent variable on the y-axis.
- Sketch graphs only need the correct overall shape and the correct axis labels – they do not need exact values or units on the y-axis (unless a quantity is named in the label).
- Osmosis is a physical, not enzymic, process, so a continuously increasing line is the expected shape.
Common Mistakes
- Drawing a curve that goes up and then down, with a peak around – – this is the shape for an enzyme-catalysed reaction, not for osmosis.
- Labelling the y-axis as 'mass change' rather than 'rate of osmosis' – the question asks for the rate, not the absolute change.
- Forgetting the unit on the x-axis – the mark scheme specifically asks for .
Things to Be Careful About
The mark scheme awards one mark for both axis labels and one mark for the line shape. Make sure both are present, and that the axis labels clearly name the quantity and the unit.
Suggest one hazard of your method in (c)(i), the risk associated with the hazard and the precaution that would need to be taken.
hazard ______
risk ______
precaution ______
Answer
- Hazard: sharp blade / scalpel (used to cut the turnip into blocks).
- Risk: cut to the skin / injury.
- Precaution: cut on a board / tile and direct the blade away from the hand / fingers.
hazard: sharp blade; risk: cut to the skin; precaution: cut on a board with the blade directed away from the hand.
Background Concept
Risk assessment is a routine part of any practical investigation. A hazard is something with the potential to cause harm; a risk is the likelihood and severity of that harm; and a precaution is a step taken to reduce either the likelihood or the severity. For one mark, the answer must clearly link all three: the hazard named must give rise to the risk stated, and the precaution must actually reduce that risk.
Understanding the Question
The question is set in the context of the planning answer to (c)(i). The student is asked to suggest one hazard of the method just described, the risk associated with that hazard, and the precaution that should be taken. The mark scheme lists three acceptable hazard–risk–precaution sets:
- sharp blade → injury → cut on a board, away from the hand;
- turnip → allergy/irritant → wear gloves / PPE;
- hot water / water-bath → scald / burn → wear heat-resistant gloves / use tongs.
Any one of these earns the mark, provided the three parts are clearly given and logically connected.
Approach
Pick the hazard that is most clearly present in the method described, state the harm it could cause, and give a sensible precaution. The scalpel/blade is the most obvious because blocks of turnip must be cut to a uniform size.
Step-by-Step Reasoning
- Hazard: a sharp blade or scalpel is needed to cut the turnip into uniform blocks.
- Risk: the blade can cut the skin, causing injury (cuts or, if a finger is in the way, a deeper wound).
- Precaution: cut the turnip on a hard surface such as a board or a tile, and direct the blade away from the hand (or use a cork borer, which removes the need for a scalpel entirely).
Key Takeaways
- Every practical method should have an associated risk assessment.
- A good hazard–risk–precaution set is specific, realistic, and directly linked.
- In an exam answer, all three parts must be present to earn the mark; omitting the precaution or leaving the risk vague loses the mark.
Common Mistakes
- Naming a hazard without a risk or precaution – only one part of the set is given and the mark is lost.
- Vague hazards such as 'chemicals' or 'glass' – these are not specific to the method, which uses turnip, water and a scalpel.
- Vague risks such as 'it could go wrong' – the risk should be the specific harm caused by the hazard.
- Precautions that do not address the stated risk – e.g. saying 'wear gloves' for a blade cut (gloves will not stop a scalpel).
Things to Be Careful About
The mark scheme says 'ref. to hazard and risk and precaution' – all three are required to earn the single mark.
Drosophila melanogaster is a small fruit fly that is often used in research on genetics.
Wild fruit flies normally have dark red eyes due to the presence of a brown pigment, ommochrome, and a bright red pigment, drosopterin.
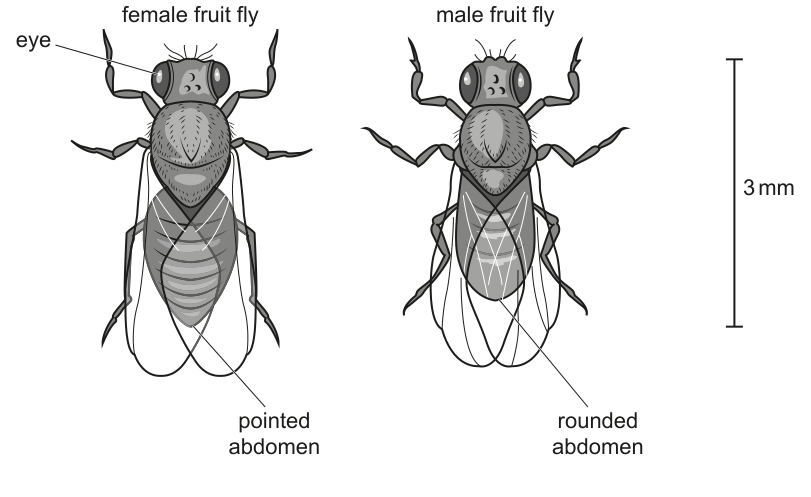
Fig. 2.1 shows an adult female fruit fly and an adult male fruit fly.
A biologist carried out an investigation to determine the roles of two genes that are involved in the determination of eye colour in adult fruit flies. Both genes have two alleles.
Earlier research by other scientists suggested that:
- the synthesis of the brown pigment ommochrome depends on the gene B/b
- the synthesis of the bright red pigment drosopterin depends on the gene R/r.
The biologist obtained the parent fruit flies shown in Table 2.1.
Table 2.1
| parent fruit flies | genotype | phenotype |
|---|---|---|
| female | BBrr | brown eyes |
| male | bbRR | bright red eyes |
The biologist carried out the procedure shown in Fig. 2.2 to cross the parent fruit flies and obtain first generation offspring.
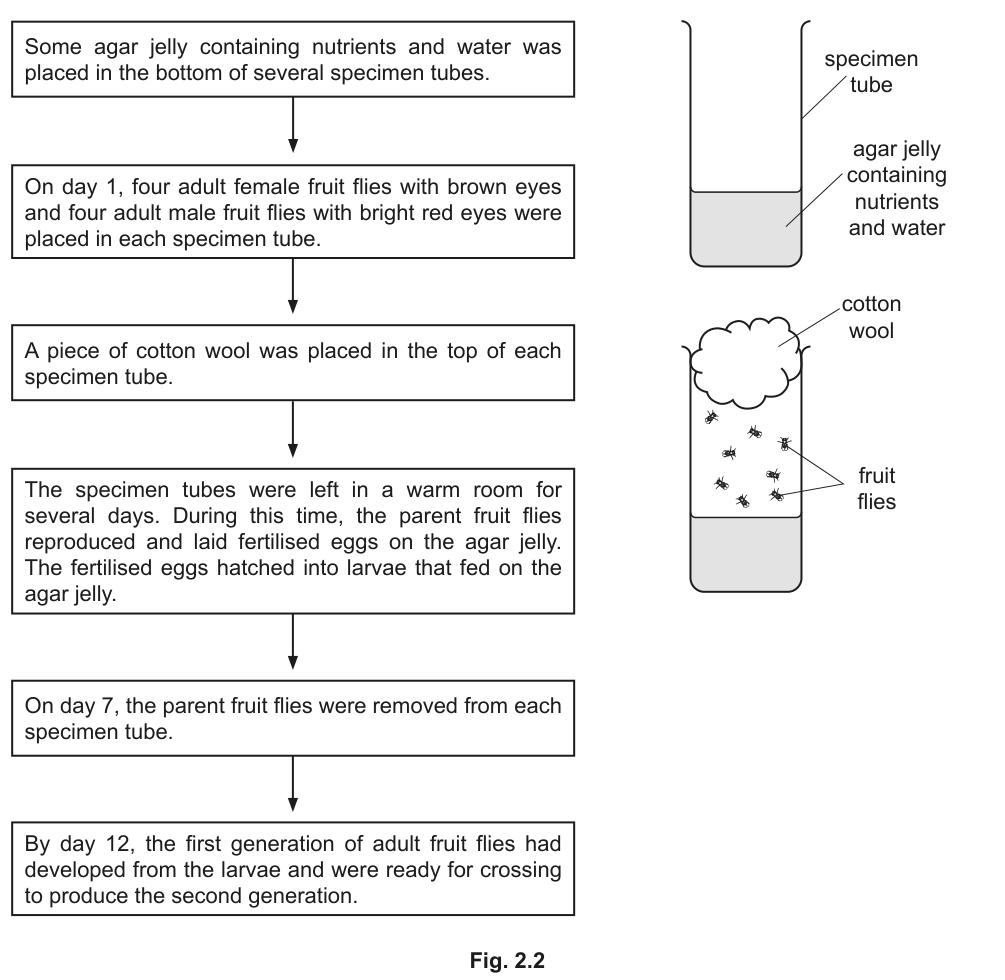
Suggest a reason why the biologist removed the parent fruit flies from the specimen tubes on day 7.
Answer
To prevent the parent fruit flies from reproducing / mating with the first-generation offspring.
To prevent the parent fruit flies from reproducing/mating with the first-generation offspring.
Background Concept
Drosophila melanogaster has a very short life cycle: eggs hatch within about a day, larvae feed and pupate, and adults emerge roughly 9–12 days after the egg is laid. Newly emerged adults are sexually mature within hours. This means the F1 adults that appear around day 12 are immediately capable of mating with any adults still present in the tube — including their own parents. If the original P-generation flies remained, the biologist would end up with a mixed, uncontrolled population containing parents, F1, F2, and possibly F3 individuals all reproducing together, making it impossible to assign phenotypes to a defined generation.
Understanding the Question
The procedure (Fig. 2.2) shows that parents are added on day 1 and removed on day 7, before the larvae have pupated and the F1 adults have emerged (by day 12). The question asks for the reason — i.e. what experimental problem the biologist is preventing by this step.
Approach
Think about what would go wrong if the parents stayed in the tube for the full 12 days. Drosophila adults mate readily; a female that has already mated stores sperm and can continue laying fertilised eggs. More importantly, the freshly emerged F1 adults are immediately able to mate — including with the still-living parents. This would corrupt the F2 generation that the biologist wants to score.
Step-by-Step Reasoning
- The first-generation adults emerge around day 12.
- F1 adults become sexually mature within hours of eclosion.
- If the P-generation parents were still present, the P adults would mate with the F1 adults, producing a mixed cohort that is no longer a clean F2 from an F1 × F1 cross.
- Removing the parents on day 7, after egg-laying has finished but before F1 adults have emerged, prevents this contamination and keeps the F1 × F1 cross controlled.
Key Takeaways
- A breeding experiment must prevent unintended matings between generations.
- For Drosophila, the parents are removed once egg-laying is complete but before F1 adults emerge.
- This is a standard control step in any multi-generation crossing experiment.
Common Mistakes
- Saying "to prevent the parents eating the eggs/larvae" — not the reason; the parents are usually removed before this could be a problem and the question is about reproduction.
- Saying "to count the offspring" — not the point of removal at day 7.
- Saying "because the parents die" — parents do not die at this stage.
Things to Be Careful About
The mark scheme explicitly wants a reference to the parents mating/reproducing with the first generation or offspring. A general statement such as "so they don't interfere" is too vague and would not score.
The biologist wanted to cross the first generation of fruit flies with one another to produce the second generation of fruit flies.
The first generation of adult fruit flies in the specimen tubes on day 12 were a mixture of females and males and had not yet mated.
The biologist crossed the first generation of fruit flies with one another by:
- preparing fresh specimen tubes in which to produce the second generation of fruit flies
- using a chemical to anaesthetise the first generation of adult fruit flies so that they were temporarily unable to move
- separating the adult female fruit flies and adult male fruit flies
- placing four adult female fruit flies and four adult male fruit flies into each of the fresh specimen tubes.
Suggest a method that the biologist could use to separate anaesthetised adult female fruit flies and anaesthetised adult male fruit flies and place four of each into a fresh specimen tube.
Answer
- Separate males from females using a hand lens / binocular (dissecting) microscope to identify the sex of each anaesthetised fly (females have pointed abdomens, males have rounded abdomens).
- Transfer four females and four males into a fresh specimen tube using a soft implement such as a paint brush / pooter / forceps.
Use a hand lens or binocular microscope to identify sex (by abdomen shape) and use a paint brush / pooter / forceps to transfer the flies.
Background Concept
Once anaesthetised (commonly with carbon dioxide, ether, or cold), fruit flies remain still for several minutes, long enough to be sorted. They are extremely fragile — a finger or metal seeker will crush them. They are also small (about 3 mm, as the scale bar in Fig. 2.1 shows), so distinguishing males from females by eye is difficult without magnification. Sexual dimorphism in Drosophila is visible in the abdomen: females have a pointed abdomen with clear dark bands; males have a rounded, darker-tipped abdomen. The sex comb on the male foreleg and genital structures are also diagnostic but harder to see.
Understanding the Question
The biologist needs to (1) tell females from males while they are motionless, and (2) move them without damage into a fresh tube in groups of four of each sex. The question asks for a method that achieves BOTH.
Approach
- To identify sex: need magnification that reveals the abdominal shape difference → hand lens or binocular/dissecting microscope.
- To move them: need a soft, non-crushing implement → paint brush, pooter (a mouth-operated aspirator with a fine tip), or fine forceps used very gently.
Step-by-Step Reasoning
- Anaesthesia keeps the flies still but does not make them robust.
- The reliable visible difference between the sexes is abdomen shape (Fig. 2.1: female pointed, male rounded), which is best seen under a hand lens or low-power binocular microscope.
- A paint brush can be used to roll/steer the fly; a pooter uses gentle suction to pick up an individual fly; fine forceps can grip a wing without crushing the body.
- Whichever tool is used, four females and four males are then tipped into each fresh tube.
Key Takeaways
- Choose apparatus to match the size and fragility of the organism: magnification to see, soft implement to handle.
- In Paper 5 planning questions, always link the apparatus to the property of the specimen that makes it appropriate.
Common Mistakes
- Saying "look at them with the naked eye" — Drosophila are too small and the dimorphism too subtle for confident sexing unaided; the mark scheme requires magnification.
- Saying "use fingers/glue/tweezers roughly" — the flies are easily crushed; a soft implement is required.
- Giving only one half of the answer (e.g. only the sorting method, only the transfer tool) — the mark scheme explicitly asks for both.
Things to Be Careful About
The mark scheme accepts either the magnification tool or a reference to the sex difference, and requires and the handling tool. Both elements must appear in the answer.
The biologist expected the cross to result in a phenotypic offspring ratio of in the second generation.
Table 2.2 shows the results of this cross.
Table 2.2
| offspring phenotype (second generation) | expected phenotypic ratio | observed number |
|---|---|---|
| dark red eyes | 9 | 691 |
| brown eyes | 3 | 260 |
| bright red eyes | 3 | 225 |
| white eyes | 1 | 72 |
| total | 1248 |
The biologist used the chi-squared () test to compare the observed and expected results for this cross.
Answer
There is no, significant / statistically significant, difference between the observed results and the expected (9 : 3 : 3 : 1) ratio.
There is no (significant) difference between the observed and the expected (9 : 3 : 3 : 1) results.
Background Concept
A statistical test such as chi-squared is used to decide whether an observed pattern of results is consistent with a theoretical prediction. The test compares observed counts with counts expected under the hypothesis, and returns a χ² value. This value is then compared to a critical value to decide whether to accept or reject the prediction.
The null hypothesis (H₀) is always the statement of "no effect" or "no difference". It is the hypothesis that the test can only reject — it is never proved true, only accepted as not disproved. For a chi-squared goodness-of-fit test, H₀ says the observed data fit the expected distribution.
Understanding the Question
The biologist has crossed F1 (BbRr × BbRr) flies, predicting a 9 : 3 : 3 : 1 phenotypic ratio, and has recorded the actual numbers of each phenotype in F2. They will calculate χ² and compare it to the critical value to decide whether their observed numbers are consistent with the 9 : 3 : 3 : 1 prediction. The question asks for the null hypothesis that this test will either accept or reject.
Approach
The null hypothesis must (a) be testable by χ², (b) state "no difference" between observed and expected, and (c) be specifically about the 9 : 3 : 3 : 1 expected ratio. A common formula is: "There is no significant difference between the observed results and the expected ratio."
Step-by-Step Reasoning
- χ² tests the difference between observed and expected frequencies.
- The "default" position is that there is no difference; this is the null hypothesis.
- Rejecting the null would mean the data do NOT fit the 9 : 3 : 3 : 1 ratio (e.g. the genes are linked, or one allele is lethal, etc.).
- Accepting the null means the data DO fit the ratio — there is no evidence to reject the prediction.
Key Takeaways
- A null hypothesis is a statement of "no difference".
- For goodness-of-fit tests, it always compares the observed distribution to the expected distribution.
- It is the hypothesis being tested — accept/reject decisions are about it, not about the alternative.
Common Mistakes
- Wording it as the alternative hypothesis ("the genes assort independently", "the ratio is 9 : 3 : 3 : 1") — this is what the biologist is trying to show, not what is being tested.
- Saying "there is no difference between the observed results" without mentioning the expected — the test specifically compares observed to expected.
- Including "due to chance" or "due to random variation" without saying "significant" — the null hypothesis in this context is a statement about statistical difference, not the cause.
Things to Be Careful About
The CIE mark scheme rewards a statement that there is no difference between observed and expected. The word "significant" is not strictly required but is good practice. The null hypothesis must be stated for this experiment — it must refer to the 9 : 3 : 3 : 1 expected ratio.
The equation for the calculation of is:
key to symbols:
= observed result
= expected result
= sum of
Complete Table 2.3 to calculate the value of for the results of this cross shown in Table 2.2.
Give the value of to four significant figures.
Table 2.3
| offspring phenotype (second generation) | |||||
|---|---|---|---|---|---|
| dark red eyes | 691 | ||||
| brown eyes | 260 | ||||
| bright red eyes | 225 | ||||
| white eyes | 72 | ||||
| total | 1248 |
= ______
Working
Expected values from the 9 : 3 : 3 : 1 ratio and total :
| phenotype | |||||
|---|---|---|---|---|---|
| dark red eyes | 691 | 702 | |||
| brown eyes | 260 | 234 | |||
| bright red eyes | 225 | 234 | |||
| white eyes | 72 | 78 | |||
| total | 1248 | 1248 | 3.869 |
Answer
(to 4 significant figures)
3.869
Background Concept
The chi-squared () test is a goodness-of-fit test. It measures how far the observed counts depart from the counts you would expect under a given hypothesis. The larger the value of , the worse the fit between data and hypothesis.
where is the observed count and is the expected count for each category. The expected counts are derived by multiplying the total number of observations by the proportion predicted by the hypothesis for each category.
Understanding the Question
The biologist predicted a 9 : 3 : 3 : 1 phenotypic ratio in the F2 (the classic dihybrid cross ratio for two unlinked, autosomal genes showing independent assortment with complete dominance). The observed F2 numbers are given; the test is whether these observed numbers are consistent with the 9 : 3 : 3 : 1 expectation.
Approach
- Compute each expected count by multiplying the total (1248) by the proportion 9/16, 3/16, 3/16 or 1/16.
- For each phenotype, calculate , then , then .
- Sum the four values to obtain .
- Round to 4 significant figures as requested.
Step-by-Step Reasoning
Step 1 — Expected values:
- Total , ratio parts sum to .
- Sanity check: ✓
Step 2 — for each row:
- Dark red: ; ;
- Brown: ; ;
- Bright red: ; ;
- White: ; ;
Step 3 — Sum:
(Using the mark scheme's individual rounded values: .)
Key Takeaways
- Expected counts are derived by multiplying the total by each ratio proportion.
- A chi-squared calculation requires correct rounding at each step; using the unrounded value and rounding only the final answer to 4 s.f. is the most reliable approach.
- Always sanity-check the expected counts sum to the observed total.
Common Mistakes
- Multiplying by the wrong ratio part (e.g. giving 9/16 for all four).
- Forgetting to square the term, or using instead of (which actually gives the same value because of the square, but is poor practice).
- Rounding intermediate values too aggressively (e.g. rounding 0.17236 to 0.17) and getting a slightly different final answer.
- Not checking the sign of — it is irrelevant after squaring but is part of the systematic working.
Things to Be Careful About
- 4 significant figures means four digits from the first non-zero digit: 3.869, not 3.9 or 3.8689.
- should be quoted to at least 3 decimal places, since small rounding errors in the final total add up.
- The equation given in the question matches the standard one; do not introduce a Yates' continuity correction — CIE does not use it.
The biologist compared the calculated value of to the critical values at different probability values shown in Table 2.4.
Table 2.4
| degrees of freedom | probability () | |||||
|---|---|---|---|---|---|---|
| 0.95 | 0.90 | 0.50 | 0.10 | 0.05 | 0.01 | |
| 2 | 0.103 | 0.211 | 1.386 | 4.605 | 5.991 | 9.210 |
| 3 | 0.352 | 0.584 | 2.366 | 6.251 | 7.815 | 11.345 |
| 4 | 0.711 | 1.064 | 3.357 | 7.779 | 9.488 | 13.277 |
Using Table 2.4 and the calculated value of in (c)(ii), explain whether the null hypothesis should be accepted or rejected.
Answer
Degrees of freedom .
The critical value at and is .
The calculated value is less than , so the difference between the observed and expected results is not statistically significant and the null hypothesis is accepted. The observed F2 ratio is consistent with the expected ratio.
The calculated χ² (3.869) is less than the critical value 7.815 at p = 0.05, df = 3, so the null hypothesis is accepted.
Background Concept
Once is calculated, it is compared to a critical value from a statistical table. The critical value depends on two things:
- The probability level (often , i.e. a 5% chance of obtaining the result by random variation alone).
- The degrees of freedom (df), which for a goodness-of-fit test is the number of categories minus 1.
If the calculated is less than or equal to the critical value, the deviations between observed and expected are within the range expected by chance, and we accept the null hypothesis (the data fit the predicted ratio).
If the calculated is greater than the critical value, the deviations are too large to be explained by chance, and we reject the null hypothesis (the data do not fit the predicted ratio).
Understanding the Question
The question supplies a partial critical-values table (Table 2.4) and the calculated from (c)(ii). The task is to (a) identify the correct critical value, (b) compare it to the calculated value, and (c) state the decision in words, with a brief biological interpretation.
Approach
- Determine df: 4 phenotype categories → df .
- Read the critical value at (the conventional significance level), df = 3: this is 7.815.
- Compare: .
- Decision: accept the null hypothesis; the 9 : 3 : 3 : 1 ratio is supported.
Step-by-Step Reasoning
- Number of phenotype categories in the F2 = 4 (dark red, brown, bright red, white).
- .
- Reading Table 2.4 at row df = 3 and column : critical value .
- The calculated is well below 7.815.
- Therefore, the deviations are not statistically significant at the 5% level. We accept the null hypothesis.
- Biologically, this supports the prediction that the two genes assort independently (i.e. they are on different chromosomes, or far apart on the same chromosome), and the F2 ratio of 9 : 3 : 3 : 1 holds.
Key Takeaways
- df = (number of categories) − 1 for a goodness-of-fit test.
- The row is the standard significance level; if , accept H₀.
- "Accepting" the null does not prove it true — it means there is no statistical evidence against it.
- The biological meaning here is that the F2 data are consistent with a dihybrid cross involving two unlinked, autosomal genes with complete dominance.
Common Mistakes
- Stating df = 4 (forgetting to subtract 1).
- Reading the critical value from the wrong row (e.g. df = 2 = 5.991) or the wrong column (e.g. ).
- Saying "accept the alternative hypothesis" or "the result is significant" — the test only speaks to the null hypothesis.
- Confusing "accept" with "prove" — we never prove the null; we merely fail to reject it.
Things to Be Careful About
- The mark scheme requires BOTH the comparison () AND the decision (null hypothesis accepted). Either alone is not enough for full marks.
- Mention the probability level (or equivalent) to anchor the critical value.
- The biological interpretation is not strictly required by the mark scheme for (c)(iii) but is a useful habit — in (d)(ii) you will be asked to draw biological conclusions from the breeding experiment.
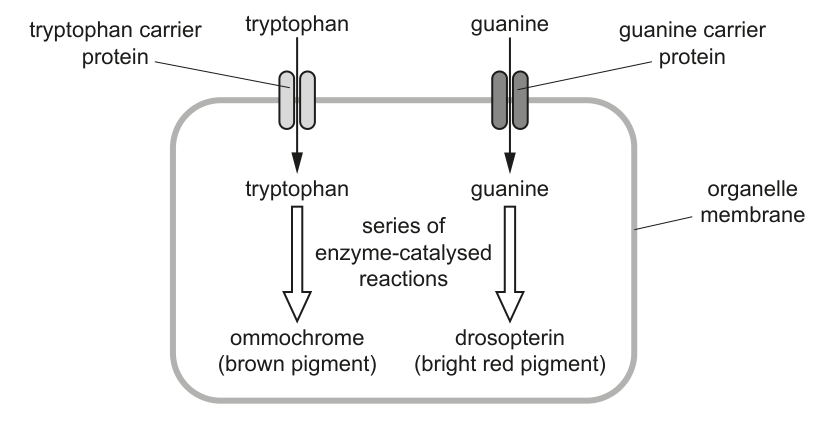
More recent research has shown that gene B/b and gene R/r code for polypeptides in carrier proteins. These carrier proteins are found in organelle membranes of the pigment cells of the eyes of adult fruit flies.
- Gene B/b codes for a polypeptide in the tryptophan carrier protein. Tryptophan is an amino acid.
- Gene R/r codes for a polypeptide in the guanine carrier protein.
Fig. 2.3 shows how the dark red eye colour of wild fruit flies is produced in organelles in pigment cells of the eyes.
The biologist decided to analyse all the pigments present in the eyes of the second generation of fruit flies.
The biologist started by extracting eye pigments from the adult fruit flies with dark red eyes and from the adult fruit flies with white eyes. The biologist then added a small volume of each liquid extract to chromatography paper and separated the pigments present by chromatography.
Fig. 2.4 shows the chromatography paper at the end of the procedure when viewed using visible light and ultraviolet light.
Pigment 1 and pigment 3 were visible only when viewed under ultraviolet light. Under visible light, pigment 2 was yellow and pigment 4 was bright red.
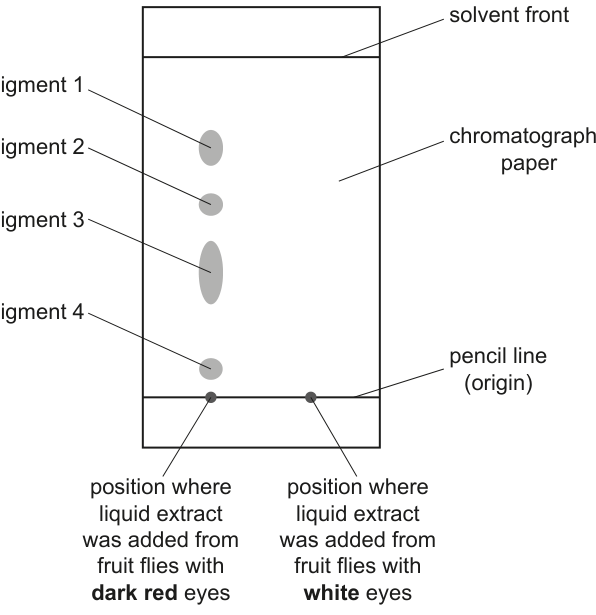
The biologist calculated values for each pigment on the chromatography paper. The biologist used the values to confirm the identity of the pigments using a published source.
The formula for the calculation of is:
When measuring the distance moved by the pigment, the distance to the centre of the pigment should be measured.
Use Fig. 2.4 to calculate the value of pigment 1.
= ______
Working
Reading from Fig. 2.4 (centre of pigment 1 spot):
Answer
0.73
Background Concept
Paper chromatography separates a mixture of substances dissolved in a solvent. As the solvent moves up the paper by capillary action, each component is carried at its own characteristic rate, depending on how soluble it is in the mobile phase (the solvent) and how strongly it adsorbs onto the stationary phase (the paper). The retention factor is a dimensionless quantity that standardises a substance's position:
For a given solvent and type of paper at a given temperature, each compound has a characteristic value, so a published table can be used to identify unknown spots.
is always between 0 (substance does not move at all) and 1 (substance moves with the solvent front). It is independent of the actual distances and the size of the paper, so it can be compared between experiments.
Understanding the Question
The biologist has run a chromatogram of pigments extracted from the eyes of dark red-eyed fruit flies. Fig. 2.4 shows four spots (pigments 1–4) in one lane, with no spots in the white-eyed lane. The question asks for the of pigment 1, the spot that travelled furthest (closest to the solvent front).
The mark scheme gives as the accepted value. To reproduce this answer, you measure the distance from the pencil line (origin) to the centre of the pigment 1 spot, and divide it by the distance from the origin to the solvent front.
Approach
- Use a ruler to measure the distance from the origin to the centre of pigment 1's spot.
- Measure the distance from the origin to the solvent front.
- Divide the first by the second.
- Quote the answer to 2 significant figures, since the diagram only allows that precision.
Step-by-Step Reasoning
- In Fig. 2.4, pigment 1 sits a substantial distance up the chromatogram, just below the solvent front.
- Reading the relative distances on the printed diagram, the pigment has moved about 73% of the way to the solvent front.
- Hence (mark scheme value).
- Note that the question says "distance to the centre of the pigment" — measuring to the leading or trailing edge of a fuzzy spot introduces systematic error.
Key Takeaways
- values are dimensionless ratios between 0 and 1.
- The standard convention is to measure to the centre of the spot (midline of the spot) — not the leading edge or the trailing edge.
- values are used to identify unknown substances by comparison with a published source run under identical conditions (same solvent, same paper, same temperature).
Common Mistakes
- Measuring to the top of the spot rather than the centre — gives an artificially high .
- Measuring from the bottom of the paper or the edge of the solvent reservoir — wrong baseline.
- Quoting the value with units (e.g. "0.73 cm") — is dimensionless.
- Rounding the answer differently from the mark scheme (e.g. 0.7 or 0.730) — CIE generally accepts any value in the range 0.72–0.74 to the appropriate number of significant figures.
Things to Be Careful About
- Always measure to the centre of the spot, especially when the spot is elongated or fuzzy.
- The pencil line (origin) is drawn in pencil because pencil graphite is insoluble in most chromatography solvents and will not itself run up the paper; a pen line would dissolve into the solvent and contaminate the chromatogram.
- depends on the solvent system, so quoted values are only comparable when the solvent and paper type are identical.
State the conclusions that can be made from the results of the fruit fly breeding experiment in (c) and from the chromatography results.
Answer
From the breeding experiment (max 3):
- The two genes, B/b and R/r, are not linked (they assort independently) — supported by the close fit of the F2 data to the 9 : 3 : 3 : 1 ratio (, null hypothesis accepted).
- The dominant alleles (B and R) code for (functional) carrier-protein polypeptides, since only flies with at least one dominant allele of each gene produce both pigments and have dark red eyes.
- In dark red-eyed flies, the entry of both tryptophan and guanine into the organelle via their respective carrier proteins allows both pigments (ommochrome and drosopterin) to be produced, giving the dark red eye colour.
- White-eyed flies are homozygous recessive for both genes, bbrr (no functional carrier proteins, so neither pigment is made); dark red-eyed flies have at least one dominant allele of each gene, B_R_.
From the chromatogram (max 3):
- Fruit flies with dark red eyes have four pigments in their eyes (spots 1, 2, 3 and 4 on the chromatogram).
- Fruit flies with white eyes have no pigments in their eyes (no spots on their lane of the chromatogram).
- Pigment 4 is drosopterin (the bright red pigment, as pigment 4 was described as bright red under visible light).
- Ommochrome (brown pigment) is insoluble in the chromatography solvent used, so it did not run up the paper; alternatively, none of the four spots correspond to ommochrome.
Genes B/b and R/r are unlinked; dominant alleles code for functional carrier proteins; dark red-eyed flies (B_R_) have four pigments including drosopterin (pigment 4); white-eyed flies (bbrr) have no pigments; ommochrome is insoluble in the chromatography solvent.
Background Concept
This question pulls together two threads: classical Mendelian genetics of a dihybrid cross, and the biochemistry of pigment synthesis in Drosophila eye cells.
In the dihybrid cross, the F1 from a cross between two parents that are homozygous for different alleles at two loci (BBrr × bbRR) is dihybrid BbRr. Crossing F1 to F1 gives a classic 9 : 3 : 3 : 1 ratio in the F2, provided the two genes are on different chromosomes (or very far apart on the same chromosome) so that they assort independently. A chi-squared test confirms whether the observed numbers match the expected ratio.
Mechanistically (Fig. 2.3), the B allele codes for a functional tryptophan carrier protein, and the R allele for a functional guanine carrier protein. Tryptophan and guanine are precursors that need to enter the pigment-cell organelle; inside, enzymes convert them into ommochrome (brown) and drosopterin (bright red) respectively. The dominant wild-type alleles therefore produce functional carriers, and the recessive alleles (b, r) produce non-functional carriers, so homozygous recessive flies cannot import the precursors and make neither pigment — the eyes appear white because the underlying cuticle shows through.
Chromatography (Fig. 2.4) is then used to check what pigments are actually present in flies of each phenotype. A substance moves up the paper in the solvent only if it is soluble in that solvent; insoluble substances stay at the origin.
Understanding the Question
The question has two parents: the F2 results from the breeding experiment in (c), and the chromatogram in Fig. 2.4. The candidate is asked to state what can be concluded from BOTH, up to a total of four marks. The mark scheme allows up to 3 marks from the breeding results and up to 3 from the chromatogram — i.e. the strongest four points, drawn from either source, score the marks.
Approach
Read the chromatogram and the cross results together. Each is a separate line of evidence, and combining them gives a coherent picture:
- The genetic cross tells you about the genes.
- The chromatogram tells you about the biochemistry of the pigments.
- The connection (Fig. 2.3) tells you how genotype maps to phenotype via the carrier proteins.
Step-by-Step Reasoning
Conclusions from the breeding experiment:
-
The genes are not linked. The 9 : 3 : 3 : 1 ratio is obtained only when the two loci segregate independently. The chi-squared result (, less than the critical value 7.815 at , df = 3) means the observed numbers are consistent with this ratio. If the genes were linked, the ratio would deviate strongly from 9 : 3 : 3 : 1 (typically producing only the two parental phenotypes in roughly equal numbers).
-
Dominant alleles code for functional carrier proteins. A fly needs at least one functional copy of each gene to make the corresponding pigment. A fly with the dominant phenotype (dark red eyes) has at least one B and one R allele, i.e. genotype B_R_. This is the only way to explain the 9 : 3 : 3 : 1 ratio with each phenotype corresponding to a specific combination of functional and non-functional alleles.
-
White-eyed flies are bbrr; dark red-eyed flies are B_R_. The 1/16 white-eyed class in the F2 is the double-recessive class. The 9/16 dark red class is the double-dominant class (B_R_). The 3/16 brown and 3/16 bright red classes are B_rr and bbR_ respectively (one functional carrier, one not).
-
Entry of both tryptophan and guanine is required for dark red eyes. Carriers for both precursors must be functional, so both pigments (brown ommochrome and bright red drosopterin) are produced. The combination of brown + bright red pigments in the eye gives the dark red wild-type colour.
Conclusions from the chromatogram:
-
Dark red-eyed flies have 4 pigments in their eyes. Four spots are visible in the dark red lane (pigments 1, 2, 3, 4). Pigments 1 and 3 are only visible under UV light (so they are not coloured in visible light), and pigments 2 (yellow) and 4 (bright red) are visible in normal light.
-
White-eyed flies have no pigments in their eyes. The white-eyed lane is empty — no spots at all. This is consistent with bbrr flies lacking both functional carriers and therefore producing no pigments.
-
Pigment 4 is drosopterin. Pigment 4 is described as bright red under visible light, and drosopterin is described in the stem as the bright red pigment. Therefore pigment 4 must be drosopterin. (Pigment 2 is yellow — probably one of the other intermediates in the pathway. Pigments 1 and 3 are colourless under visible light and only visible under UV — likely other intermediates or other pigments.)
-
Ommochrome (brown pigment) is not visible on the chromatogram. The brown pigment is either insoluble in the chromatography solvent used (so it remains at the origin and is not seen as a separate spot), or the extraction procedure did not recover it. None of the four visible spots is brown, and none corresponds to ommochrome.
Key Takeaways
- A 9 : 3 : 3 : 1 F2 ratio is diagnostic of two unlinked, autosomal genes with complete dominance.
- A chi-squared test confirms whether observed data fit a predicted ratio.
- Dominant alleles typically code for functional proteins; recessive alleles typically code for non-functional or absent proteins.
- In Drosophila eye colour, two unlinked genes each code for a precursor-importing carrier protein, and the presence of both pigments gives the wild-type dark red colour.
- Paper chromatography can identify pigments by , but only soluble pigments will run; insoluble ones (like ommochrome) remain at the origin.
- Combining evidence from two independent experiments (here, breeding and chromatography) lets you build a richer, more robust picture than either alone.
Common Mistakes
- Concluding that the genes are linked because the observed ratio is not exactly 9 : 3 : 3 : 1. The test is statistical — small deviations are expected by chance.
- Saying "pigment 4 is ommochrome" because pigment 4 is the most prominent. Ommochrome is brown; pigment 4 is described as bright red, so it must be drosopterin.
- Saying the white-eyed flies have "white pigment". They have no pigment at all — the white appearance is the cuticle showing through.
- Forgetting that ommochrome should be present in dark red-eyed flies. The four spots represent drosopterin and the intermediates or products of the pathway, not ommochrome, which is insoluble.
- Concluding that the brown-eyed or bright red-eyed flies "have a mutation". They are simply homozygous recessive at one of the two loci (B_rr or bbR_), which is the normal expectation for this dihybrid cross.
Things to Be Careful About
- The mark scheme allows up to 3 marks from the breeding evidence and up to 3 from the chromatogram evidence; choose the strongest, most specific points.
- The biological meaning of the breeding result is not just "the data fit 9 : 3 : 3 : 1" — it is "the two genes are not linked".
- The biological meaning of the chromatogram is not just "there are four spots" — it is "there are four pigments, including drosopterin, and ommochrome is not present (probably insoluble)".
- Keep genotype notation consistent: use B and b (or R and r), and indicate dominance with the capital letter.