Biology 9700/42 — February/March 2024
Cambridge A-Level · A Level Structured Questions · worked solutions for every part, with the mark scheme
Topics Inheritance · Control and Coordination · Selection and Evolution · Genetic Technology · Homeostasis · Energy and Respiration · +2 more
Fig. 1.1 is a diagram of a nephron.
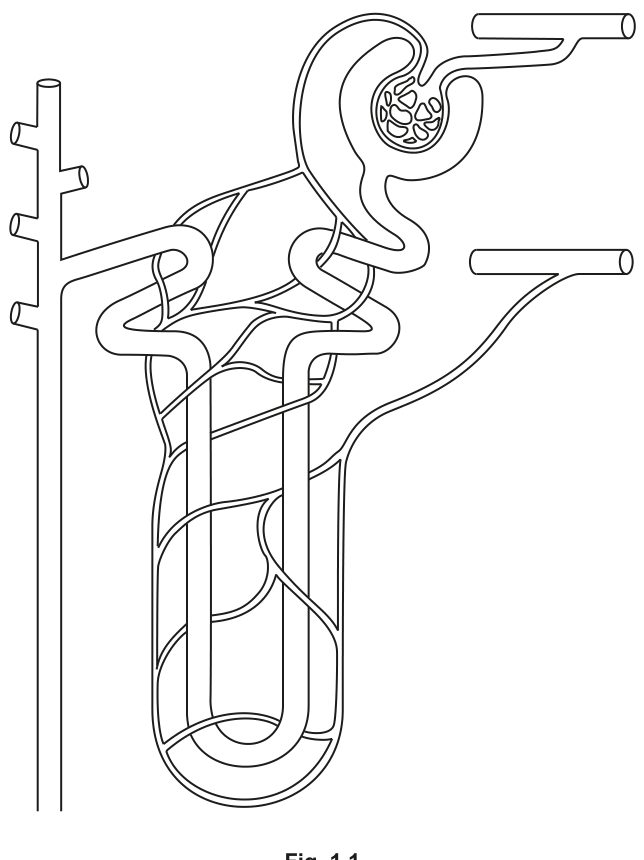
Label Fig. 1.1 using:
• one labelling line and the letter A to identify a region that contains urine
• one labelling line and the letter B to identify a region that contains podocytes
• one labelling line and the letter C to identify a region of the nephron that is within the medulla of the kidney
• one labelling line and the letter D to identify the afferent arteriole.
Answer
Add four labelling lines to Fig. 1.1:
- A → to the collecting duct (the tube that receives fluid from the distal convoluted tubule and descends through the medulla)
- B → to the inner (visceral) layer of Bowman's capsule that wraps around the glomerulus, where the podocytes are located
- C → to the loop of Henle, OR to the part of the collecting duct that lies below the level of the convoluted tubules (both of these regions lie within the medulla)
- D → to the wider of the two blood vessels entering Bowman's capsule (the afferent arteriole is wider than the efferent arteriole)
A – collecting duct; B – inner (visceral) layer of Bowman's capsule; C – loop of Henle (or collecting duct below the convoluted tubules); D – wider blood vessel entering Bowman's capsule (afferent arteriole).
Background Concept
A nephron is the functional unit of the kidney, and the printed diagram (Fig. 1.1) shows its main regions: Bowman's capsule enclosing the glomerulus, the proximal convoluted tubule (PCT), the loop of Henle, the distal convoluted tubule (DCT), and the collecting duct. The cortex contains Bowman's capsule, the PCT and the DCT, while the medulla contains the loop of Henle and most of the collecting duct.
Bowman's capsule has two epithelial layers. The outer (parietal) layer is a simple squamous epithelium; the inner (visceral) layer wraps around the glomerular capillaries and is made of specialised cells called podocytes. Their interdigitating foot processes form filtration slits that contribute to the filtration barrier during ultrafiltration.
The glomerulus is supplied by two arterioles of unequal diameter. The afferent arteriole is wider than the efferent arteriole. Because blood enters a wider vessel and leaves through a narrower one, pressure builds up inside the glomerular capillary tuft, which is the driving force for ultrafiltration.
Urine is finally produced once fluid has been modified along the nephron and collecting duct. The collecting duct is the last region of the nephron that any given drop of filtrate passes through before entering the renal pelvis as urine, so this is the region that contains urine (or, more precisely, the most concentrated urine that the nephron produces).
Understanding the Question
The question gives you a printed diagram of a nephron and asks you to add four labelled lines (A, B, C and D), each pointing to a specific structure:
- A – a region that contains urine
- B – a region that contains podocytes
- C – a region of the nephron that lies within the medulla
- D – the afferent arteriole
Because these are four discrete structural identifications, you must place each label line on the correct feature of the diagram, not just the general area. The mark scheme is precise: B must point to the inner part of Bowman's capsule, and D must point to the wider of the two vessels entering the capsule (not the narrower efferent arteriole, which also enters/leaves Bowman's capsule region).
Approach
Work through the labels one at a time, identifying each feature by its position and what is drawn there:
- Urine is the fluid that leaves the nephron — find the most distal tubule shown, the collecting duct.
- Podocytes sit on the inner (visceral) layer of Bowman's capsule that hugs the glomerular capillary tuft.
- The medulla of the kidney contains the loop of Henle and the lower portion of the collecting duct (anything that drops below the level of the convoluted tubules).
- The afferent arteriole is the vessel that brings blood into the glomerulus and is wider than the efferent arteriole that carries blood away.
Step-by-Step Reasoning
- Label A – The collecting duct is the right-hand tube that joins onto the distal convoluted tubule and runs down the side of the nephron. By this point the fluid has been adjusted by selective reabsorption and is the closest thing to urine still within the nephron. Add line A to this duct.
- Label B – Look inside Bowman's capsule where the glomerular capillaries are drawn. The inner wall of the capsule (the one in contact with the capillaries) is made of podocytes. The outer wall is simple squamous epithelium with no podocytes. Line B must touch the inner wall.
- Label C – The medulla is the inner part of the kidney. Two nephron structures dip down into it: the loop of Henle (the U-shaped hairpin) and the lower part of the collecting duct (below the cortex). Either is acceptable, but the most obvious medullary target is the loop of Henle.
- Label D – At the glomerulus, two arterioles are drawn. The vessel entering the glomerulus is the afferent arteriole; the one leaving is the efferent arteriole. The afferent is the wider of the two, so line D must go to the wider vessel. (Wider lumen on entry is also why glomerular pressure is high enough for ultrafiltration.)
Key Takeaways
- The cortex contains Bowman's capsule, the PCT and the DCT; the medulla contains the loop of Henle and the lower collecting duct.
- Podocytes are in the visceral (inner) layer of Bowman's capsule, not the parietal (outer) layer.
- The afferent arteriole is wider than the efferent arteriole — the diameter difference is what generates the high hydrostatic pressure required for ultrafiltration.
- The collecting duct is the final part of the nephron and the region that contains the most processed fluid (essentially urine) before it leaves for the renal pelvis.
Common Mistakes
- Pointing B to the outer wall of Bowman's capsule. Podocytes are on the inner (visceral) layer that hugs the capillaries, not the outer parietal layer.
- Pointing D to the narrower vessel (the efferent arteriole). The afferent is the wider of the two.
- Pointing A to the bladder or ureter. The diagram shows only a single nephron — the largest tube on the right is the collecting duct, which is the closest region on the figure that contains urine.
- Pointing C at the proximal convoluted tubule or distal convoluted tubule. These are in the cortex, not the medulla.
Things to Be Careful About
- Place each label line directly on the named structure, not on an adjacent tubule or vessel.
- For D, do not just point at "a vessel" — the mark requires the wider entering vessel specifically.
- For C, the mark scheme accepts either the loop of Henle or the lower collecting duct; choose whichever is clearer in the printed figure.
The cells of the proximal convoluted tubule are adapted to carry out selective reabsorption.
Describe and explain how these cells are adapted to carry out selective reabsorption.
Answer
Any four from:
- Microvilli on the apical (lumen-facing) membrane form a brush border, providing a large surface area for the reabsorption of useful solutes from the filtrate.
- Co-transporter proteins in the apical membrane move glucose and amino acids from the filtrate into the cell, together with ions (down the sodium gradient).
- Tight junctions between adjacent cells prevent filtrate passing between the cells, so all substances must pass through the cells — this makes the reabsorption selective.
- Many mitochondria release ATP, which is used by the / pumps in the basal membrane to actively transport out of the cell into the tissue fluid, maintaining the sodium gradient that drives co-transport at the apical surface.
- The basal membrane is folded (with many infoldings), providing extra surface area to accommodate large numbers of / pumps.
PCT cells are adapted for selective reabsorption by: (1) microvilli giving a large surface area; (2) co-transporter proteins for glucose/amino acids with Na+; (3) tight junctions forcing substances through cells; (4) many mitochondria providing ATP for Na+/K+ pumps; (5) folded basal membrane providing space for many Na+/K+ pumps.
Background Concept
The proximal convoluted tubule (PCT) is the first coiled region of the nephron after Bowman's capsule. Its cells are responsible for selective reabsorption: they take back useful substances (glucose, amino acids, vitamins, many ions and about 85% of the water) from the filtrate and return them to the blood, while leaving behind wastes such as urea.
Reabsorption in the PCT is mainly by active transport (often co-transport) rather than simple diffusion, because the useful molecules are being moved against a concentration gradient and the cell must be selective about what it takes back. To do this fast enough, PCT cells need:
- a large surface area exposed to the filtrate (so molecules can be picked up quickly);
- specific membrane proteins that recognise and transport the molecules to be reabsorbed;
- tight control over the route fluid takes (so nothing slips past between cells);
- a steady supply of ATP to power the active transport.
This combination of features is an excellent example of the biological principle that structure follows function.
Understanding the Question
The command words are describe and explain, so each point must do two things: name the structural feature of the PCT cell and explain how that feature helps selective reabsorption. Marks will not be awarded for structure alone ("it has microvilli") or for function alone ("reabsorption happens") — you need the link.
The question specifies the PCT, so answers about other regions of the nephron (e.g. features of the loop of Henle or distal tubule) are not creditworthy here.
Approach
Think about the journey of a glucose molecule (or amino acid) from the filtrate back into the blood. It must:
- Enter the apical (lumen-facing) surface of the PCT cell — so the cell needs a large surface area and specific transporters.
- Cross the cell — so the cell needs ATP and metabolic machinery.
- Leave through the basal surface into the tissue fluid and capillaries — so the basal membrane needs to be adapted to pump solutes outwards.
Work through the features of the cell in that order: microvilli, co-transporters, mitochondria, basal infoldings, plus the tight junctions that ensure the fluid actually goes through the cell rather than slipping between them.
Step-by-Step Reasoning
- Microvilli (1 mark). The apical surface of each PCT cell is covered in microvilli, forming a brush border. This dramatically increases the surface area in contact with the filtrate, so more transporters can be present and more molecules can be reabsorbed per unit time.
- Co-transporter proteins (1 mark). Specific carrier proteins in the apical membrane bind and a useful solute (e.g. glucose or an amino acid) together and move them into the cell. The moves down its electrochemical gradient (which was set up by the basal / pumps); the solute is "dragged" with it. This is the key mechanism of selective reabsorption for glucose and amino acids.
- Tight junctions (1 mark). Adjacent PCT cells are joined by tight junctions near their apical surfaces. These seal the gaps between cells, so filtrate cannot leak through the spaces between them. Everything that is reabsorbed must therefore pass through the cell, where the transporters can act on it selectively. This is what makes the reabsorption selective.
- Many mitochondria (1 mark). Active transport (especially the / pump) requires large amounts of ATP. PCT cells are packed with mitochondria to supply this ATP by aerobic respiration. The high mitochondrial density is a direct indicator of the high metabolic demand of the tissue.
- Folded basal membrane (1 mark). The basal surface is highly infolded, giving extra surface area in contact with the tissue fluid. This accommodates very large numbers of / pumps, which keep the intracellular concentration low. The low internal maintains the gradient that drives co-transport at the apical surface — so the basal infoldings are essential for the apical co-transport to keep working.
Key Takeaways
- Selective reabsorption in the PCT depends on the gradient set up by basal / pumps (using ATP from mitochondria).
- Microvilli and basal infoldings both increase surface area — but for different purposes (apical uptake and basal pumping respectively).
- Tight junctions make the reabsorption selective by forcing the filtrate through cells, where the appropriate transporters are located.
- This is a classic structure–function question: each structure has a specific role in the reabsorption mechanism.
Common Mistakes
- Stating the structure without the function ("it has microvilli") — earns nothing. You must say what the microvilli do (increase surface area for reabsorption).
- Stating "many mitochondria for respiration" without linking it to ATP use for active transport / the / pump.
- Saying tight junctions "hold the cells together" — this is true but not what earns the mark; the mark requires that tight junctions prevent substances passing between cells so that reabsorption must occur through the cells (which is what makes it selective).
- Confusing the apical and basal surfaces, or omitting the ion in descriptions of co-transport.
- Describing features of the loop of Henle (water-permeable walls, counter-current multiplier) — these are adaptations of a different region and do not earn credit here.
Things to Be Careful About
- The mark scheme is strict: "co-transporter proteins" must be linked to movement of glucose or amino acids with — not just "transport proteins".
- The mark scheme uses the phrasing "folded basal membrane" — saying "folded cell surface" is too vague.
- "Many" mitochondria — the qualifier matters; a single mitochondrion per cell is not enough to support the high rate of active transport.
- You only need to make four mark-worthy points; do not waste time on a fifth if you have clearly written the four best ones.
The scientist Gregor Mendel investigated differences in the length of the stem in the pea plant, Pisum sativum. In 1866, he published the results of his investigation into this trait (characteristic).
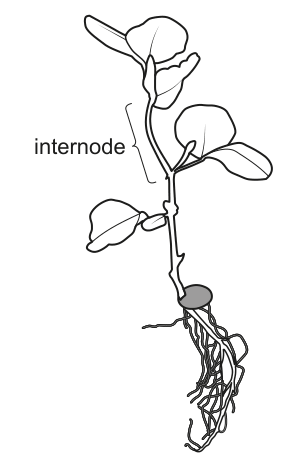
Fig. 2.1 shows a diagram of a pea plant.
Mendel observed that the pea plants he grew either had tall stems or dwarf (short) stems. In his investigation, Mendel carried out crosses using pea plants with these two phenotypes.
From the results of these crosses, Mendel demonstrated that tall stems were dominant to dwarf stems in pea plants.
It is now known that the stem length trait in pea plants is controlled by one gene that has two alleles:
• a dominant allele,
• a recessive allele, .
Describe a cross that could be carried out and how the results of the cross could be analysed to determine the genotype of a pea plant with a tall stem.
Answer
- Perform a test cross: cross the tall pea plant with a dwarf pea plant.
- The dwarf plant used in the cross must be homozygous recessive (genotype ).
- If all the offspring have tall stems, then the tall parent is homozygous dominant ().
- If the offspring are in a ratio of 1 tall : 1 dwarf (i.e. some dwarf offspring appear), then the tall parent is heterozygous ().
- (Any valid additional practical detail, e.g. hand-pollinate the flowers, collect and germinate the seeds, then score the phenotypes of the seedlings.)
See answer
Background Concept
Mendel showed that each inherited trait is controlled by discrete factors (now called genes), and that each gene has two versions — alleles — one inherited from each parent. In pea plants, stem length is controlled by one gene with two alleles:
- — dominant allele (tall stem)
- — recessive allele (dwarf stem)
A pea plant with a tall stem therefore has one of two possible genotypes: homozygous dominant () or heterozygous (). Both genotypes produce the same tall phenotype, because the dominant allele masks the recessive allele. The problem is that, just by looking at a tall plant, you cannot tell which of these two genotypes it carries.
A test cross solves this. A test cross is a controlled genetic cross in which an organism showing the dominant phenotype is mated with an organism that is homozygous recessive for the same gene. Because the recessive parent can only contribute a recessive allele to its offspring, the phenotypes of the offspring reveal the alleles carried by the dominant parent.
Understanding the Question
Part (a) asks the candidate to design a cross that distinguishes a tall plant from a tall plant, and to describe how the offspring results would be interpreted.
The command word is "describe", so the answer must include both the procedure (what cross to perform) and the analysis (how the offspring allow you to deduce the parent's genotype). Four marks are available, which corresponds to four distinct creditable points in the mark scheme.
Approach
The strategy is to:
- Identify the appropriate cross — a test cross with a homozygous recessive partner.
- Predict the two possible sets of offspring, depending on the unknown parent's genotype.
- Match the observed offspring ratio to the prediction to deduce the parent's genotype.
A Punnett square is not required, but the underlying logic is the same as for one. Both the procedure and the two possible outcomes must be stated to score full marks.
Step-by-Step Reasoning
Step 1 — Choose the cross partner.
A dwarf plant must be (homozygous recessive), because the dwarf phenotype can only appear when both alleles are recessive. This partner is guaranteed to pass a single allele to every offspring.
Step 2 — Predict the offspring if the tall parent is (homozygous dominant).
Every offspring receives from the tall parent and from the dwarf parent, giving genotype in all cases. All offspring are tall.
Step 3 — Predict the offspring if the tall parent is (heterozygous).
Half the offspring inherit (tall, ) and half inherit only (dwarf, ). The expected ratio is 1 tall : 1 dwarf.
Step 4 — Match observation to prediction.
- If every offspring is tall → the tall parent must have been .
- If approximately half the offspring are dwarf → the tall parent must have been .
Step 5 — Practical detail (AVP).
The mark scheme accepts an additional point for any sensible practical detail. In Mendel's actual experiments this included transferring pollen by hand (pea flowers normally self-pollinate, so the anthers must be removed from the female parent before crossing), harvesting the resulting seeds, and growing them on to score the phenotypes. Any one of these is sufficient to earn the extra point.
Key Takeaways
- A test cross uses a homozygous recessive partner to expose the alleles hidden in a dominant-phenotype organism.
- The two possible offspring outcomes — all dominant vs. a 1:1 mix of dominant and recessive — are diagnostic of the parent's genotype.
- This logic applies to any gene with a clear dominant/recessive relationship, not just to stem length in peas.
Common Mistakes
- Crossing two tall plants. This tells you nothing, because any offspring ratio could be produced by either or parents, depending on which tall plant you happened to use.
- Using a heterozygous partner. A non-recessive partner does not act as a test. The recessive parent must be guaranteed homozygous.
- Stopping at "1:1 ratio" without the conditional. You must state the two possible outcomes and link each one to a parent genotype, not just give one outcome.
- Omitting the / notation. The mark scheme expects the precise allele symbols; writing "homozygous dominant" without the genotype loses credit in contexts where notation is required.
Things to Be Careful About
- The cross is described, not necessarily performed — but the offspring analysis must be stated, not implied.
- The Punnett square grid itself is not a required mark, but writing out the gametes (e.g. " or from the tall parent; from the dwarf parent") makes the reasoning explicit and is safer in a written answer.
- "Test cross" is a single technical term that earns a mark on its own — do not bury it inside a paragraph.
The scientists P W Brian and H G Hemming identified that the difference in the length of the stem in pea plants was associated with the presence or absence of gibberellin. They published their findings in 1955.
Gibberellin leads to a response in plant cells by binding to specific receptor molecules.
State the term used to describe a molecule, such as gibberellin, that binds to specific receptor molecules and leads to a response in cells.
Answer
Hormone (also accepted: cell signalling molecule / ligand / plant growth regulator).
hormone
Background Concept
Communication between cells in a multicellular organism relies on chemical messengers that travel from one cell to another and trigger a specific response. A hormone is a chemical messenger that is produced in one part of the body and transported to target cells elsewhere, where it binds to specific receptor molecules and brings about a response. Plant hormones such as gibberellin, auxin, cytokinin and abscisic acid control growth, development and responses to the environment.
The phrase "binds to specific receptor molecules" is the defining feature of a hormone: the message is delivered only to cells that carry the matching receptor, which is why hormones can have very specific effects in particular tissues. In plants, where there is no circulating blood system to carry hormones to targets, the same definition applies — hormones such as gibberellin move through the plant (often through vascular tissue or from cell to cell) and act on cells expressing the appropriate receptor.
Understanding the Question
The question stem already gives the definition: "Gibberellin leads to a response in plant cells by binding to specific receptor molecules." The candidate is asked for the single-word term that describes such a molecule. This is direct recall.
Approach
Recognise the definition in the stem and supply the matching term from the specification. "Hormone" is the standard answer; "cell signalling molecule", "ligand" and "plant growth regulator" are all accepted equivalents.
Step-by-Step Reasoning
The stem describes a molecule that:
- is produced by the plant (gibberellin is a plant hormone)
- travels to target cells
- binds to a specific receptor
- triggers a response in those cells
This is, by definition, a hormone. Gibberellin in particular is classed as a plant growth regulator, and at the molecular level it is a ligand — a molecule that binds specifically to another (usually larger) molecule, in this case a receptor protein.
Key Takeaways
- A hormone is a chemical messenger that binds to specific receptors on its target cells.
- "Ligand" and "cell signalling molecule" are acceptable synonyms, especially in a molecular-biology context.
- In plants, the same role is described as a plant growth regulator.
Common Mistakes
- "Enzyme" — incorrect. Enzymes are catalysts, not signalling molecules.
- "Receptor" — incorrect. The question asks for the term describing the signal molecule, not the molecule it binds to.
- "Pheromone" — incorrect. Pheromones are signalling molecules between individuals, not within a single organism.
- "Auxin" — incorrect. Auxin is a specific example of a plant hormone, not the generic term asked for.
Things to Be Careful About
- The mark scheme accepts "hormone", "cell signalling molecule", "ligand" or "plant growth regulator" — all are credited. Pick the one you are most confident in.
- A single word or short phrase is enough; do not write a sentence.
Suggest the response of the cells in the internode region of the stem, as labelled in Fig. 2.1, to the presence of gibberellin and describe how this response affects the trait investigated by Mendel.
Answer
- Gibberellin causes cell elongation in the internode region of the stem.
- This increased cell length makes the stem (and therefore the plant) grow taller, producing the tall phenotype investigated by Mendel.
Cell elongation in the internode; stem grows taller.
Background Concept
Gibberellin is a plant hormone that promotes stem elongation. In pea plants, the classical link between the Le/le gene and gibberellin (worked out by Brian and Hemming in 1955) is that the dominant allele encodes a functional enzyme needed to make active gibberellin. Dwarf plants (carrying two alleles) lack this enzyme and so cannot produce active gibberellin, which is why their stems remain short.
At the cellular level, gibberellin works in two main ways:
- It binds to receptor proteins (such as GID1) inside target cells, marking them for degradation of DELLA repressor proteins, which then allows the cellular machinery for growth to operate.
- It promotes cell elongation — and to a lesser extent, cell division — particularly in the internodes, the regions of stem between two leaf nodes (as labelled in Fig. 2.1).
Internodes are the regions of stem whose growth primarily determines plant height. Many plants (including peas) grow taller by elongating their internodes rather than by adding many new cells along the whole stem length.
Understanding the Question
The question asks two linked things:
- What is the response of the cells in the internode to gibberellin? — a cellular-level answer (cell elongation).
- How does this response affect the trait investigated by Mendel? — a phenotype-level answer (the stem grows taller, producing the tall phenotype).
Two marks are available: one for the cellular response, one for linking it to the trait.
Approach
Work from the cell to the whole plant. First, state the cellular response of the internode cells, then describe the consequence for the trait.
Step-by-Step Reasoning
Cellular response (mark 1).
Gibberellin binds to receptors in the cells of the internode and triggers a signal cascade that allows the cells to elongate. Internode cells therefore increase in length along the longitudinal axis of the stem. (Cell division/mitosis is also accepted by the mark scheme, although the main effect is elongation.)
Link to the trait (mark 2).
Because the internode is the stem region between leaf nodes, lengthening the internode cells makes the internodes — and therefore the whole stem — longer. The plant grows taller. This is the tall-stemmed phenotype that Mendel recorded as the dominant trait in his monohybrid crosses. Plants that cannot make active gibberellin (the dwarf plants) cannot elongate their internodes, so the stem remains short.
Key Takeaways
- Gibberellin's main cellular effect in stems is cell elongation, particularly in the internodes.
- Elongation of internode cells is what produces a taller stem, which is the dominant tall-stem phenotype in Mendel's peas.
- The Le allele is dominant because it allows active gibberellin to be made; le is recessive because the dwarf phenotype only appears when no functional enzyme is present.
Common Mistakes
- Stating only the phenotype ("the plant grows taller") without the cellular response. The question specifically asks for the response of the cells, so "cell elongation" or equivalent is required for the first mark.
- Saying gibberellin causes cell division rather than elongation. Both are accepted by the mark scheme, but in the context of stem height, elongation is the primary effect — and a candidate who writes only "cell division" risks losing the second mark if they then cannot link it to a taller stem clearly.
- Confusing gibberellin with auxin. Both promote cell elongation, but they act in different contexts and through different receptors; the question is about gibberellin, and the mark scheme expects an answer about gibberellin's effect.
- Forgetting to specify the internode. The question points to the internode in Fig. 2.1 for a reason — the cellular response happens there, not in leaves or roots.
Things to Be Careful About
- The answer must address both the cellular response and the phenotypic effect to earn both marks.
- A clear cause-and-effect link (cellular change → taller stem) is the cleanest way to write the second point.
- The connection to the Le/le alleles does not need to be stated in the answer itself, but understanding it helps to frame the response.
Cystic fibrosis is an autosomal recessive genetic disease. People with cystic fibrosis have a homozygous recessive genotype.
Explain the meaning of the terms homozygous and recessive.
homozygous ______
recessive ______
Answer
Homozygous: both alleles of a gene are the same (e.g. AA or aa).
Recessive: the phenotype of the (recessive) allele is masked by a dominant allele; two copies of the (recessive) allele are required for the recessive phenotype to be displayed.
Homozygous: both alleles of a gene are the same. Recessive: an allele whose phenotype is only expressed when two copies are present (it is masked by a dominant allele).
Background Concept
In diploid organisms, every gene exists in two copies — one on each of the pair of homologous chromosomes inherited from the two parents. These two versions of the gene are called alleles, and they may be identical or different. The complete set of alleles an organism carries is its genotype; the observable characteristics that result (also influenced by the environment) make up its phenotype.
When the two alleles at a particular gene locus are identical, the genotype is said to be homozygous at that locus. It can be homozygous dominant (e.g. AA) or homozygous recessive (e.g. aa). When the two alleles differ (Aa), the genotype is heterozygous.
Whether an allele's effect is seen in the phenotype depends on the dominance relationship between the alleles. A dominant allele is one whose effect appears in the phenotype whenever the allele is present (so both AA and Aa show the dominant phenotype). A recessive allele is one whose effect is only seen in the phenotype when no dominant allele is present — that is, only in the homozygous recessive genotype aa. In a heterozygote Aa, the dominant allele's product is sufficient to produce the dominant phenotype, and the recessive allele's effect is hidden or "masked".
Understanding the Question
This is a 2-mark definitions question. The candidate must write a clear explanation of two terms: homozygous and recessive. The question stem notes that cystic fibrosis is autosomal recessive and that affected people are homozygous recessive, providing context for why the terms matter, although the definitions themselves are general biology.
The command word is "Explain the meaning" — so the answer must give the precise biological meaning of each term, not just an example. The mark scheme credits:
- For homozygous: a statement that both alleles of a gene are the same.
- For recessive: a statement about the phenotype being masked by a dominant allele, OR that two copies of the recessive allele are needed for the phenotype to be displayed.
Approach
Write a one-sentence definition for each term, using the precise vocabulary the mark scheme rewards: alleles, gene / genotype, the same, phenotype, masked, dominant, recessive.
Step-by-Step Reasoning
Homozygous:
- A diploid organism has two alleles for every gene.
- "Homozygous" describes the situation where those two alleles are identical — e.g. AA or aa.
- The key statement is that both alleles of a gene are the same.
Recessive:
- An allele is recessive if its phenotypic effect is only visible when there is no dominant allele present.
- A dominant allele (when present) masks the effect of a recessive allele.
- Two copies of the recessive allele (the homozygous recessive genotype) are required for the recessive phenotype to appear.
Key Takeaways
- Homozygous = an identical pair of alleles at a particular gene locus.
- Recessive = an allele whose phenotype is only expressed when the genotype is homozygous recessive (no dominant allele is present to mask it).
- These definitions are foundational for any later work on inheritance patterns, genetic crosses, and population genetics.
Common Mistakes
- Defining homozygous as simply "having two alleles" — too vague. The alleles must be the same.
- Defining recessive as "rare" or "weak" — recessive refers to the dominance relationship, not frequency or strength.
- Saying that a recessive allele "does nothing" — it codes for a product, but the effect is only visible when no dominant allele is present.
- Confusing homozygous with heterozygous — homozygous = identical alleles; heterozygous = different alleles.
Things to Be Careful About
- The mark scheme requires reference to phenotype in the definition of recessive — saying "the allele is masked" without specifying what is being masked (the phenotype) does not earn the mark.
- "Two copies of the allele" or "no dominant allele" both work for the recessive definition — either captures the essence.
- Use precise CIE terminology: gene, allele, genotype, phenotype, dominant, recessive, homozygous, heterozygous.
In 2020:
• there were people with cystic fibrosis in the UK
• the UK population was estimated to be people.
A proportion of people in the UK population are heterozygous for the gene that causes cystic fibrosis and do not have symptoms of the disease.
Use the Hardy–Weinberg principle to calculate the number of people in the UK population who are expected to be heterozygous for the gene that causes cystic fibrosis.
The two equations for the Hardy–Weinberg principle are provided.
equation 1
equation 2
= frequency of the dominant allele
= frequency of the recessive allele
= frequency of the homozygous dominant genotype
= frequency of the heterozygous genotype
= frequency of the homozygous recessive genotype
The first stage of the calculation has been completed for you.
= ______
= ______
= ______
number of people in the UK expected to be heterozygous for the gene = ______
Working
Given :
Answer
; ; ; number of heterozygous people in the UK .
q = 0.0127; p = 0.987; 2pq = 0.0251; number of heterozygotes ≈ 1 680 000
Background Concept
The Hardy-Weinberg principle states that, in a population that is large, has random mating, and is free from evolutionary forces (no mutation, no migration, no natural selection, no genetic drift), the frequencies of alleles and genotypes remain constant from one generation to the next. Two equations describe the equilibrium:
where:
- = frequency of the dominant allele
- = frequency of the recessive allele
- = frequency of the homozygous dominant genotype
- = frequency of the heterozygous genotype
- = frequency of the homozygous recessive genotype
Cystic fibrosis (CF) is an autosomal recessive disease, so affected individuals are homozygous recessive (cc). This means equals the proportion of the population with CF. From this, we can derive , then , then , and finally estimate the number of heterozygotes (carriers) in the population.
Understanding the Question
This is a 3-mark structured calculation question. The question provides:
- 10,800 people with CF in the UK (out of 67,100,000) in 2020
- The first stage of the calculation already done:
- The two Hardy-Weinberg equations and definitions of each variable
The candidate must complete the calculation by:
- Taking the square root of to find .
- Subtracting from 1 to find .
- Calculating (the heterozygote frequency).
- Multiplying by the UK population to find the number of heterozygotes.
Approach
Follow the standard Hardy-Weinberg calculation sequence:
At each stage, substitute values into the appropriate equation, then carry forward. Use unrounded intermediate values to minimise rounding error, then round the final answer to at least 3 significant figures.
Step-by-Step Reasoning
Step 1: Find
The first stage is given: .
To find , take the square root:
Step 2: Find
Using equation 1, :
Step 3: Find (the heterozygote frequency)
Step 4: Find the number of heterozygotes in the UK
Multiply by the total UK population:
Key Takeaways
- The Hardy-Weinberg calculation order is fixed: number of carriers.
- Heterozygote frequency is always greater than the disease frequency, because for small .
- About 1 in 40 people in the UK is a carrier of CF (since ).
- The number of carriers in a population is found by multiplying by the total population size.
Common Mistakes
- Forgetting to take the square root when going from to — a very common error.
- Confusing (allele frequency) with (genotype frequency).
- Multiplying by the population to get the number of carriers — this gives the number with the disease, not the number of carriers.
- Insufficient precision in intermediate steps, leading to a final answer outside the mark scheme's accepted range.
- Reporting the final answer with insufficient significant figures (mark scheme requires 3 or more).
Things to Be Careful About
- The mark scheme accepts (range to ). Round your final answer to 3 significant figures or more.
- Use unrounded intermediate values to avoid compounding rounding errors, then round the final answer.
- The final answer here represents the expected number of heterozygotes under Hardy-Weinberg assumptions. Part (ii) asks why this is an underestimate.
The Hardy–Weinberg principle provides a useful estimate of the number of people in the UK who are heterozygous for cystic fibrosis. However, the estimate is lower than the actual number. This underestimation occurs because not all the conditions of the Hardy–Weinberg principle apply.
In the UK in 2020, the mean life expectancy of:
• people with cystic fibrosis was approximately 50 years
• all people was approximately 80 years.
Explain how this information accounts for the underestimation of the number of people in the UK that are heterozygous for cystic fibrosis.
Answer
- The Hardy-Weinberg principle assumes there is no natural selection; this assumption is violated in the UK because CF reduces survival.
- People with CF have a much lower life expectancy (~50 years) than the general population (~80 years), so the CF allele is selected against.
- Over many generations, natural selection has reduced the frequency of the CF allele in the population, so the current underestimates the historical allele frequency.
- The Hardy-Weinberg calculation uses the current (already reduced) CF prevalence to estimate heterozygote frequency, so the calculated number of heterozygotes is lower than the actual number.
- People with CF who have died in past generations will have passed on the CF allele through reproduction before death, so the current observed does not capture all the CF alleles in the gene pool.
The Hardy-Weinberg estimate is too low because natural selection is removing the CF allele from the population, and the calculation is based on the current (already reduced) CF prevalence.
Background Concept
The Hardy-Weinberg principle assumes that a population is in equilibrium — with no evolutionary forces acting on it. The five conditions are:
- No mutation
- No migration (no gene flow in or out)
- Very large population size (so genetic drift is negligible)
- Random mating
- No natural selection
If any of these conditions are violated, allele and genotype frequencies can change from generation to generation (i.e. evolution can occur). For cystic fibrosis in the UK, the condition of "no natural selection" is clearly violated: people with CF have a substantially lower life expectancy than the general population, so the CF allele reduces the survival of the individuals carrying it.
Natural selection is the differential survival and reproduction of individuals due to differences in their phenotypes. In the case of CF, the homozygous recessive genotype (cc) has a much lower survival rate, so the c allele is selected against — over time, its frequency should decrease. However, the Hardy-Weinberg calculation uses the current observed (CF prevalence) as if it were the equilibrium value, ignoring that selection has been reducing the allele frequency over generations.
Understanding the Question
This is a 3-mark "explain" question. The candidate is given that the Hardy-Weinberg estimate of heterozygotes is lower than the actual number, and is asked to explain why. The key data provided:
- Mean life expectancy with CF: ~50 years
- Mean life expectancy in general population: ~80 years
This is a 30-year difference in life expectancy — clear evidence that natural selection is operating against the CF allele.
Approach
The answer should link the differential life expectancy to natural selection against the CF allele, then explain how this affects the Hardy-Weinberg estimate:
- CF reduces survival → natural selection against the CF allele.
- The current CF prevalence is already the result of selection (the allele has been removed over generations).
- The Hardy-Weinberg calculation uses this reduced prevalence to estimate heterozygote frequency.
- Therefore the estimate is too low.
Step-by-Step Reasoning
Point 1: Natural selection is operating
The Hardy-Weinberg principle requires that there is no natural selection. But the data shows that people with CF live, on average, 30 years less than the general population. This means there is a selection pressure against CF — individuals with the cc genotype are less likely to survive and reproduce than those with other genotypes.
Point 2: The CF allele has been removed by selection
Because people with CF do not survive as long, they are less likely to pass on the CF allele to the next generation. Over many generations, this has caused the frequency of the CF allele in the population to decrease.
Point 3: The Hardy-Weinberg calculation uses the current (reduced) prevalence
The Hardy-Weinberg calculation takes the current observed (CF prevalence) and uses it to estimate the heterozygote frequency . But the current prevalence is already the result of natural selection — the allele would be at a higher frequency if selection had not been operating.
Point 4: Therefore, the estimate underestimates heterozygotes
Because the calculation is based on a CF prevalence that has been reduced by natural selection, the calculated is lower than the historical , and so the calculated is lower than the true number of heterozygotes in the population.
Additionally, people with CF who have died in past generations will have reproduced (or could have reproduced) before death, passing on the CF allele. These alleles are not captured in the current count, so the Hardy-Weinberg estimate is further reduced.
Key Takeaways
- Hardy-Weinberg requires no natural selection; CF violates this condition due to differential survival.
- The current observed is the result of selection, not an equilibrium value.
- Selection removes the recessive allele over generations, so the Hardy-Weinberg estimate of heterozygotes (based on the current ) is too low.
- The Hardy-Weinberg principle gives a useful but approximate estimate; the actual number of heterozygotes can be higher.
Common Mistakes
- Saying the Hardy-Weinberg calculation is "wrong" — it isn't; it's a useful approximation that gives a lower bound.
- Not mentioning natural selection explicitly.
- Saying the calculation doesn't include the heterozygotes' alleles — it does (each heterozygote has one CF allele).
- Confusing the direction of the error — the H-W estimate is too low, not too high.
- Stating that heterozygotes have lower survival — they don't; only homozygous recessives (CF patients) have lower survival.
Things to Be Careful About
- The mark scheme awards up to 3 marks from a list including: natural selection, selection pressure against CF, lower CF survival, heterozygotes calculated from a smaller CF population, deceased CF patients passing on the allele.
- Make sure the explanation is about why the calculation is an underestimate, not just a critique of the assumptions in general.
- Distinguish the effect of selection on allele frequency (decreasing over time) from the effect on heterozygote frequency (calculated from the current, already-reduced ).
- Heterozygotes are not selected against — they are healthy. Only cc individuals are selected against.
A screening programme for cystic fibrosis was introduced in 2007 for all children born in the UK. Children are tested within seven days of their birth. Children identified from the screening programme as being at high risk of having cystic fibrosis can have a genetic test to confirm whether they have the disease.
Table 3.1 shows the median predicted life expectancy for people born in the UK who have cystic fibrosis. Predictions are shown for people born in 2008, 2012, 2016 and 2020.
Table 3.1
| year of birth | median predicted life expectancy / years |
|---|---|
| 2008 | 38.8 |
| 2012 | 43.5 |
| 2016 | 47.0 |
| 2020 | 50.6 |
Describe the trend shown in Table 3.1 and outline how early screening for cystic fibrosis may have contributed to this trend.
Answer
- The median predicted life expectancy for people with cystic fibrosis has increased from 2008 to 2020.
- For example, it rose from 38.8 years in 2008 to 50.6 years in 2020 — an increase of 11.8 years (≈ 30%).
- Early screening allows treatment to be started before symptoms develop, slowing disease progression.
- Better / improved treatments and medical care between 2008 and 2020 have also contributed to the increased life expectancy.
Predicted life expectancy has increased (e.g. from 38.8 years in 2008 to 50.6 years in 2020), partly because early screening allows treatment to begin before symptoms appear.
Background Concept
Cystic fibrosis (CF) is a serious genetic condition caused by mutations in the CFTR gene. It causes thick, sticky mucus to build up in the lungs, pancreas, and other organs, leading to chronic lung infections, digestive problems, and progressive lung damage. Without treatment, life expectancy is severely limited.
Screening is the systematic testing of a population to identify individuals at risk of a condition before symptoms develop. The UK introduced universal newborn screening for CF in 2007, in which all babies are tested within the first week of life (typically with a heel-prick blood spot test). A positive screen is followed by a confirmatory genetic test and a sweat test.
Why screening matters for CF:
- Affected children can be identified before symptoms develop.
- Treatment (antibiotics, physiotherapy, nutritional support, CFTR modulators) can begin immediately, preventing or delaying lung damage and malnutrition.
- Families can receive genetic counselling and support.
- Specialist CF care can be arranged from infancy.
Understanding the Question
This is a 3-mark "describe and outline" question. The candidate must:
- Describe the trend in the data — predicted life expectancy has changed over time.
- Use a data quote to support the description.
- Outline how early screening for CF may have contributed to the trend.
The data:
| Year of birth | Predicted life expectancy (years) |
|---|---|
| 2008 | 38.8 |
| 2012 | 43.5 |
| 2016 | 47.0 |
| 2020 | 50.6 |
The trend is a clear, steady increase. The data quote is up to the candidate (e.g. 38.8 → 50.6, increase of 11.8 years, 30.4% increase, etc.).
Approach
Structure the answer in two clear parts:
- Trend + data quote: identify the direction of the change and quote specific values.
- Link to screening: explain how earlier detection leads to better outcomes.
Step-by-Step Reasoning
Step 1: Describe the trend
The median predicted life expectancy for people with CF has increased from 2008 to 2020.
Step 2: Quote data
Specific values:
- 2008: 38.8 years
- 2012: 43.5 years
- 2016: 47.0 years
- 2020: 50.6 years
Examples of valid data quotes:
- "Increased from 38.8 years in 2008 to 50.6 years in 2020"
- "An increase of 11.8 years"
- "A 30.4% increase"
- Any two specific values with their years
Step 3: Outline how screening has contributed
Early screening means CF is detected in the first week of life, before symptoms appear. This allows:
- Early treatment — antibiotics, physiotherapy, nutritional support, and CFTR modulators can be started immediately.
- Prevention of complications — early intervention slows lung damage and improves nutrition.
- Better long-term monitoring — specialist CF care from infancy.
- Improved prognosis — children with CF who are diagnosed and treated early have a much better outlook than those diagnosed later.
(Note: better treatments and improved care between 2008 and 2020 have also contributed, even without screening.)
Key Takeaways
- "Describe and outline" = trend + data + explanation.
- A clear data quote is essential — generic "it has increased" without numbers is not enough.
- Early screening → early treatment → better outcomes → increased life expectancy.
- Improved treatments (separate from screening) have also contributed.
Common Mistakes
- Describing the trend without a data quote (loses a mark).
- Stating the trend is "decreased" or "fluctuated" — the data clearly shows a steady increase.
- Not linking the trend to screening (e.g. saying only "treatments have improved" without mentioning screening).
- Saying screening "cures" CF — it doesn't, but it improves outcomes.
- Confusing correlation with causation — the link between screening and life expectancy is supported by data, but is also confounded by other medical advances.
Things to Be Careful About
- The question asks for both a description AND an outline — both must be addressed.
- The mark scheme awards 1 mark for the trend, 1 mark for the data quote, and 1 mark for the screening explanation (or 1 mark for "treatment can be started early").
- "Median predicted life expectancy" is a modelled estimate (since people born in 2020 haven't all died yet), not an observed value.
- The link between screening and life expectancy is causal but indirect — screening enables early intervention, which has contributed to the increase alongside other medical advances.
In many countries, a genetic test for cystic fibrosis is available to adults who do not have cystic fibrosis but have a family member who either has cystic fibrosis or is heterozygous for the gene that causes cystic fibrosis.
These adults include partners, parents, offspring, brothers and sisters of the family member. The aim is to find out if any of these adults are heterozygous for the gene that causes cystic fibrosis.
Discuss the ethical and social considerations of making a genetic test for cystic fibrosis available to these adults.
Answer
- A negative result reduces worry / anxiety for the individual and their family.
- A positive result allows the individual to make informed reproductive decisions (e.g. prenatal testing, IVF with pre-implantation genetic diagnosis).
- The test is not 100% accurate, so a result (positive or negative) cannot give complete certainty.
- There may be concerns about cost and availability of the test, particularly in low-resource settings.
- A positive result can lead to further testing, such as genetic counselling, partner testing, or embryo screening.
- Knowing carrier status can allow couples to plan for the care of a child with CF.
- There are potential social concerns: stigma, discrimination (e.g. by insurers or employers), and issues of confidentiality.
Discussion of the benefits (e.g. reduced worry if negative, informed reproductive decisions, planning for care) and drawbacks (e.g. test accuracy, cost, stigma, discrimination, confidentiality) of offering carrier testing for CF to adults with affected family members.
Background Concept
Cystic fibrosis (CF) is an autosomal recessive condition, so an affected child must inherit two copies of the defective allele — one from each parent. Carriers (heterozygotes) are healthy but have a 50% chance of passing the allele to each child. If two carriers have children together, each child has:
- 25% chance of being affected (homozygous recessive)
- 50% chance of being a carrier (heterozygous)
- 25% chance of being unaffected and not a carrier (homozygous dominant)
Genetic testing for carrier status is therefore particularly relevant for adults who have a family member with CF or who are known carriers. Knowing one's carrier status allows individuals to make informed reproductive decisions. In many countries, this testing is available to adults with a relevant family history (partners, parents, offspring, siblings).
Ethical principles relevant to genetic testing include:
- Autonomy — the right of individuals to make their own informed decisions.
- Beneficence — the duty to do good.
- Non-maleficence — the duty to do no harm.
- Justice — fair distribution of benefits and burdens.
Social considerations include the potential impact on individuals, families, and communities:
- Psychological impact (worry, anxiety, relief)
- Stigma and discrimination
- Insurance and employment implications
- Confidentiality of results
- Access to testing (cost, availability)
- Reproductive choices (e.g. prenatal testing, IVF with PGD, choosing not to have children)
Understanding the Question
This is a 3-mark "discuss" question, requiring the candidate to weigh up ethical and social considerations of offering genetic testing for CF to adults with a family history of CF or carrier status. The candidates are NOT CF patients — they are healthy adults who want to know if they carry one copy of the CF allele.
The mark scheme awards up to 3 marks from a list of 7 possible points (see solution). The candidate should provide a balanced discussion, including both benefits and drawbacks.
Approach
Consider both the benefits and drawbacks of offering this testing:
Benefits:
- A negative result can reduce worry or anxiety for the individual and their family.
- A positive result allows the individual to make informed reproductive decisions.
- Couples can plan for the care of a child with CF if both are carriers.
- May prompt further testing (e.g. of a partner, or prenatal/pre-implantation testing).
Drawbacks:
- The test is not 100% accurate — false positives and false negatives are possible.
- There may be cost and availability issues.
- Potential stigma, discrimination, and confidentiality issues (e.g. insurance, employment).
- Psychological burden of a positive result.
Step-by-Step Reasoning
Point 1: Reduces worry if negative (or could cause worry if positive)
A negative result can be a significant relief, especially for an adult who has witnessed a sibling or child affected by CF. Conversely, a positive result can cause considerable worry, both for the individual and for their existing or future family members.
Point 2: Informed reproductive decisions
If an individual discovers they are a carrier, they can:
- Discuss the result with their partner.
- Consider whether their partner should be tested.
- Make informed choices about having children (e.g. prenatal testing, IVF with PGD, adoption, choosing not to have children).
- Plan financially and emotionally for the possibility of having an affected child.
Point 3: Cost and availability
Genetic testing is not always freely available in all healthcare systems. In some countries, it is only available privately at significant cost. This raises questions of equity — should testing be available to everyone who wants it, or only to those who can afford it?
Point 4: Plan for care of an affected child
If both partners are carriers, they may want to plan ahead for the care of a child with CF — financially, emotionally, and practically. This can be empowering for families.
Point 5: Further testing
A positive result may lead to genetic counselling, testing of other family members, or prenatal/pre-implantation testing in future pregnancies. This is a significant cascade of further medical and personal decisions.
Point 6: Test accuracy
No test is 100% accurate. False positives and false negatives can occur, especially in populations where the CF mutation spectrum is diverse. A negative result does not completely rule out being a carrier, and a positive result needs to be confirmed.
Point 7: Stigma, discrimination, insurance, confidentiality
Knowledge of carrier status could lead to:
- Stigma or discrimination from employers, insurers, or society.
- Higher insurance premiums (e.g. life, health, or travel insurance).
- Concerns about who has access to the result (confidentiality of medical records).
- Pressure on family members to also be tested.
Key Takeaways
- "Discuss" requires a balanced consideration of both benefits and drawbacks.
- Carrier testing for CF is a reproductive option with significant personal, family, and societal implications.
- Key ethical considerations: autonomy, informed consent, psychological impact, equity of access, confidentiality.
- Key social considerations: stigma, discrimination, family dynamics, reproductive choices.
Common Mistakes
- Only giving one side of the argument (only benefits or only drawbacks).
- Listing vague points like "it's unethical" or "it causes distress" without specifics.
- Not relating the points to the specific scenario (CF, autosomal recessive, carrier testing in adults with family history).
- Confusing the perspective — the question is about adults who do NOT have CF, not CF patients themselves.
- Talking about the rights of the unborn child rather than the adults being tested.
Things to Be Careful About
- The mark scheme awards up to 3 marks from a list of 7 possible points — be specific and pick credible points.
- Use the ORA (or reverse argument) trick where appropriate: "reduces worry if result is negative; ORA could cause worry if positive".
- Make sure the points are specific to the scenario, not generic statements about genetic testing in general.
- "Discuss" is open-ended — there are many valid answers. The mark scheme lists 7 to choose from; aim to provide a balanced answer covering different aspects.
Holstein Friesian cattle are a breed of cattle used by dairy farmers in many countries of the world for the high milk yield of their cows.
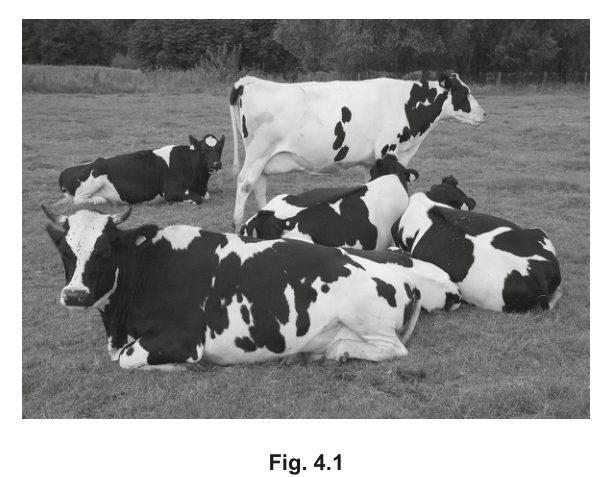
Fig. 4.1 shows Holstein Friesian cattle.
Milk yield in Holstein Friesian cattle is affected by heat stress. Heat stress occurs when homeostatic mechanisms are not enough to keep the body temperature down to normal levels.
One of the factors that contributes to heat stress is air temperature.
Fig. 4.2 shows:
• the mean daily air temperature in Central Europe
• the mean monthly milk yield per cow of Holstein Friesian cattle in Central Europe.
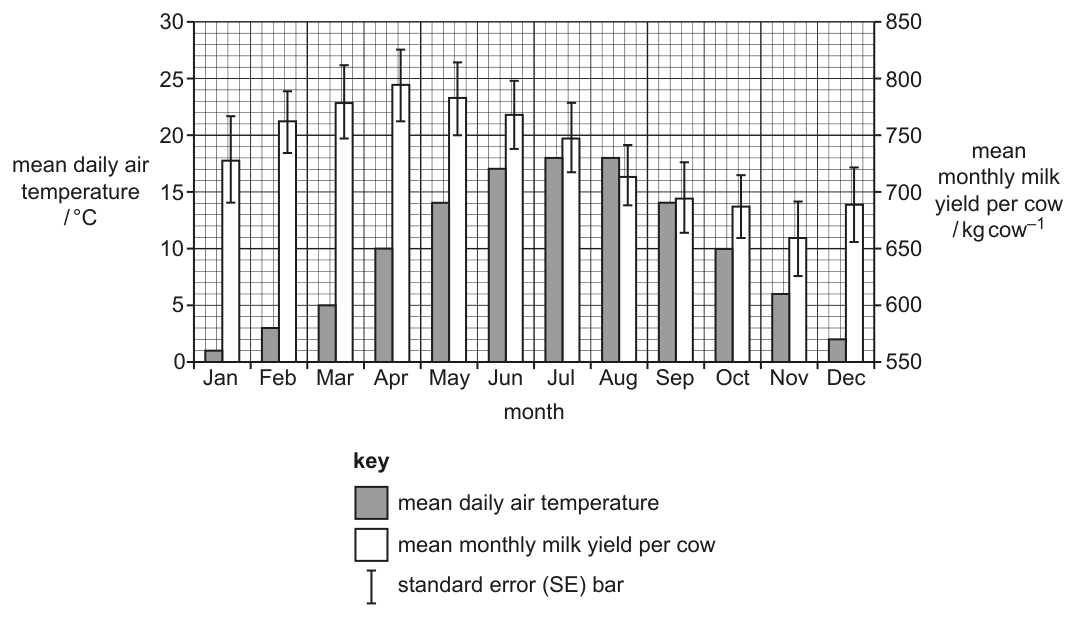
With reference to Fig. 4.2, describe the trends in air temperature and milk yield from April to August.
Answer
- From April to August the mean daily air temperature increases (from 10 °C to 18 °C) while the mean monthly milk yield per cow decreases (from 792–798 to 711–716 ).
Temperature rises while milk yield falls; e.g. April: 10 °C and 792–798 kg cow⁻¹; August: 18 °C and 711–716 kg cow⁻¹.
Background Concept
Holstein Friesian cattle are a high-yielding dairy breed whose milk production is sensitive to environmental conditions, particularly heat stress. Heat stress occurs when an animal's homeostatic mechanisms (sweating, panting, reducing metabolic rate) cannot dissipate heat fast enough, so core body temperature rises. Sustained high temperatures reduce feed intake, alter metabolism, and divert energy away from milk synthesis, lowering yield.
Fig. 4.2 is a paired bar chart in which the grey bars (left axis) give mean daily air temperature and the white bars (right axis) give mean monthly milk yield per cow, with standard-error bars. Reading across the months from April to August, the temperature bars rise while the yield bars fall — a clear inverse relationship over this part of the year.
Understanding the Question
The command word is describe, and the mark scheme requires two points: a qualitative statement of the trends, and a quantitative comparison supported by figures taken from the graph. You must mention BOTH variables and say how each changes between the two named months.
Approach
Look at the grey (temperature) bars and the white (yield) bars for April and August. The temperature bar grows taller between these two months; the yield bar shrinks. To earn the second mark, take a numerical read-off from each bar and quote the values with their units.
Step-by-Step Reasoning
- April: the grey bar reaches 10 °C on the left-hand axis.
- August: the grey bar reaches 18 °C on the left-hand axis — temperature has risen.
- April: the white bar reaches the right-hand axis level of approximately 792–798 .
- August: the white bar reaches approximately 711–716 — yield has fallen.
- Therefore, as temperature increased from 10 °C to 18 °C, mean monthly milk yield per cow fell from roughly 795 to roughly 714 , consistent with heat stress suppressing production.
Key Takeaways
- Heat stress in cattle is associated with reduced milk yield.
- Dual-axis bar charts must be read against the correct axis; always check the legend and key.
- Describe requires both the trend (qualitative) and supporting data (quantitative).
Common Mistakes
- Quoting only one variable (e.g. "temperature increases") without mentioning milk yield.
- Giving a comparison without any numerical values.
- Reading off the wrong axis (the right-hand axis is for yield, not temperature).
Things to Be Careful About
- The mark scheme accepts a small range because you are reading off a graph by eye; values such as 10 °C and 795 in April, 18 °C and 714 in August are all acceptable.
- Quote the units (°C and ).
Many dairy farmers in tropical regions use cattle breeds that are tolerant to heat stress (heat-tolerant cattle). These heat-tolerant cattle:
• can tolerate higher air temperatures than Holstein Friesian cattle before heat stress occurs
• have milder symptoms of heat stress than Holstein Friesian cattle for the same high air temperatures.
Where heat stress does not occur, heat-tolerant cattle produce a lower milk yield than Holstein Friesian cattle under the same conditions.
Scientists compared DNA sequences of Holstein Friesian cattle and heat-tolerant cattle for a number of genes known to have an effect on body temperature.
Twenty genes were found that had alleles associated only with heat-tolerant cattle.
With reference to the information provided, including the data in Fig. 4.2:
• state the type (pattern) of phenotypic variation shown by milk yield in cattle
• identify factors that cause phenotypic variation in milk yield in cattle.
In each case, give a reason for your choice.
type (pattern) of phenotypic variation and reason for choice ______
factors that cause phenotypic variation and reason for each choice ______
Answer
- Type of variation: continuous — milk yield shows a range of values with no distinct categories (e.g. as the months in Fig. 4.2 show a smooth change rather than discrete classes).
- Environmental factor: air temperature — Fig. 4.2 shows that milk yield changes with mean daily air temperature, indicating an environmental effect.
- Genetic factor: many / polygenic — twenty different genes were identified that affect body temperature (and therefore milk yield under heat stress), and heat-tolerant cattle have a different (lower) milk yield than Holstein Friesian cattle under the same conditions, showing a genetic contribution.
Continuous variation; environmental cause = air temperature (from Fig. 4.2); genetic/polygenic cause = 20 genes / different breeds (heat-tolerant vs Holstein Friesian) give different yields.
Background Concept
Phenotypic variation within a species can be:
- Discontinuous — falls into discrete categories with no intermediates (e.g. ABO blood groups, Mendel's pea seed shape).
- Continuous — shows a full range of values with no clear categories (e.g. height, mass, milk yield); typically produced by the combined action of many genes (polygenic) plus environmental effects.
The causes of phenotypic variation are therefore genetic (alleles at one or many loci) and environmental (diet, temperature, light, etc.). Where many genes contribute, the trait is described as polygenic.
Understanding the Question
The stem explicitly supplies the information you need:
- Fig. 4.2 shows monthly milk yields that change gradually with temperature — a smooth range, not distinct categories.
- Twenty different genes were found to be associated with heat tolerance and therefore influence milk yield.
- Heat-tolerant and Holstein Friesian cattle produce different milk yields under the same conditions — a genetic difference independent of environment.
You must (1) name the type of variation with a reason, and (2) identify causes of variation with reasons.
Approach
Apply the textbook definitions to the evidence given:
- Smooth range of values → continuous variation.
- Yield changes with air temperature → environmental cause.
- 20 different genes have an effect, and the two breeds differ → polygenic / genetic cause.
Step-by-Step Reasoning
- Type of variation — continuous: Fig. 4.2 shows milk yields that fall gradually from month to month rather than into sharply separated groups. There are intermediate values, so the variation is continuous, not discontinuous.
- Environmental cause — air temperature: The graph demonstrates that yield falls as temperature rises. Air temperature is an external (environmental) factor that influences the phenotype.
- Genetic cause — polygenic / many genes: Scientists identified 20 genes associated with body temperature and heat tolerance. In addition, under identical conditions, heat-tolerant cattle produce less milk than Holstein Friesian cattle, indicating that the genetic constitution of the two breeds influences yield. A trait influenced by many genes is polygenic, producing continuous variation when combined with environmental effects.
Key Takeaways
- Continuous variation arises from the combined action of many genes and environmental influences.
- A graph showing a smooth range of values, not discrete classes, is the classic signature of continuous variation.
- Identifying a cause of variation requires a piece of evidence from the question that points to it.
Common Mistakes
- Saying "discontinuous" because different breeds have different yields — breeds overlap in their ranges, so the trait is continuous.
- Naming only one cause (genetic OR environmental) when both apply.
- Giving a reason that does not actually use the data provided (e.g. citing "diet" without any evidence in the question).
Things to Be Careful About
- The mark scheme requires a reason for each choice — not just the label.
- "Polygenic" must be tied to the evidence of many genes, not asserted on its own.
- "Continuous" must be tied to the absence of distinct categories, not just to the existence of a graph.
The scientists found that one of the genes studied, PRLR, has a dominant allele known as SLICK. The SLICK allele was identified in Senepol cattle, a heat-tolerant breed, and is not found in Holstein Friesian cattle.
Cattle with the SLICK allele have short hair due to reduced hair growth.
Scientists have used selective breeding to introduce the SLICK allele into Holstein Friesian cattle. The milk yields of normal Holstein Friesian cattle and Holstein Friesian cattle with the SLICK allele are shown in Fig. 4.3, during:
• March, when the mean daily air temperature is .
• September, when the mean daily air temperature is .
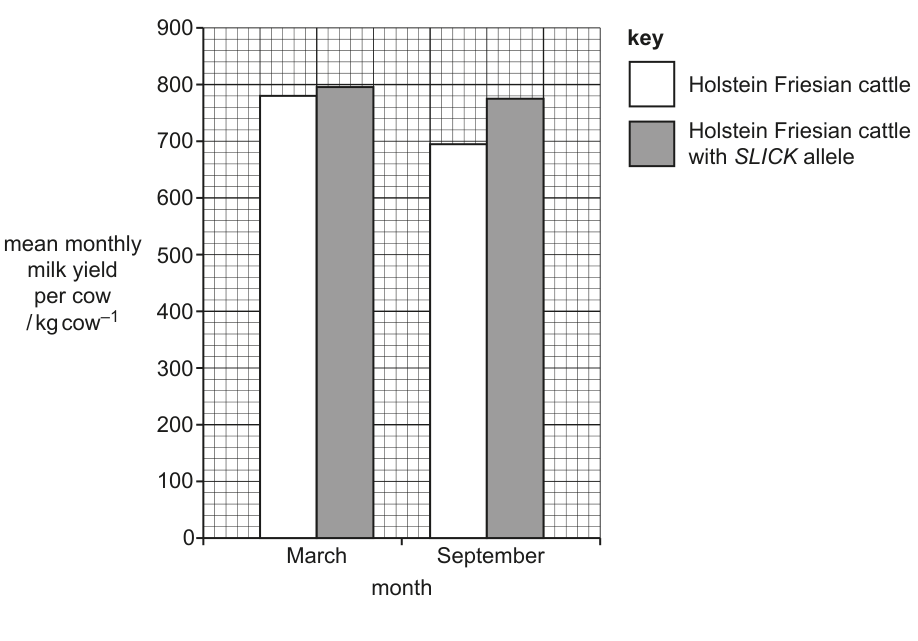
With reference to Fig. 4.3, describe the effect of the SLICK allele on milk yield in Holstein Friesian cattle.
Answer
- In both March and September, Holstein Friesian cattle with the SLICK allele produce a higher mean monthly milk yield than normal Holstein Friesian cattle.
- In March (5 °C) the difference is small: ~780–785 (normal) versus ~795–800 (SLICK).
- In September (14 °C) the difference is much larger: ~690–700 (normal) versus ~770–780 (SLICK).
- Cattle with the SLICK allele maintain their milk yield between March and September, whereas normal cattle show a large fall in yield as conditions become warmer.
The SLICK allele increases milk yield in both months, with a small difference at 5 °C and a much larger difference at 14 °C; SLICK cattle maintain yield while normal cattle show a fall.
Background Concept
The SLICK allele is a dominant allele of the PRLR (prolactin receptor) gene. It arose in Senepol cattle and produces a short-haired phenotype that helps the animal lose heat more readily, reducing the impact of heat stress. Because heat stress depresses milk yield, an allele that mitigates heat stress should improve milk yield — but only in conditions warm enough to cause heat stress.
Fig. 4.3 compares the same breed (Holstein Friesian) with and without SLICK at two different mean daily air temperatures. This is a controlled comparison: the only genetic difference is the PRLR allele, so any difference in yield can be attributed to it.
Understanding the Question
The command word is describe. You need to use Fig. 4.3 to explain what the SLICK allele does to milk yield. The mark scheme rewards:
- a general statement that SLICK increases yield,
- a small difference in March (cool month) and a larger difference in September (warmer month),
- the observation that SLICK cattle maintain their yield across the two months while normal cattle do not,
- supporting figures from the graph.
Approach
Read the four bars in Fig. 4.3 and compare them: the white bars are normal Holstein Friesian cattle, the grey bars are SLICK carriers. Note the size of the gap between the two bars in March versus September, and note whether the bars change height between the two months.
Step-by-Step Reasoning
- Overall effect — In both March and September the SLICK bar is taller than the normal bar, so the SLICK allele increases milk yield in both months (mp1).
- March, 5 °C — The two bars are close in height: normal ≈ 780–785 and SLICK ≈ 795–800 , a difference of about 15 — small (mp2).
- September, 14 °C — The gap is much wider: normal ≈ 690–700 and SLICK ≈ 770–780 , a difference of about 80 — much larger (mp3).
- Stability of yield — Comparing the SLICK bars between the two months, the height barely changes (≈ 800 versus ≈ 775 ), while the normal bars fall markedly (≈ 785 → ≈ 695 ). SLICK cattle maintain their milk yield across both temperatures (mp4).
- Biological interpretation — At 5 °C, neither animal is heat-stressed, so the SLICK phenotype offers little extra benefit. At 14 °C, normal Holsteins begin to suffer heat stress and their yield falls, whereas the short hair of SLICK cattle allows better heat loss and the yield is preserved.
Key Takeaways
- The effect of an allele can depend on the environment — SLICK is most beneficial at warmer temperatures.
- When describing a graph comparison, give the direction of the effect, the size of the difference, and supporting figures.
- Maintain the distinction between "the allele increases yield" (always true in this dataset) and "the allele maintains yield" (true relative to the normal comparison across the two months).
Common Mistakes
- Stating only the direction of the effect without comparing March and September.
- Omitting numerical values from the graph.
- Saying SLICK "decreases" milk yield because one of the months shows a small fall — read both bars; the SLICK bar is always at least as high as the normal one.
- Confusing the alleles of the gene with the alleles affecting the trait — the SLICK allele is a single allele whose effect is described, not a comparison between two alleles within the same cow.
Things to Be Careful About
- Quote the figures from the graph, not invented values.
- Use the units and the temperatures °C as in the question.
- A small difference means a small gap between the bars, not a small absolute yield.
The SLICK allele differs from the recessive allele by a single nucleotide deletion. This results in a frameshift mutation and introduces a premature stop codon in the PRLR gene.
Scientists can use gene editing to replicate this mutation in Holstein Friesian cattle. This provides a way to introduce the SLICK allele into Holstein Friesian cattle without selective breeding.
Compare gene editing and selective breeding for introducing the SLICK allele into Holstein Friesian cattle.
Include similarities and differences in your answer.
Answer
- Similarity: both methods are used to introduce the SLICK allele into Holstein Friesian cattle to improve heat tolerance and milk yield, and both are performed by humans under controlled, artificial conditions.
- Difference — speed: gene editing can produce offspring carrying the SLICK allele in a single generation, whereas selective breeding is carried out over many generations.
- Difference — which animals get the allele: with gene editing, all offspring receive the SLICK allele; with selective breeding, only some offspring inherit it because it segregates during meiosis.
- Difference — number of genes affected: gene editing alters only the PRLR gene; selective breeding transfers a large block of DNA so it can affect many other genes.
- Difference — genetic diversity: gene editing preserves the rest of the genome and therefore maintains heterozygosity and desirable characteristics, whereas selective breeding reduces genetic variation and may lose desirable traits.
- Difference — procedure: gene editing is performed in a laboratory on embryos, zygotes or cells using molecular techniques and so requires specialist equipment and training; selective breeding is performed on the farm by mating or artificial insemination.
- Difference — outbreeding: gene editing does not require introducing a different breed so no outbreeding is needed; selective breeding requires outbreeding with Senepol cattle and back-crossing to Holstein Friesian.
- Difference — regulation: gene-edited animals may require regulatory approval before use; selectively bred animals generally do not.
- Difference — unknowns: gene editing is a new technique and may have negative or unknown long-term effects, whereas selective breeding uses a naturally occurring allele whose effects are well documented.
Both introduce the SLICK allele artificially. Gene editing is faster, affects only PRLR, gives all offspring the allele, preserves genetic variation, is done in a lab on embryos, does not need outbreeding, and may need regulatory approval; selective breeding takes many generations, transfers many genes, gives only some offspring the allele, reduces genetic variation, is done by mating, requires outbreeding, and does not need regulatory approval.
Background Concept
Selective breeding is the traditional method of improving livestock: animals with the desired trait (here, heat tolerance in Senepol cattle) are mated with the breed to be improved (Holstein Friesian) and the offspring carrying the desired allele are selected and back-crossed over many generations. The whole genome of the donor parent is being transferred, so other (often unwanted) alleles come along too.
Gene editing uses molecular tools (e.g. CRISPR–Cas9) to make a precise change at a specific locus. Here, a single nucleotide deletion is introduced into the PRLR gene of a Holstein Friesian zygote, replicating the SLICK mutation. Only the targeted gene is altered; the rest of the genome remains that of the recipient breed.
The two methods therefore differ in speed, precision, side-effects on other genes, impact on genetic diversity, and regulatory and ethical considerations.
Understanding the Question
The command word is compare, and the mark scheme requires both similarities and differences for six marks. The list of 12 possible marking points in the mark scheme shows the breadth expected: similarity, effect, confirmation, agency, gene number, proportion of offspring, generations, location of procedure, technical demands, genetic variation, regulation, and outbreeding.
Approach
For each row of the mark scheme, give a one-clause statement for the gene editing side and, where the mark scheme asks for a contrast, a one-clause statement for the selective breeding side. Aim for at least six distinct points.
Step-by-Step Reasoning
- Similarity — both are artificial / performed by humans. (mp4) Whether the allele is introduced by gene editing in a lab or by selective breeding on a farm, in both cases humans choose the parents and decide which animals to keep.
- Similarity — both produce first-generation offspring that can be screened. (mp1 + mp3) In both methods, the first (or near-first) generation can be checked for the SLICK allele by genetic testing (DNA) or by phenotypic observation (short hair).
- Difference — gene number. (mp5) Gene editing alters only the PRLR gene; selective breeding transfers the whole genome of the donor (Senepol), so many other genes are brought in alongside.
- Difference — proportion of offspring with the allele. (mp6) Because gene editing acts on the zygote, all offspring are homozygous or heterozygous for the edited allele. With selective breeding, the allele segregates and only some offspring inherit it.
- Difference — speed. (mp7) Gene editing produces SLICK cattle in one generation; selective breeding takes many generations of crossing and back-crossing.
- Difference — procedure / location. (mp8 + mp9) Gene editing is performed in a laboratory on embryos, zygotes or cells using molecular methods and requires training and equipment. Selective breeding is performed on the farm by mating (or artificial insemination) — a physiological method that needs no molecular equipment.
- Difference — outbreeding. (mp12) Gene editing can be done within the Holstein Friesian breed, so no outbreeding is required. Selective breeding requires crossing with a different breed (Senepol), introducing genes from outside the breed.
- Difference — genetic diversity. (mp10) Because gene editing changes only one locus, it maintains the rest of the genome and therefore the heterozygosity and desirable characteristics of Holstein Friesian cattle. Selective breeding, especially with repeated back-crossing and selection, reduces genetic variation and risks losing desirable traits.
- Difference — regulation. (mp11) Gene-edited animals are produced by a novel technique and typically require regulatory approval (in many countries they are treated like GMOs). Selectively bred animals are produced by conventional breeding and do not require such approval.
- Difference — known vs unknown effects. (mp2) Because SLICK is a naturally occurring allele, its effects are well established; selective breeding is therefore relatively predictable. Gene editing is a newer technique and may have negative or unknown long-term effects on the animal.
Key Takeaways
- Gene editing and selective breeding can achieve the same outcome (introducing SLICK) but at very different speeds, with very different impacts on the rest of the genome.
- Selective breeding moves a whole block of DNA from donor to recipient, so linked alleles come along too — this is why it is slow and reduces variation.
- Gene editing is precise but raises regulatory and ethical questions because it is a new molecular technology.
Common Mistakes
- Listing only differences and no similarities (or vice versa).
- Repeating the same idea twice (e.g. "selective breeding takes longer" and "selective breeding takes many generations").
- Saying gene editing "does not change any genes" — it does change one specific gene.
- Saying selective breeding "does not reduce genetic variation" — repeated selection with a limited breeding pool does reduce variation.
- Omitting the practical contrast (lab vs farm) and the regulatory contrast.
Things to Be Careful About
- A compare question usually needs the two methods side by side in each point; a one-sided list does not satisfy the question.
- Do not invent advantages for either method that are not supported by the question (e.g. do not claim gene editing is "cheaper").
- Keep the technical terms precise: allele, gene, genome, outbreeding, heterozygosity.
Complete the following paragraphs using the most appropriate word or words.
The theory of evolution describes a process that can lead to the formation of new species from pre-existing species over ______ .
DNA sequence data of different species can be compared to show evolutionary relationships. Two species that have a more recent common ancestor share more ______ in the DNA nucleotide sequences of their genomes than two species that are more distantly related.
Mitochondrial DNA can also be used in the study of evolutionary relationships. Mitochondrial DNA is inherited only from the female gamete, and its nucleotide sequence is unaffected by ______ during the production of gametes.
DNA sequence data can be stored in large biological ______ , allowing faster comparison of the nucleotide sequences of genomes using computer software. DNA sequence data can also be used to predict the ______ sequences of proteins produced by a species.
A ______ can be used to detect many different mRNA molecules at the same time in studies that compare gene expression between different species.
Answer
- (many) generations / (many) years / (a long) time
- mutations (similarities)
- meiosis / crossing over / recombination
- databases
- amino acid
- microarray
(many) generations; mutations/similarities; meiosis/crossing over/recombination; databases; amino acid; microarray
Background Concept
Evolution is the change in the heritable characteristics of a population over successive generations, driven largely by natural selection acting on genetic variation. The accumulation of small genetic changes — chiefly mutations and the reshuffling of alleles through meiosis — over long periods of time can eventually give rise to new species (speciation). Because DNA mutates slowly and predictably, the number of differences (or, viewed the other way round, the number of similarities) in the nucleotide sequences of two species' genomes is a molecular clock: species sharing a more recent common ancestor show fewer sequence differences than those whose common ancestor lies further in the past.
Two laboratory resources are central to modern comparative genomics. First, large biological databases (such as GenBank, EMBL-EBI and DDBJ) store DNA sequence data from thousands of species, allowing researchers to retrieve and compare sequences rapidly with computer software. Second, a DNA microarray — a glass slide or chip spotted with thousands of known single-stranded DNA probes representing different genes — can hybridise to fluorescently labelled mRNA (or cDNA) from a sample, allowing the expression of many genes to be measured simultaneously in one experiment.
Mitochondrial DNA (mtDNA) is a circular molecule inherited, in most eukaryotes, exclusively from the mother via the cytoplasm of the ovum. Because sperm mitochondria are usually degraded after fertilisation, mtDNA passes down the maternal line without the genetic reshuffling that nuclear DNA undergoes at meiosis (specifically, no crossing over and no independent assortment of homologous chromosomes).
Finally, because the genetic code is (almost) universal, the order of nucleotides in a gene determines the order in which ribosomes join amino acids together. Comparing nucleotide sequences therefore allows us to predict the amino acid sequences of the proteins a species can produce.
Understanding the Question
This is a six-mark paragraph-completion question. Each blank is to be filled with a single word or short phrase drawn from the A-level syllabus. The paragraph is a continuous passage that links the theory of evolution, comparative genomics using DNA sequence data, the special features of mitochondrial DNA, the role of biological databases, and the use of microarrays to study gene expression. The command word "complete" makes clear that a single, precise term is required for each blank; vague synonyms are unlikely to score.
Approach
Read the paragraph as a whole first to understand the narrative flow, then tackle each blank in turn. For each gap, identify the grammatical context (the surrounding words) and the biological concept being tested, and supply the most specific syllabus term. The mark scheme's accepted answers are: (1) a long period of time/generations; (2) mutations or similarities; (3) meiosis (or crossing over/recombination); (4) databases; (5) amino acid; (6) microarray.
Step-by-Step Reasoning
Blank 1 — "over _______"
The sentence is describing evolution as a process that produces new species from pre-existing species. Evolution is a gradual process acting across many generations. The mark scheme accepts "(many) generations", "(many) years" or "(a long) time". Any one of these earns the mark.
Blank 2 — "share more _______"
The sentence explains that two closely related species share more of something in their DNA than two distantly related species. The two complementary ideas are:
- "more similarities" — closer relatives have DNA sequences that look more alike; or
- "more mutations" would, on its face, seem wrong (more closely related species actually share fewer mutations), but in the mark scheme's context this is accepted as a paraphrase referring to the sequence differences that have accumulated. The cleanest answer is mutations (meaning the sequence differences that arose by mutation, which are fewer in close relatives and more numerous in distant relatives), but similarities is the more intuitive wording and is equally credited.
Blank 3 — "unaffected by _______"
The sentence explains why mitochondrial DNA is so useful: it does not undergo the genetic reshuffling that nuclear DNA does during gamete formation. The mark scheme accepts meiosis as the overarching process, or the more specific crossing over / recombination events that occur during prophase I of meiosis.
Blank 4 — "large biological _______"
This is asking where the enormous volume of DNA sequence data is stored for computer-based comparison. The answer is databases (e.g. GenBank, EMBL, DDBJ).
Blank 5 — "predict the _______ sequences of proteins"
Because the genetic code is essentially universal, knowing the order of nucleotides in a gene allows the order of amino acids in its protein product to be predicted. The answer is amino acid.
Blank 6 — "A _______ can be used to detect many different mRNA molecules"
The laboratory tool that simultaneously detects thousands of different mRNA species (or their cDNA copies) is a microarray (also called a DNA chip or gene chip).
Key Takeaways
- Evolution operates over long timescales (many generations), so genetic change accumulates gradually.
- DNA sequence comparison acts as a molecular clock: closely related species share more sequence similarity (fewer mutational differences) than distantly related species.
- Mitochondrial DNA is maternally inherited and does not undergo meiotic recombination, making it valuable for tracing maternal lineages.
- Bioinformatics depends on large shared DNA databases for sequence comparison.
- Knowing a gene's nucleotide sequence allows prediction of the amino acid sequence of its protein product via the genetic code.
- A microarray is the tool of choice for measuring the expression of many genes at once.
Common Mistakes
- Writing "time" alone, when the mark scheme prefers "(a long) time" or a more specific phrase such as "(many) generations".
- Confusing the second blank and writing "base pairs" — the mark scheme wants the concept of sequence differences (mutations) or sequence likeness (similarities).
- Writing "mitochondria" for the third blank — the question asks about the process that does not affect mtDNA, which is meiosis (or crossing over/recombination).
- Writing "genes" or "genomes" instead of "databases" for the fourth blank — the question asks about the resource in which sequence data is stored.
- Writing "DNA" instead of "amino acid" for the fifth blank — the question is about the protein sequence, not the nucleic acid sequence.
- Writing "gel electrophoresis" or "PCR" for the sixth blank — both are molecular biology techniques, but only the microarray is the device that detects many different mRNA molecules simultaneously.
Things to Be Careful About
- Each blank is a separate marking point; an incorrect or vague answer for one blank does not affect the marks for the others.
- The mark scheme allows either "mutations" or "similarities" for blank 2 — these are essentially opposites, but both are credited because the surrounding sentence is referring to the same underlying concept of sequence divergence. Choose whichever you can articulate most confidently.
- The third blank accepts any of three acceptable answers (meiosis, crossing over, recombination) because all describe the same gamete-formation process that mtDNA bypasses. "Fertilisation" or "mutation" would not be accepted because they are not the correct biological process.
- Do not write "computer" or "internet" for the fourth blank; "databases" is the precise syllabus term.
- "Microarray" is sometimes spelled "micro array" (two words) in older texts; either is fine, but the syllabus uses the single-word spelling.
A respirometer is a piece of apparatus that can be used to measure the rate of respiration of living tissue such as germinating peas.
A simple respirometer is shown in Fig. 6.1.
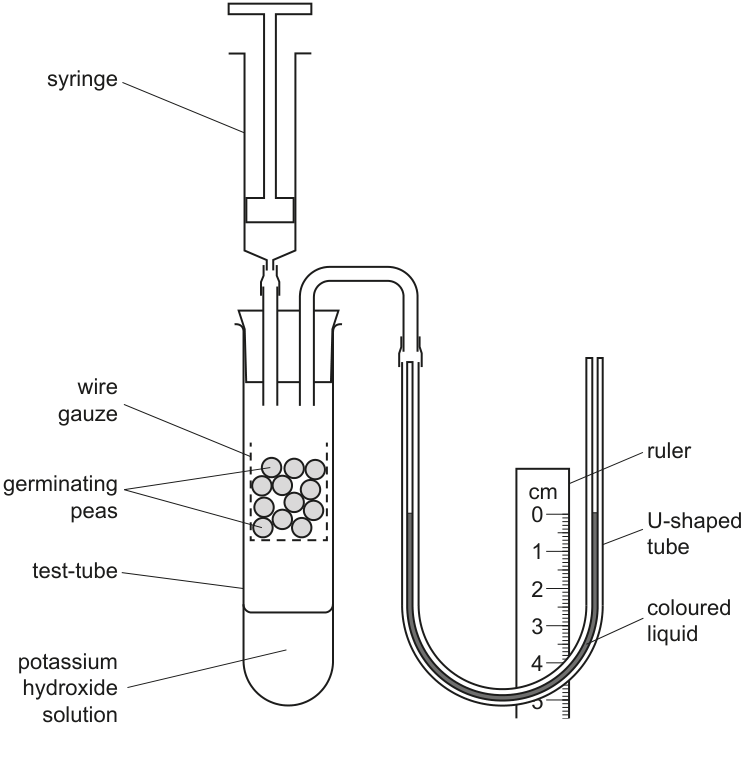
A student carried out an investigation to determine the effect of temperature on the rate of respiration of germinating peas.
• The student set up the respirometer as shown in Fig. 6.1 and placed the respirometer in a water-bath at .
• After five minutes, the student used the syringe to adjust the position of the coloured liquid in the right-hand side of the U-shaped tube so that it lined up with on the ruler. The student immediately started a timer.
• The germinating peas used up oxygen, causing the coloured liquid in the U-shaped tube to move.
• The student measured the distance moved by the coloured liquid after 20 minutes.
• The student repeated the experiment at temperatures of , , and .
Answer
The potassium hydroxide solution absorbs the carbon dioxide produced by the respiring germinating peas (so any change in gas volume inside the respirometer is due only to oxygen uptake).
To absorb the carbon dioxide produced by the respiring peas.
Background Concept
A respirometer is a closed apparatus that measures the net change in gas volume when a living tissue respires. Aerobic respiration consumes and releases in roughly equal volumes, so the gas volume inside a sealed tube would stay almost constant if both gases were present. To turn the respirometer into a true measure of oxygen uptake, the must be removed. Potassium hydroxide () reacts with :
so the only net change in gas volume is the loss of oxygen. This causes the pressure inside the sealed tube to fall, drawing the coloured liquid up the U-shaped tube towards the test-tube side. The distance the liquid moves is therefore a direct measure of oxygen uptake by the peas.
Understanding the Question
The command word is "state", so a single concise sentence is all that is needed. The mark scheme rewards the idea that KOH removes the released by the peas.
Approach
Recall that respirometers rely on absorbing the so that oxygen uptake alone causes the liquid to move.
Step-by-Step Reasoning
- Germinating peas respire aerobically, taking in and giving out .
- Inside the sealed respirometer, is consumed and is released — equal volumes, so the gas volume would not change.
- KOH absorbs the , so the volume of gas in the tube decreases in proportion to uptake.
- The coloured liquid moves to compensate for the pressure drop, and this movement is the measurement.
Key Takeaways
The KOH in a respirometer converts what is essentially a closed-volume system into an effective meter by selectively scrubbing out the of respiration.
Common Mistakes
- Saying KOH "absorbs oxygen" or "absorbs gas" — the role is specifically to absorb .
- Saying KOH "measures" respiration — it does not measure anything, it only conditions the gas mixture.
Things to Be Careful About
The mark scheme requires "carbon dioxide (produced by peas)" — be explicit about which gas is being absorbed and that it comes from the peas, not from the air.
Answer
Any two of:
- Repeat the experiment at each temperature and check how consistent the readings are (e.g. by calculating the standard deviation or standard error, or carrying out a statistical test such as a t-test).
- Set up a control respirometer (e.g. one containing glass beads, or dead/boiled peas, of the same volume as the germinating peas) at each temperature and subtract any movement of the coloured liquid seen in the control from the experimental reading — this corrects for changes in gas volume due to temperature or atmospheric pressure rather than respiration.
- Check that all variables other than temperature (e.g. volume of peas, volume and concentration of the solution, mass of peas, time allowed) are kept constant between trials so that only temperature differs between experiments.
Use repeats to check consistency (e.g. via standard deviation or a statistical test) and/or set up a control respirometer with glass beads or dead peas to correct for physical effects.
Background Concept
"Validity" in experimental biology means the extent to which the results actually measure what the experiment claims to measure — here, the effect of temperature on respiration rate. Two broad classes of issue threaten validity:
- Physical/environmental artefacts: changes in gas volume that are not caused by respiration (e.g. expansion of air as the respirometer warms up in the water-bath, or changes in atmospheric pressure).
- Confounding variables: other things that vary between trials alongside the independent variable (e.g. different volumes of peas at each temperature).
Validity is distinct from reliability (whether the result can be repeated); valid results are usually also reliable, but reliable results are not automatically valid.
Understanding the Question
The command word is "suggest", so the candidate is free to propose a range of methods. Two marks are available and the mark scheme offers four alternative marking points, any two of which earn the marks. The strongest answers combine a control with a repeat-and-statistics approach.
Approach
To improve validity: (1) remove or account for any movement not caused by respiration, and (2) confirm that the independent variable is the only thing that differs between trials. A control apparatus addresses (1); repeats, statistics and standardised variables address (2).
Step-by-Step Reasoning
- Idea of repeatability: perform the experiment more than once at each temperature. Compare the readings: the more similar the repeats, the more confidence in the result.
- Statistical measure: quantify the spread of the repeats — calculate the standard deviation, standard error, or carry out a named test (t-test, correlation). A small spread means the data are consistent.
- Control respirometer: set up a second respirometer identical to the first, but with glass beads (or an equal volume of dead/boiled peas) instead of living peas. This control should show little or no liquid movement, but any small movement reveals changes due to temperature or pressure. Subtract the control reading from the experimental reading.
- Checking other variables: confirm that volume of peas, mass of peas, volume and concentration of , time, and the orientation of the apparatus are the same at every temperature — only the temperature should vary.
Key Takeaways
Validity of a respirometer experiment is improved by (i) a control to remove non-respiratory movement and (ii) repeats with statistics to confirm consistency, plus (iii) standardising every variable other than the one being tested.
Common Mistakes
- Confusing validity with reliability and only suggesting "do more repeats" — repeats alone improve reliability, not validity.
- Suggesting a "control with no peas" rather than specifying an equal volume of glass beads or dead peas, which would not have the same heat capacity / mass / gas space.
- Vague answers such as "improve accuracy" or "reduce human error" — the mark scheme rejects these.
Things to Be Careful About
The control must be as close to the experimental set-up as possible, differing only in whether the peas are alive. Volume of material is critical because it determines the gas space inside the tube.
Explain why the respirometer was left in the water-bath for five minutes before starting the experiment.
Answer
To allow the air inside the respirometer (and the peas themselves) to equilibrate to the temperature of the water-bath, so that the experiment starts with everything at the same temperature and the rate measured is not inflated or depressed by warming/cooling of the gas during the trial.
To allow the peas and the air inside the respirometer to equilibrate/acclimatise to the water-bath temperature before timing starts.
Background Concept
Gas volume is highly sensitive to temperature (Charles's law: at constant pressure, volume is proportional to absolute temperature). Inside a sealed respirometer any temperature change will expand or contract the trapped air, moving the coloured liquid independently of respiration. The same principle means enzyme activity — and therefore respiration rate — only becomes stable once the peas themselves are at the target temperature.
Understanding the Question
The procedure leaves the respirometer in the water-bath for five minutes before adjusting the meniscus to zero and starting the timer. The command word is "explain", and one mark is available. The mark scheme accepts the single word "acclimatisation" or "equilibration".
Approach
Identify what is being allowed to equilibrate: the peas, the air inside, and the KOH solution all need to reach the water-bath temperature so that the initial reading represents a true zero rather than a transient thermal-expansion effect.
Step-by-Step Reasoning
- At the moment the respirometer is placed in the water-bath, the peas and the air inside the tube are at room temperature, not at the bath temperature.
- Over the first few minutes, heat transfers from the bath into the tube, warming the air (which expands) and warming the peas (which alters enzyme activity).
- If timing started immediately, the early part of the run would be dominated by these thermal-transient effects and the measured distance would not reflect respiration at the intended temperature.
- The five-minute wait gives the system time to come to thermal equilibrium, so that the trial starts with both peas and gas already at the target temperature.
Key Takeaways
Any experiment that measures a rate at a set temperature must allow the apparatus and its contents to reach that temperature before timing begins; otherwise thermal expansion or contraction of the air contaminates the result.
Common Mistakes
- "To let the peas germinate" — they are already germinating.
- "To let the KOH absorb the from the previous trial" — irrelevant; this is the start of the experiment.
- "To let the syringe warm up" — too narrow; the main reason is to equilibrate the peas and the trapped air.
Things to Be Careful About
The mark scheme accepts just the single word "acclimatisation" or "equilibration". A full sentence is fine but unnecessary.
The rate of movement of the coloured liquid in the U-shaped tube, calculated from the results, is shown in Table 6.1.
Table 6.1
| temperature / | rate of movement / |
|---|---|
| 10 | 0.40 |
| 20 | 0.70 |
| 30 | 1.30 |
| 40 | 1.15 |
| 50 | 0.60 |
Plot a graph of the results shown in Table 6.1 on the grid in Fig. 6.2. Draw a curved line of best fit.
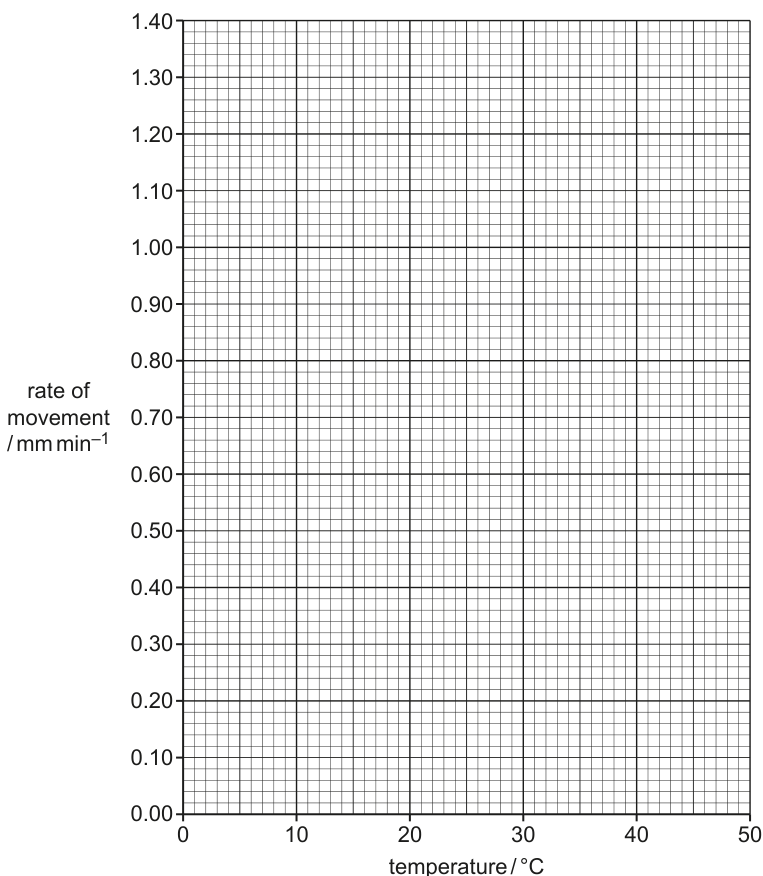
Answer
Plot the five points on Fig. 6.2:
Then draw a single smooth curve of best fit through all five points — rising from at to a peak of at , then falling to at . Do not extrapolate the curve beyond the data range.
Smooth single-peaked curve through the points (10, 0.40), (20, 0.70), (30, 1.30), (40, 1.15), (50, 0.60); peak at 30 °C; no extrapolation.
Background Concept
A good biological graph conveys both the data and the underlying trend. CIE examiners reward:
- correct axis labels with units;
- sensible scales that use at least half the printed grid;
- accurate plotting (a small cross or dot in a clear circle);
- a single smooth curve (or straight line) of best fit, not dot-to-dot joining;
- no extrapolation beyond the range of the data.
Understanding the Question
We are given five pairs of numbers in Table 6.1 and an empty graph grid (Fig. 6.2) whose axes are already labelled and scaled. Two marks are available: one for the five correctly placed points and one for an appropriate smooth curve, and the mark scheme explicitly rejects extrapolation.
Approach
Place each point at the intersection of its x- and y-values, then sweep a single smooth curve through them, taking care that the line is a curve (because the data peak and fall) and is not extrapolated beyond or .
Step-by-Step Reasoning
- Read the axes carefully: x is temperature in °C, with major lines every from to (and minor lines every ). y is rate of movement in , with major lines every from to (and minor lines every ).
- Plot each point at the correct intersection; a small neat cross ("×") in a circle is the cleanest convention.
- ,
- ,
- ,
- ,
- ,
- Inspect the shape: the points rise from to , then fall — so a single smooth curve, not two straight lines, is the right choice. The peak is at .
- Draw a smooth curve of best fit in one continuous sweep. The line should pass as close as possible to all five points; small deviations (a point lying a fraction of a mm off the line) are acceptable because biological data have natural scatter.
- Stop the curve at the data range — do not continue it to or beyond , because that would be extrapolation (the mark scheme rejects this).
Key Takeaways
- A curve of best fit is a single smooth line representing the trend; do not join points with a zig-zag of straight segments.
- Always check whether the data rise and fall — if they do, a smooth curve (not two lines) is the appropriate model.
- Never extrapolate a best-fit curve beyond the data range unless the question asks you to.
Common Mistakes
- Joining the points with a series of straight line segments — this scores zero for "smooth curve".
- Extrapolating the curve to or beyond — explicitly rejected by the mark scheme.
- Mis-reading the y-scale (e.g. placing at the or line).
- Drawing two separate lines (one up, one down) instead of one smooth curve.
Things to Be Careful About
- Use a sharp pencil and a ruler-free hand for the curve.
- Do not extend the curve through the y-axis or past the last data point.
- Each plotted point should be unambiguous; if you use a cross, make the centre lie exactly on the data value.
The rate of movement of the coloured liquid is related to the rate of respiration.
Explain the effect of temperature on the rate of respiration shown in Table 6.1 and Fig. 6.2.
Answer
- Respiration is controlled by enzymes, so its rate is affected by temperature in the same way as any enzyme-catalysed reaction.
- From to the rate increases: as temperature rises, enzyme and substrate molecules have more kinetic energy, so they move faster and a higher proportion of collisions have enough energy to be successful, forming more enzyme–substrate complexes per unit time.
- Above the rate falls: the high temperature begins to denature the enzymes, so the shape of the active site changes and the substrate can no longer bind — fewer enzyme–substrate complexes form, and the rate decreases sharply. is therefore the optimum temperature for the enzymes in the germinating peas.
Rate rises from 10 to 30 °C as kinetic energy and successful collisions increase, then falls above 30 °C as enzymes denature; 30 °C is the optimum.
Background Concept
Respiration is a series of enzyme-catalysed reactions (glycolysis, the link reaction, Krebs cycle, oxidative phosphorylation). Like any enzyme-controlled process, its rate is highly sensitive to temperature, and the familiar bell-shaped curve seen in this question is the same pattern observed for almost all enzymes:
- Below the optimum: the rate is limited by kinetic energy. At low temperature, molecules move slowly, collide infrequently, and a small fraction of collisions have the activation energy needed to form an enzyme–substrate complex.
- At the optimum: kinetic energy is high enough for most collisions to be successful, and the enzyme's tertiary structure is still intact.
- Above the optimum: thermal motion begins to break the weak interactions (hydrogen bonds, hydrophobic interactions, ionic bonds) that hold the tertiary structure together. The active site loses its specific shape, the substrate can no longer bind, and the enzyme is denatured. The effect is largely irreversible.
Understanding the Question
The question refers explicitly to Table 6.1 and Fig. 6.2, so the explanation must follow the shape of the plotted data — a rise from to , a peak at (), and a fall to (). Three marks are available, and the mark scheme lists five candidate points: the role of enzymes, the kinetic-energy rise, the collision/complex reason for the rise, denaturation as the cause of the fall, and an optional further detail such as active-site shape change or naming the optimum.
Approach
Use enzyme kinetics to explain the rise, and enzyme denaturation to explain the fall. Anchor the explanation to the specific data values so the answer is clearly tied to Table 6.1.
Step-by-Step Reasoning
- Anchor in the biology: respiration is catalysed by enzymes, so its rate is governed by the same temperature effects that govern any enzyme-catalysed reaction.
- Rising phase (10 → 30 °C): the data increase from to . At higher temperature the enzyme and substrate molecules have more kinetic energy, so:
- they collide more frequently;
- a greater proportion of those collisions have the activation energy needed to form an enzyme–substrate complex.
The net effect is more successful collisions / more enzyme–substrate complexes per unit time, so the rate of respiration rises.
- Falling phase (30 → 50 °C): the data fall from to . Above the optimum, the high temperature disrupts the hydrogen bonds and other weak interactions that maintain the enzyme's tertiary structure. The active site loses its specific shape and can no longer bind the substrate — the enzyme is denatured. With fewer functional active sites, the rate of respiration falls.
- Optimum: the maximum rate at is the optimum temperature for the enzymes in these peas; below it kinetic energy limits the rate, above it denaturation limits the rate.
Key Takeaways
- An enzyme-controlled rate–vs–temperature curve has a single peak at the optimum temperature.
- Below the optimum: more kinetic energy → more successful collisions → more enzyme–substrate complexes → higher rate.
- Above the optimum: enzymes denature, the active site shape changes, and the rate falls sharply.
- Respiration in peas behaves exactly like any other enzyme-controlled process on a temperature curve.
Common Mistakes
- Explaining the rise purely as "molecules move faster" without linking it to successful collisions or to enzyme–substrate complexes — the mark scheme insists on this link.
- Saying the enzymes "die" or "are killed" — the correct term is denature.
- Stating that all enzymes are denatured at (or some other fixed value) — denaturation starts above the optimum and increases with temperature; the degree of denaturation, not its presence, is what changes.
- Failing to identify the optimum temperature explicitly from the data ().
- Giving a general explanation of temperature effects without tying it to the specific shape of the curve in Fig. 6.2.
Things to Be Careful About
- Use the precise terms "kinetic energy", "successful/effective collisions", "enzyme–substrate complex" and "denaturation".
- The optimum temperature is not a property of "all enzymes" — it is the optimum for the enzymes in the peas in this experiment, and it is the temperature at which the rate in Table 6.1 is highest.
- Be careful with the direction of the fall: the rate decreases because the enzyme is denatured, not because of any other limitation such as substrate concentration.
The light-dependent stage of photosynthesis occurs within chloroplasts. In this stage, electrons are emitted from the chlorophyll a molecules and passed to electron acceptors.
If a redox indicator, such as DCPIP, is added to a suspension of illuminated chloroplasts, electrons will be transferred to DCPIP, causing the colour of the DCPIP to change from blue to colourless.
A student investigated the effect of the wavelength of light (colour of light) on the rate of photosynthesis.
• DCPIP was added to three colorimeter tubes, each containing a suspension of chloroplasts. The chloroplast suspensions were kept in the dark until required.
• The colorimeter tubes were each exposed to light of a different colour: red, blue or green. The intensity of light was the same for all tubes, and each was exposed to light for four minutes. All other conditions were kept the same.
• The absorbance of each chloroplast suspension was measured at one-minute intervals using a colorimeter.
The results are shown in Fig. 7.1.
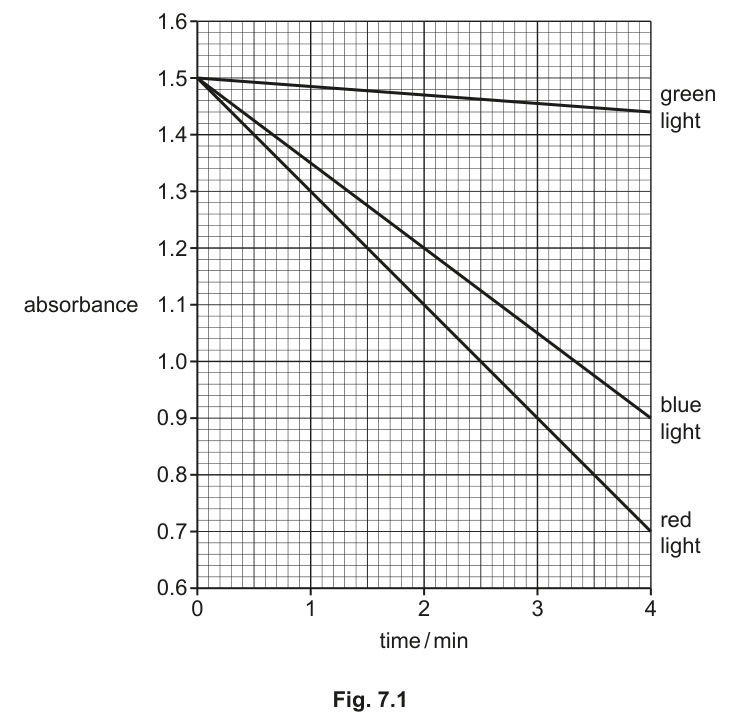
Answer
To ensure that no light was absorbed by chlorophyll before the experiment started, so that photoactivation / the light-dependent stage did not occur and DCPIP was not reduced before the test wavelengths were applied.
To stop the light-dependent stage / photoactivation so no light is absorbed before the experiment.
Background Concept
DCPIP (2,6-dichlorophenolindophenol) is a redox indicator used to measure electron flow from the light-dependent stage of photosynthesis. In its oxidised form it is blue; when it accepts electrons it is reduced and becomes colourless. The rate at which a chloroplast suspension decolourises DCPIP is therefore an indirect measure of the rate at which electrons are being released from chlorophyll a during the light-dependent reactions.
Understanding the Question
The student set up three colorimeter tubes, each containing chloroplasts and DCPIP, and exposed them to red, blue or green light for four minutes. The question asks why the chloroplast suspensions were held in the dark until they were needed. This is a control measure: dark storage prevents any unwanted photosynthesis from happening before the timed exposure begins.
Approach
Think about what would change if the suspensions had been kept in the light before the experiment. The light-dependent stage would already be running, electrons would already be flowing, and DCPIP would already be partly reduced. The starting absorbance of each tube would then not be a true baseline, so any further decrease could not be attributed solely to the test wavelength.
Step-by-Step Reasoning
- Chlorophyll absorbs light energy. If the chloroplasts were left in ordinary room light, photoactivation would already be occurring and the light-dependent stage would already be running.
- Electrons would already be transferred to DCPIP, partially decolourising it before the experiment even starts.
- Storing the suspensions in the dark prevents light from being absorbed and therefore stops photoactivation and the light-dependent stage.
- This guarantees a consistent starting absorbance in every tube, so that any absorbance change observed during the experiment is due only to the wavelength being tested.
Key Takeaways
- A controlled experiment requires every variable except the one being investigated to be held constant or standardised.
- Dark storage of chloroplast suspensions ensures a true baseline for the redox-indicator assay.
Common Mistakes
- Saying "to kill the chloroplasts" — they must remain metabolically active for the experiment to work.
- Saying "to prevent respiration" — this experiment is about photosynthesis, not respiration.
- Not mentioning photoactivation or the light-dependent stage explicitly.
Things to Be Careful About
- One mark only — keep the answer to a single concise sentence.
- Use the term "photoactivation" or "light-dependent stage" rather than the more general "photosynthesis".
Answer
- All three absorbances decrease (with time) over the four minutes.
- All three decrease at a roughly constant rate (the lines are approximately straight).
- Green has the highest absorbance throughout / the smallest decrease; red has the lowest absorbance throughout / the largest decrease; blue is intermediate.
- Data quote: at 4 min, red ≈ 0.70 and green ≈ 1.44, so the fall in absorbance is ~0.80 in red but only ~0.06 in green.
All absorbances decrease (approximately linearly) over time; red falls fastest (to ~0.70 at 4 min) and green falls slowest (to ~1.44 at 4 min).
Background Concept
In the experiment, DCPIP starts oxidised (blue) and becomes colourless as it accepts electrons from the light-dependent stage. The colorimeter measures absorbance: high absorbance = blue solution = much DCPIP still oxidised; low absorbance = colourless solution = DCPIP reduced. A fall in absorbance therefore corresponds to a faster rate of electron transfer from the light-dependent stage.
Understanding the Question
The question asks for a description of the results shown in Fig. 7.1. A "describe" command word requires a clear summary of the trends and key features visible on the graph, supported by data quotes wherever possible. The marks reward identifying the overall trend, ranking the treatments, and supporting claims with specific values read from the graph.
Approach
Read Fig. 7.1 systematically:
- Identify the starting absorbance and the general trend (do all lines go up or down?).
- Note the shape of each line (linear or curved).
- Rank the three colours by their final absorbance / by how steeply they fall.
- Read off specific values at a chosen time (typically 4 min) to use as data quotes.
Step-by-Step Reasoning
- All three lines start at the same absorbance of 1.5 at time 0.
- All three lines show a fall in absorbance over the four-minute period, meaning DCPIP is being reduced in every tube.
- The three lines are roughly straight, so the rate of decrease is approximately constant in each case.
- At 4 minutes the absorbances are: green ≈ 1.44, blue ≈ 0.90, red ≈ 0.70.
- Green has the highest absorbance throughout and the smallest decrease (~0.06).
- Red has the lowest absorbance throughout and the largest decrease (~0.80).
- Blue is intermediate in both absorbance and rate of fall.
Key Takeaways
- Always state both an overall trend and a comparative ranking.
- A data quote with at least two colours converts a vague description into a creditworthy one.
- Use precise language such as "rate of decrease" rather than just "decrease".
Common Mistakes
- Stating only "red decreases the most" without quoting values.
- Saying "red goes down fastest" but quoting a single number rather than a comparison between two colours.
- Confusing absorbance (high = blue DCPIP, low = colourless DCPIP) — high absorbance means less decolourisation, not more.
Things to Be Careful About
- The mark scheme allows three of five possible points; aim to hit the trend, the rate / linear shape, the ranking, and at least one data quote.
- Read the y-axis carefully — the graph begins at 0.6, not 0.
With reference to the light-dependent stage of photosynthesis, explain the differences between the results shown in Fig. 7.1 for red light and for green light.
Answer
With red light:
- More light / energy is absorbed by chlorophyll (chlorophyll absorbs red strongly but absorbs green only poorly).
- More photoactivation occurs, so more electrons are emitted from chlorophyll a.
- More / faster electrons are transferred to DCPIP, so DCPIP is decolourised more rapidly and absorbance falls more steeply.
The reverse applies to green light: less light is absorbed, fewer electrons are emitted and less DCPIP is reduced.
Red light is more strongly absorbed by chlorophyll than green light, so more photoactivation, more electron emission and faster DCPIP decolourisation occur under red light.
Background Concept
The light-dependent stage takes place on the thylakoid membranes. Chlorophyll a molecules at the reaction centres absorb photons of light energy and become photoactivated: an electron is raised to a higher energy level and is then emitted from the chlorophyll molecule. The emitted electron passes along an electron transport chain and reduces NADP+. In this experiment, DCPIP substitutes for NADP+, accepting the electrons and turning from blue to colourless.
Chlorophyll absorbs light most strongly in the red and blue regions of the visible spectrum and absorbs green light very poorly (which is why leaves look green — green wavelengths are reflected or transmitted). The rate of photoactivation, and therefore the rate of electron release, depends on how strongly the available light is absorbed.
Understanding the Question
Fig. 7.1 shows that red light produces the fastest fall in absorbance (DCPIP decolourisation) and green light the slowest. The question asks for an explanation, with reference to the light-dependent stage, of why these two wavelengths give such different results.
Approach
Build a causal chain from light absorption through to DCPIP colour change, applying the chain to red and green light in turn:
- Light absorption by chlorophyll
- Photoactivation → electron emission
- Electron transfer to DCPIP
- Rate of DCPIP decolourisation
Step-by-Step Reasoning
- Chlorophyll a absorbs red light strongly; it absorbs green light only weakly.
- Under red light, more photons are absorbed per unit time, so more chlorophyll a molecules are photoactivated.
- Therefore more electrons are emitted from chlorophyll a into the electron transport chain per unit time.
- More electrons are available to be transferred to DCPIP per unit time.
- Consequently, DCPIP is reduced (decolourised) more rapidly and the absorbance falls more steeply.
- Under green light, less light is absorbed, fewer electrons are emitted, fewer electrons reach DCPIP and the absorbance falls only slightly.
- This explains why red light produces a faster fall in absorbance than green light in Fig. 7.1.
Key Takeaways
- Connecting absorption spectrum → photoactivation → electron emission → DCPIP reduction is a classic photosynthesis skill.
- The action spectrum for photosynthesis closely matches the absorption spectrum of chlorophyll.
Common Mistakes
- Saying "red is better for photosynthesis" without linking to absorption by chlorophyll.
- Failing to mention photoactivation or electrons being emitted.
- Saying that green light cannot be absorbed at all (chlorophyll does absorb a small amount of green; it is just much less than red or blue).
- Talking about chloroplast structure instead of the mechanism of electron emission.
Things to Be Careful About
- The explanation must refer specifically to the light-dependent stage and to DCPIP as the final electron acceptor in this experiment.
- Compare red to green explicitly — the question asks for the difference.
Changes in the atmospheric carbon dioxide concentration, light intensity and temperature can affect the rate of photosynthesis. These three factors directly affect different processes of photosynthesis.
Complete Table 7.1 using a tick (✓) to identify the processes that can be directly affected by each factor or a cross (✗) to identify the processes that are not directly affected by each factor.
Indirect effects where a change in the rate of one process affects the rate of a different process should not be considered.
A tick or a cross must be placed in the final column of every row.
Table 7.1
| factor | process | ✓ or ✗ |
|---|---|---|
| carbon dioxide concentration | Calvin cycle | ______ |
| photophosphorylation | ______ | |
| light intensity | Calvin cycle | ______ |
| photophosphorylation | ______ | |
| temperature | Calvin cycle | ______ |
| photophosphorylation | ______ |
Answer
| factor | process | ✓ or ✗ |
|---|---|---|
| carbon dioxide concentration | Calvin cycle | ✓ |
| carbon dioxide concentration | photophosphorylation | ✗ |
| light intensity | Calvin cycle | ✗ |
| light intensity | photophosphorylation | ✓ |
| temperature | Calvin cycle | ✓ |
| temperature | photophosphorylation | ✓ |
Reasoning:
- CO2 is the substrate for carbon fixation in the Calvin cycle, so it directly affects this stage but not photophosphorylation.
- Light provides the energy for photophosphorylation, so it directly affects this stage. The Calvin cycle does not use light directly — any effect of light on it through reduced ATP/NADPH supply is an indirect effect and is ignored here.
- Temperature affects enzymes (Calvin cycle) and the protein components of the electron transport chain and ATP synthase (photophosphorylation), so it directly affects both stages.
CO2–Calvin: ✓; CO2–photophosphorylation: ✗; light–Calvin: ✗; light–photophosphorylation: ✓; temperature–Calvin: ✓; temperature–photophosphorylation: ✓.
Background Concept
Photosynthesis has two linked stages:
- The light-dependent stage (photophosphorylation) on the thylakoid membranes, in which light energy drives electron transport and ATP synthesis.
- The light-independent stage (Calvin cycle) in the stroma, in which CO2 is fixed by the enzyme rubisco into glycerate 3-phosphate (GP), reduced by ATP and reduced NADP from the light-dependent stage, and used to regenerate ribulose bisphosphate (RuBP).
Three common limiting factors are:
- Carbon dioxide concentration — supplies the substrate for the Calvin cycle.
- Light intensity — supplies the energy for photophosphorylation.
- Temperature — affects the rate of enzyme-catalysed reactions and the behaviour of membrane proteins.
Understanding the Question
The question asks which combinations of these three factors and two stages show a DIRECT effect. Indirect effects — for example, lower light intensity reduces ATP and reduced NADP supply and so eventually slows the Calvin cycle — are explicitly excluded.
Approach
For each (factor, stage) pair ask: "If I change the factor on its own, will the rate of this stage change because of a direct action on that stage?" If yes → ✓; if the stage is only affected because something else is affected first → ✗.
Step-by-Step Reasoning
- CO2 + Calvin cycle: CO2 is the substrate for carbon fixation by rubisco. A change in CO2 directly alters the rate of the Calvin cycle. ✓
- CO2 + photophosphorylation: Photophosphorylation does not use CO2. Changing CO2 has no direct effect on it. ✗
- Light intensity + Calvin cycle: The Calvin cycle does not require light; it requires the ATP and reduced NADP produced by photophosphorylation, but that is an INDIRECT effect and so is excluded. ✗
- Light intensity + photophosphorylation: Light provides the energy that drives electron transport and ATP synthesis. Changing light intensity directly alters the rate of photophosphorylation. ✓
- Temperature + Calvin cycle: The Calvin cycle is catalysed by enzymes (notably rubisco), so its rate is directly affected by temperature. ✓
- Temperature + photophosphorylation: Photophosphorylation involves protein components — the electron carriers in the electron transport chain and ATP synthase — embedded in the thylakoid membrane. Temperature directly affects the activity of these proteins. ✓
Key Takeaways
- CO2 and light intensity each directly affect only one stage of photosynthesis.
- Temperature is unusual in directly affecting BOTH stages.
- "Direct" means acting on the named stage itself, not via an intermediate effect on the other stage.
Common Mistakes
- Ticking the light intensity–Calvin cycle cell (the Calvin cycle does not use light directly).
- Crossing the temperature–photophosphorylation cell (photophosphorylation involves proteins whose activity depends on temperature).
- Treating the ATP/reduced NADP link between the two stages as a "direct" effect of light on the Calvin cycle.
Things to Be Careful About
- The question requires a tick or a cross in EVERY row — leaving a row blank loses marks.
- Read the rubric — INDIRECT effects must NOT be considered.
Approximately people in the world are currently infected with the bacterial disease tuberculosis (TB) caused by Mycobacterium tuberculosis. Early diagnosis is important so that treatment can begin.
APOPO is a non-profit organisation that has trained African giant pouched rats, Cricetomys gambianus, to use their sense of smell to detect M. tuberculosis. They do this by sniffing a sample of thick mucus from the lungs of people who may have TB. The African giant pouched rats are able to detect the presence of M. tuberculosis with an accuracy of 87–93%.
Fig. 8.1 shows an African giant pouched rat.
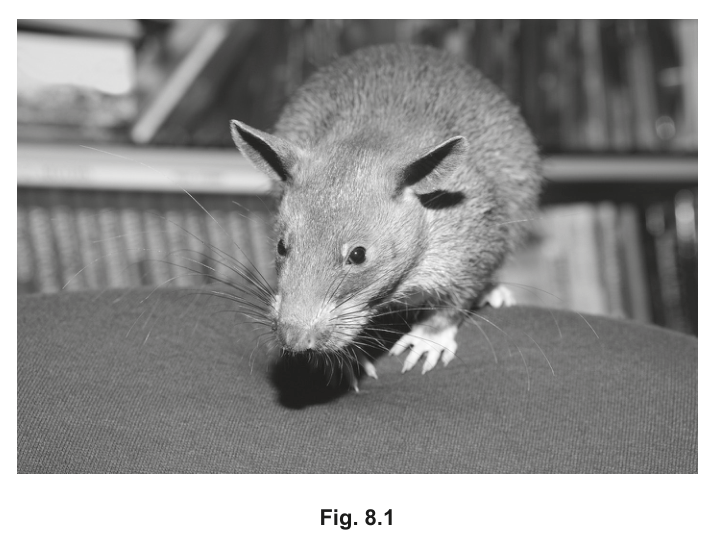
The type of receptor cell used by African giant pouched rats to detect M. tuberculosis is the same as that used in human taste buds.
Name this type of receptor cell.
Answer
Chemoreceptor
Chemoreceptor
Background Concept
Receptor cells in animals are classified by the type of stimulus they detect:
- Chemoreceptors respond to chemical stimuli (taste, smell, blood O₂/CO₂/pH).
- Mechanoreceptors respond to mechanical stimuli (touch, pressure, stretch, sound vibrations).
- Thermoreceptors respond to temperature changes.
- Photoreceptors respond to light.
In human taste buds, the receptor cells on the tongue detect dissolved chemicals (tastants) in food and drink — these are chemoreceptors. The olfactory epithelium in the nose works on the same principle: volatile molecules bind to specific receptor proteins on the cilia of olfactory neurones, generating a nerve impulse that the brain interprets as a smell.
Understanding the Question
The question states that the receptor type the African giant pouched rat uses to detect Mycobacterium tuberculosis is the same as the receptor type in human taste buds. Both the rat (sniffing) and the tongue (tasting) are detecting chemicals, so the shared receptor class is one that responds to chemical stimuli. You need only state the name.
Approach
Match the function described (smelling volatile compounds from bacterial mucus) to the corresponding class of receptor.
Step-by-Step Reasoning
- The rat detects M. tuberculosis in mucus by smell — i.e. it senses chemical substances (volatile organic compounds) given off by the bacteria.
- The question ties this to the same type of receptor found in human taste buds, which also detect chemicals dissolved in saliva.
- A receptor cell that detects chemical stimuli is called a chemoreceptor.
Key Takeaways
- Sensory receptors are named for the stimulus they transduce, not for the organ they sit in.
- Smell and taste are both forms of chemoreception.
- The same receptor class can be deployed in many different organs across animal groups.
Common Mistakes
- Writing "olfactory receptor" or "taste receptor" — these describe the location, not the class of receptor. The question wants the class.
- Writing "smell receptor" — informal and not the technical term examiners credit.
Things to Be Careful About
The command word is "Name" — a single technical term, no explanation, is sufficient for the mark.
Suggest why African giant pouched rats trained to detect M. tuberculosis may also be able to detect other species of Mycobacterium that cause TB.
Answer
- Different Mycobacterium species that cause TB produce the same / similar (volatile) chemicals / proteins.
- The same chemoreceptors in the rat are stimulated, because the molecules have similar shapes that fit the same receptor binding site.
Different Mycobacterium species produce the same/similar chemicals and therefore stimulate the same chemoreceptors in the rat.
Background Concept
A chemoreceptor's specificity comes from the shape of the binding site on its membrane receptor protein. Only molecules whose 3-D shape fits the binding site will trigger an impulse. If two different chemical species have very similar shapes, the same chemoreceptor can respond to both.
Members of the same genus (e.g. several species of Mycobacterium that cause TB in humans or animals) are closely related because they share a recent common ancestor. Closely related organisms share large portions of their genomes, which often means they carry out similar metabolic pathways and produce similar — sometimes identical — secondary metabolites and volatile organic compounds.
Understanding the Question
The rat is trained on samples containing M. tuberculosis and learns to indicate a positive sample. The question asks you to suggest why the same rat could also respond to samples containing a different Mycobacterium species that causes TB. You are not describing a flaw in the training — you are explaining the underlying biology that makes cross-detection possible.
Approach
Link two ideas:
- The chemistry of closely related bacteria is similar.
- The rat's chemoreceptors therefore respond to the same molecular shapes.
Step-by-Step Reasoning
- Several Mycobacterium species cause tuberculosis (e.g. M. tuberculosis, M. bovis, M. africanum). They are closely related — same genus, recent common ancestor, many shared genes.
- Because of this genetic similarity, these species produce very similar (often the same) volatile chemicals / proteins that the rat has been trained to recognise.
- The rat's chemoreceptor binding sites, which detect the molecular shape of M. tuberculosis volatiles, therefore also fit the volatiles of related species.
- The same chemoreceptors are stimulated, so the rat gives the same trained response.
(Mark scheme accepts any two of: similar chemicals produced; closely related species / common ancestor / same genus / shared genes; same chemoreceptors stimulated.)
Key Takeaways
- Chemoreceptor detection is shape-based, so similar molecules → similar responses.
- Taxonomic relatedness predicts biochemical similarity.
- A diagnostic test based on smell can therefore cross-react with related pathogens — a real consideration in TB screening programmes.
Common Mistakes
- Saying the rat "is not specific enough" or "cannot tell the difference" — this implies a fault, not a biological reason.
- Saying the species "are the same" — they are different species in the same genus.
- Talking about the immune system or antibodies — the rat detects by smell, not by immune recognition.
Things to Be Careful About
The question says "may also be able to detect other species of Mycobacterium that cause TB" — keep the answer focused on the Mycobacterium genus, not on unrelated bacteria.
The African giant pouched rat belongs to the kingdom Animalia in the domain Eukarya.
Complete Table 8.1 to show the full classification of the African giant pouched rat.
Table 8.1
| kingdom | Animalia |
| ______ | Chordata |
| class | Mammalia |
| ______ | Rodentia |
| family | Nesomyidae |
| ______ | ______ |
| species | gambianus |
Answer
| Rank | Name |
|---|---|
| kingdom | Animalia |
| phylum | Chordata |
| class | Mammalia |
| order | Rodentia |
| family | Nesomyidae |
| genus | Cricetomys |
| species | gambianus |
The three missing rank labels are phylum, order and genus; the missing taxon is Cricetomys.
Phylum, Order, Genus; genus = Cricetomys
Background Concept
Living organisms are classified into a hierarchy of nested ranks. The principal ranks, from broadest to most specific, are:
Domain → Kingdom → Phylum → Class → Order → Family → Genus → Species
The binomial name of a species has two parts: the genus (capitalised) and the specific epithet (lower-case), both italicised. Together the two words uniquely identify the species within the hierarchy.
Understanding the Question
The table has four ranks already completed (kingdom, class, family, species) and four blanks. The blanks correspond to the ranks phylum, order and genus (×2 — the rank label and the answer). The right-hand column already reveals the answers for phylum (Chordata) and order (Rodentia); the candidate must:
- Name the three missing ranks.
- State the genus of Cricetomys gambianus (the species name in the question stem).
Marking: 4 correct = 2 marks; 1–3 correct = 1 mark.
Approach
- Recall the sequence of ranks so you can name them in the correct order.
- Recognise that the first word of a binomial name is the genus.
Step-by-Step Reasoning
- The rank between kingdom and class is phylum (Animalia → Chordata).
- The rank between class and family is order (Mammalia → Rodentia).
- The rank between family and species is genus.
- The binomial in the question is Cricetomys gambianus. By the convention Genus species, the genus is Cricetomys.
- Writing all four items correctly earns 2 marks; 1–3 correct earns 1 mark.
Key Takeaways
- The Linnaean hierarchy has a fixed order of ranks; memorise it as King Philip Came Over For Good Soup (Kingdom, Phylum, Class, Order, Family, Genus, Species).
- In a binomial, the capitalised first word = genus; the lower-case second word = specific epithet.
Common Mistakes
- Writing "Division" instead of "Phylum" — Division is the botanical equivalent, not used in zoology.
- Writing the genus in lower case or omitting italics on the exam paper.
- Reversing genus and specific epithet (e.g. writing gambianus Cricetomys).
Things to Be Careful About
The genus is the missing entry on the right-hand side of the table; the missing entries on the left are the rank names. Both must be supplied for full marks. The binomial is already italicised in the question stem — keep the convention.
Differences between members of the domain Eukarya and members of the domain Bacteria include the presence or absence of particular membrane-bound cell structures.
Outline other differences in the characteristic features of members of the domain Eukarya and members of the domain Bacteria.
Answer
Any four of the following comparative statements (each point requires BOTH the Eukarya side AND the Bacteria side):
| Feature | Eukarya | Bacteria |
|---|---|---|
| DNA | linear chromosomes | circular DNA / plasmids |
| Histones | present | absent |
| Cell wall | only in some (cellulose or chitin) | in all (peptidoglycan) |
| Cell division | mitosis | binary fission |
| Reproduction | some sexual reproduction | asexual only |
| Ribosomes | 80S (and 70S in organelles) | 70S only |
| Cell size | typically > 5 µm diameter | 1–5 µm diameter |
Four comparative differences (see table).
Background Concept
The three domains of life — Eukarya, Bacteria and Archaea — are distinguished by fundamental differences in cell biology. The question has already told you the headline difference (presence/absence of membrane-bound organelles such as the nucleus). Many other features also separate the two domains:
- DNA organisation: eukaryotes package DNA with histone proteins into linear chromosomes inside a nucleus; bacteria carry a single circular chromosome, often with small circular plasmids, and lack histones.
- Cell wall chemistry: where present, eukaryote cell walls are made of cellulose (plants, algae) or chitin (fungi); bacterial cell walls are made of peptidoglycan (murein).
- Ribosomes: eukaryote cytoplasmic ribosomes are 80S (organelle ribosomes are 70S); bacterial ribosomes are 70S — exploited by antibiotics such as streptomycin.
- Reproduction: eukaryotes divide by mitosis (and many reproduce sexually via meiosis); bacteria divide by binary fission and reproduce asexually.
- Size: typical eukaryotic cells are > 5 µm in diameter; typical bacterial cells are 1–5 µm.
Understanding the Question
The stem already acknowledges that the presence/absence of membrane-bound organelles (e.g. a true nucleus) differs between Eukarya and Bacteria. You are asked for other differences. Each mark requires a paired comparison: stating the Eukarya side AND the Bacteria side of the same feature.
Approach
Choose four reliable comparative features and write them as parallel statements: "Eukarya have X, whereas Bacteria have Y." Do not repeat the membrane-bound organelle difference.
Step-by-Step Reasoning
- DNA structure — eukaryotes have linear DNA associated with histones; bacteria have circular DNA (and often plasmids), no histones. ✓
- Cell wall — only some eukaryotes have walls (cellulose/chitin); all bacteria have walls (peptidoglycan). ✓
- Cell division — eukaryotes use mitosis; bacteria use binary fission. ✓
- Reproduction — many eukaryotes reproduce sexually; bacteria reproduce asexually. ✓
- Ribosomes — eukaryotes have 80S ribosomes (and 70S in organelles); bacteria have 70S only. ✓
- Cell size — eukaryotic cells > 5 µm; bacterial cells 1–5 µm. ✓
Any four of these gives full marks. A common mark-scheme trap is to award the mark only if both sides of the comparison appear, so a one-sided statement (e.g. "eukaryotes have linear DNA") does not earn the mark.
Key Takeaways
- Domains are separated by many features, not just membrane-bound organelles.
- Each mark requires a paired (Eukarya vs Bacteria) statement.
- The size distinction and ribosome size are the most distinctive single features and are worth memorising.
Common Mistakes
- Repeating the membrane-bound organelle difference (already given in the stem).
- Giving only one side of the comparison — e.g. "eukaryotes have histones" without "bacteria lack histones".
- Writing "eukaryotes have a cell wall" — wrong, because only some do.
- Confusing the peptidoglycan/murein cell wall with chitin or cellulose.
Things to Be Careful About
Use precise vocabulary: peptidoglycan (not "sugar"), histones (not "proteins"), binary fission (not "splitting"). Quantities (80S vs 70S) are easy marks — learn them.
Answer
Any two of:
- The type of nucleic acid — viruses contain either DNA or RNA (but not both).
- Whether the nucleic acid is single-stranded or double-stranded.
- (Any other valid point, e.g.) presence or absence of a phospholipid envelope; presence or absence of a tail sheath; type of host cell; type of disease caused.
By nucleic acid type (DNA or RNA) and strandedness (single- or double-stranded).
Background Concept
Viruses are acellular particles: a nucleic-acid genome (DNA or RNA) enclosed in a protein capsid, sometimes wrapped in a host-derived phospholipid envelope. They do not fit into the Linnaean hierarchy because they are not living cells. Instead, virologists classify them by their structural and molecular features.
Key classification features:
- Nucleic acid type: DNA viruses (e.g. adenovirus, herpesvirus) vs RNA viruses (e.g. influenza, coronavirus, HIV).
- Strandedness: single-stranded (ss) or double-stranded (ds).
- Capsid symmetry: helical, icosahedral or complex.
- Envelope: enveloped vs non-enveloped (this affects transmission and resistance to environmental conditions).
- Host type: animal, plant, bacterial (bacteriophage), archaeal.
- Mode of replication and disease caused are also used.
Understanding the Question
The question says "with reference to the structure of viruses" — so you should focus on features visible or molecularly detectable in the virion. Two marks are available; the mark scheme accepts any two structural features.
Approach
Pick the two most reliable structural/molecular features: the type of nucleic acid and whether it is single- or double-stranded. These are unambiguous and easy to remember.
Step-by-Step Reasoning
- The genetic material of a virion is either DNA or RNA — never both. This is the first axis of virus classification.
- The nucleic acid may be single-stranded (e.g. HIV, influenza) or double-stranded (e.g. adenovirus, herpesvirus). This subdivides the groups further.
- Other structural features the mark scheme allows: enveloped vs non-enveloped, with or without a tail sheath (bacteriophages), and the type of host they infect.
Any two of these give the two marks.
Key Takeaways
- Viruses are classified by their features, not by Linnaean ranks.
- The most fundamental feature is the type of nucleic acid in the virion.
- Enveloped vs non-enveloped is a key determinant of how a virus is transmitted and how it is inactivated (enveloped viruses are usually more sensitive to heat, detergents and desiccation).
Common Mistakes
- Saying viruses are classified into "kingdoms" or by their "size alone" — viruses do not have a Linnaean kingdom, and size is too crude a feature on its own.
- Forgetting that a virus contains either DNA or RNA, not both.
- Confusing the capsid (protein coat) with the envelope (host-derived phospholipid bilayer).
Things to Be Careful About
The question asks for classification with reference to structure — so keep your points structural (nucleic acid, strand-ness, envelope, capsid, tail). Avoid drifting into non-structural features (host range, disease) unless you have already given the structural ones.
An investigation was carried out to study the effect of different intensities of blue light on the percentage germination of barley seeds. Barley seeds were exposed to blue light for a period of seven days. All other variables were kept constant.
The results are shown in Table 9.1.
Table 9.1
| light intensity / arbitrary units (au) | percentage germination |
|---|---|
| 0 (dark) | 98.0 |
| 36 | 76.9 |
| 48 | 45.0 |
| 57 | 14.7 |
The effect of blue light on the concentration of abscisic acid (ABA) was also investigated. ABA concentration was measured at intervals over seven days in barley seeds exposed to blue light at an intensity of 57 arbitrary units.
The results are shown in Table 9.2.
Table 9.2
| day | concentration of ABA / arbitrary units (au) |
|---|---|
| 0 | 100 |
| 1 | 90 |
| 3 | 350 |
| 5 | 351 |
| 7 | 381 |
For comparison, in the dark the concentration of ABA in barley seeds fell from at the start (day 0) to on day 1 and did not increase from day 1 to day 7.
ABA is thought to affect gibberellin synthesis or activity.
Using the information in Table 9.1 and Table 9.2, describe the effect of blue light on the germination of barley seeds and suggest an explanation for this effect.
Answer
- (Blue) light decreases the percentage germination of barley seeds.
- As the intensity of (blue) light increases, the percentage germination decreases.
- e.g. 98.0% at 0 au (dark) falls to 14.7% at 57 au.
- (Blue) light increases the concentration of ABA in the seeds.
- ABA inhibits gibberellin synthesis / activity.
- e.g. DELLA proteins are not broken down / ABA promotes dormancy / ABA prevents expression of genes needed for germination.
Blue light decreases germination as intensity rises (98.0% at 0 au to 14.7% at 57 au); blue light increases ABA concentration, which inhibits gibberellin synthesis/activity.
Background Concept
Seeds require specific environmental cues to germinate, including appropriate temperature, water and oxygen. Light is also a powerful environmental signal that influences whether seeds remain dormant or germinate. Many small seeds require light to germinate, but in some species (such as certain cereal grains like barley) light actually inhibits germination — this prevents seeds buried too deeply from germinating before they have access to sufficient light for photosynthesis.
Two key plant hormones interact to control germination:
- Gibberellin: promotes germination by stimulating the synthesis of enzymes (e.g. alpha-amylase) that mobilise stored food reserves in the endosperm. Gibberellin works by causing the breakdown of DELLA repressor proteins, which otherwise inhibit growth-promoting gene expression.
- Abscisic acid (ABA): inhibits germination and maintains seed dormancy, allowing seeds to survive unfavourable conditions.
The balance between these two hormones determines whether a seed germinates.
Understanding the Question
The question presents two pieces of experimental data:
- Table 9.1: percentage germination of barley seeds at four different blue light intensities after 7 days.
- Table 9.2: ABA concentration over 7 days in seeds exposed to 57 au blue light, plus a comparison with seeds kept in the dark.
The question has two parts:
- Describe the effect of blue light on germination (this must use the data).
- Suggest an explanation for this effect (this must use the ABA data and the hint that ABA affects gibberellin).
The command word 'describe' requires data-based statements, while 'suggest an explanation' allows mechanistic reasoning.
Approach
- Identify the trend in Table 9.1: how does germination change with light intensity?
- Quote supporting data points to back up the trend.
- Use Table 9.2 to identify what blue light does to ABA concentration over time.
- Combine this with the hint that ABA affects gibberellin synthesis or activity to construct a mechanistic explanation.
Step-by-Step Reasoning
Describing the effect:
From Table 9.1, as blue light intensity increases from 0 to 57 au, the percentage germination falls from 98.0% to 14.7%. This shows that blue light inhibits germination of barley seeds, and the higher the intensity, the greater the inhibition.
Explaining the effect:
From Table 9.2, in blue light at 57 au, ABA concentration rises from 100 au at day 0 to 381 au by day 7. By contrast, in the dark, ABA falls to 45 au on day 1 and stays low. Therefore blue light causes ABA concentration to increase.
The question states that ABA affects gibberellin synthesis or activity. Since gibberellin is needed to mobilise stored food for germination, increased ABA must be inhibiting this gibberellin action, thereby preventing germination.
Further points that earn credit: ABA could prevent the breakdown of DELLA proteins (which would otherwise allow growth-promoting genes to be expressed), or ABA could promote dormancy directly by inhibiting gene expression needed for germination.
Key Takeaways
- Barley seeds show an inverse relationship between blue light intensity and germination.
- Blue light increases ABA concentration.
- ABA inhibits gibberellin action, preventing the mobilisation of food reserves needed for germination.
- Hormones often work in antagonistic pairs (here ABA versus gibberellin) to fine-tune plant responses to the environment.
Common Mistakes
- Simply stating 'light decreases germination' without quoting data — candidates must support the trend with numbers.
- Describing only the effect without suggesting an explanation.
- Confusing the direction of the effect (some candidates may say blue light increases germination because they expect light to be positive for plants in general).
- Failing to link ABA to gibberellin, missing the mechanism.
- Saying 'ABA decreases germination' without explaining that it does so by inhibiting gibberellin.
Things to Be Careful About
- The data must be quoted correctly: 98.0% at 0 au versus 14.7% at 57 au.
- Use the precise term 'concentration of ABA' rather than vague 'amount of ABA'.
- The question gives a specific hint that ABA affects gibberellin — this MUST be incorporated into the explanation.
- Be precise about the difference between 'synthesis' and 'activity' of gibberellin — either is acceptable.
- ABA's other mechanisms (DELLA breakdown, dormancy, gene expression) are valid additional points to gain extra marks.
After germination, auxin is important in the growth of barley plants.
Describe and explain the role of auxin in cell elongation.
Answer
- Auxin binds to a receptor on the cell surface membrane.
- Auxin stimulates proton pumps.
- Protons (H+) move from the cytoplasm into the cell wall.
- The pH of the cell wall decreases.
- Expansins are activated.
- This loosens the linkage between cellulose microfibrils.
- By breaking hydrogen bonds.
- K+ channels open.
- K+ ions diffuse into the cytoplasm.
- The water potential of the cytoplasm decreases.
- Water enters the cell by osmosis.
- Turgor pressure increases / the volume of the cell increases, so the cell elongates.
Auxin binds to receptors, stimulating proton pumps that lower cell wall pH and activate expansins which break hydrogen bonds between cellulose microfibrils; K+ ions enter the cytoplasm, water follows by osmosis, turgor pressure rises and the cell elongates.
Background Concept
Auxin (indole-3-acetic acid, IAA) is a plant growth hormone produced mainly at the shoot apex and transported downwards. It promotes cell elongation in young shoots and is involved in phototropism, gravitropism and apical dominance.
The acid growth hypothesis explains how auxin causes cell elongation. The mechanism has two coupled phases:
- Wall-loosening phase: auxin triggers the secretion of H+ ions into the cell wall, lowering its pH. The acidic environment activates expansin proteins, which break hydrogen bonds holding cellulose microfibrils together, making the wall more extensible.
- Osmotic water-uptake phase: as the wall loosens, the cell is poised to take up water. Auxin also causes K+ channels to open, allowing K+ to enter the cell. This lowers the water potential (Psi) of the cytoplasm, so water enters by osmosis, increasing turgor pressure and stretching the loosened wall — the cell elongates.
For elongation to continue, the cell must also deposit new cell wall material (cellulose, hemicellulose) to maintain wall thickness.
Understanding the Question
This question asks for both description (what happens) and explanation (why/how it happens) of auxin's role in cell elongation. The mark scheme rewards a step-by-step account of the acid growth mechanism. Candidates must give at least 7 distinct points covering binding, proton pumping, wall acidification, expansin activation, microfibril loosening, K+ uptake, and water entry.
Approach
Work through the mechanism in logical sequence:
- How auxin enters signalling — receptor binding.
- The wall-loosening pathway — proton pumps to H+ secretion to expansins to cellulose microfibrils.
- The osmotic pathway — K+ channels to K+ uptake to lower water potential to osmotic water entry to turgor-driven expansion.
Each step has a clear cause-and-effect relationship that must be explicit. The two phases are interdependent: wall loosening permits expansion, and osmotic uptake drives expansion.
Step-by-Step Reasoning
-
Auxin binds to a receptor on the cell surface membrane. The receptor detects auxin and initiates intracellular signalling.
-
Auxin stimulates proton pumps. The proton pumps are membrane proteins (H+-ATPases) that actively transport H+ using ATP.
-
Protons move from the cytoplasm into the cell wall. This is active transport against the electrochemical gradient; the proton pumps use ATP.
-
The pH of the cell wall decreases. The wall becomes acidic (pH around 4.5–5).
-
Expansins are activated. These proteins are inactive at neutral pH but become active in acidic conditions.
-
Expansins loosen the linkage between cellulose microfibrils. They disrupt the non-covalent bonding in the cell wall matrix.
-
By breaking hydrogen bonds. This is the precise mechanism — expansins do not break covalent bonds; they disrupt hydrogen bonds between cellulose and hemicellulose (xyloglucan). Note the mark scheme explicitly says 'Ignore weakening bonds' — candidates must specify HOW the wall loosens.
-
K+ channels open. Auxin signalling also activates potassium channels in the plasma membrane.
-
K+ ions diffuse into the cytoplasm. They move down their electrochemical gradient.
-
The water potential of the cytoplasm decreases. The accumulation of K+ (a solute) lowers Psi, making the cytoplasm more negative.
-
Water enters the cell by osmosis. Water moves from the higher water potential outside to the lower water potential inside.
-
Turgor pressure increases / the cell volume increases. The incoming water pushes against the loosened cell wall, causing the cell to elongate.
Key Takeaways
- The acid growth hypothesis has two coupled phases: wall loosening and osmotic water uptake.
- Auxin acts through receptor-mediated signalling at the plasma membrane.
- H+ secretion activates expansins, which specifically break hydrogen bonds (not covalent bonds).
- Solute accumulation (K+) lowers water potential, driving osmotic water entry.
- Turgor pressure against a loosened wall causes cell elongation.
- The mechanism is ATP-dependent at the proton-pump step.
Common Mistakes
- Saying 'expansins break bonds' without specifying hydrogen bonds — the mark scheme requires 'hydrogen bonds'.
- Saying auxin 'weakens' the wall without explaining the mechanism.
- Confusing the direction of proton movement (some candidates say H+ enters the cell instead of leaving it).
- Skipping the K+ / osmotic phase entirely.
- Forgetting to mention the role of turgor pressure in cell elongation.
- Stating that auxin directly causes water uptake (it does so indirectly via K+ accumulation and wall loosening).
- Saying the cell wall becomes 'stronger' instead of 'loosened'.
Things to Be Careful About
- Use precise terminology: 'proton pumps', not 'pumps' alone; 'cellulose microfibrils', not 'cell wall'; 'water potential', not 'water concentration'.
- The two phases are sequential and interdependent — wall loosening makes elongation possible, and osmotic uptake drives expansion.
- Turgor pressure increases because water enters, not because of any active pumping of water.
- The mechanism applies to young, growing cells — mature cells with rigid walls do not elongate this way.
- The mark scheme explicitly says 'Ignore weakening bonds'; simply saying 'weakens the wall' is insufficient, they must specify HOW (hydrogen bonds).
Striated muscle is composed of myofibrils. Myofibrils contain several structural proteins including troponin, tropomyosin, actin and myosin.
Outline the roles of these four structural proteins in the contraction of a sarcomere.
Answer
- Troponin binds and changes shape, causing tropomyosin to move away from the myosin-binding sites on actin.
- Myosin heads bind to the exposed binding sites on actin, forming cross-bridges.
- The myosin head pivots, performing a power stroke that pulls the actin filament towards the centre of the sarcomere, so the Z lines move closer together.
- The myosin head has ATPase activity and binds a new ATP molecule, which allows detachment from actin so the cycle can repeat.
See answer.
Background Concept
A sarcomere is the contractile unit of a myofibril, bounded by two Z lines, with thin (actin) filaments anchored at the Z lines and thick (myosin) filaments lying between them. Contraction occurs when the thin filaments slide over the thick filaments, shortening the sarcomere — the sliding filament model. The four proteins in the question play distinct, tightly coupled roles.
In a relaxed muscle, the myosin-binding sites on actin are physically blocked by the long, rod-shaped tropomyosin molecule lying along the actin groove. Troponin is a small globular complex attached to tropomyosin at regular intervals; it is the calcium sensor of the system. When the sarcoplasmic reticulum releases into the sarcoplasm, binds to troponin, troponin undergoes a conformational change, and this drag-moves tropomyosin away from the myosin-binding sites on actin.
Myosin is a motor protein. Each myosin head carries an actin-binding site and an ATPase site. Once the binding sites on actin are exposed, a myosin head (already energised by hydrolysing ATP to ADP + ) binds actin — this is the cross-bridge. The head then pivots (the power stroke), pulling the actin filament towards the M line, which shortens the sarcomere. After the power stroke, a new ATP molecule binds to the myosin head; this reduces the head's affinity for actin, so it detaches. ATP is then hydrolysed again, re-cocking the head. The cycle repeats as long as and ATP are available.
Understanding the Question
Part (a) asks for an outline — a brief, ordered account, not an essay — of what each of the four named proteins does during contraction of a single sarcomere. Four marks are available, so four distinct points are needed. The mark scheme offers five possible points, so the candidate can omit one. Each protein must contribute something to the answer, and the role of each should be tied to contraction, not to muscle structure in general.
Approach
The trick with this kind of question is to keep the proteins in the order in which they act during the contraction cycle: -binding trigger (troponin) → exposure of binding sites (tropomyosin / actin) → cross-bridge formation and power stroke (myosin) → detachment using ATP (myosin). Linking each step to the next makes the answer read as a single coherent mechanism rather than four disjoint facts, which is what examiners reward.
Step-by-Step Reasoning
Mark point 1 — troponin and
When the motor neurone fires, an action potential sweeps down the T-tubules and triggers release from the sarcoplasmic reticulum. This binds to troponin, causing it to change shape. This single event is the on-switch of contraction.
Mark point 2 — tropomyosin moves
Because troponin is physically attached to tropomyosin, the shape change drags tropomyosin away from the myosin-binding sites on the actin filament, exposing them.
Mark point 3 — myosin binds actin (cross-bridge formation)
Energised myosin heads (ADP + still bound after the previous ATP hydrolysis) now bind to the newly exposed sites on actin.
Mark point 4 — power stroke
The myosin head pivots, releasing ADP and . This pulls the actin filament towards the centre of the sarcomere. The mark scheme accepts either "shortens the sarcomere" or "Z lines move closer together / towards the M line" as evidence that the candidate understands the geometry. The latter is a more precise way of saying the same thing and is what CIE mark schemes tend to prefer.
Mark point 5 — detachment using ATP
A fresh ATP molecule binds to the myosin head. Binding ATP (not yet its hydrolysis) reduces the myosin's affinity for actin, so the head detaches. The myosin head's intrinsic ATPase activity then hydrolyses the ATP, re-cocking the head for the next cycle. Note that the mark scheme's wording is "myosin head is ATPase / binds to ATP, to allow detachment" — both halves of this point are needed: ATP binding causes detachment, and the myosin head has ATPase activity to re-energise it.
Key Takeaways
- The four proteins act in a fixed sequence: troponin (Ca²⁺ sensor) → tropomyosin (gatekeeper on actin) → actin (filament that gets pulled) → myosin (motor that pulls and detaches via ATP).
- The sarcomere shortens because actin filaments slide over myosin filaments; the filaments themselves do not contract.
- ATP has two distinct roles: it is hydrolysed to energise the power stroke, and its binding (before hydrolysis) is what releases the myosin head from actin. A cadaver becomes rigid (rigor mortis) precisely because no fresh ATP is made to allow detachment.
Common Mistakes
- Saying "calcium binds to tropomyosin" — it binds to troponin.
- Describing the power stroke as "myosin shortening" or "myosin contracting" — myosin does not get shorter; it pivots, and it is the actin filament that moves.
- Omitting ATP and the detachment step — without it the cycle is not a cycle and the muscle could not relax or contract again.
- Saying "myosin uses energy from ATP to contract" — vague; the mark scheme wants "myosin head is an ATPase / binds ATP to allow detachment".
Things to Be Careful About
- The mark scheme uses "actin" and "myosin" as bold key terms — answers that omit these in favour of vague phrases like "the filaments" can lose marks.
- Either wording for the power stroke is accepted ("shorten sarcomere" or "Z lines move closer together / towards M line"); the second is more rigorous and is the wording the examiner is hoping for.
- "Troponin changes shape" is the precise phrase — do not say "troponin activates" or "troponin moves"; troponin is the trigger, tropomyosin is the part that physically moves.
Drugs that cause muscle paralysis (paralytic drugs) are used during surgery to stop the patient moving. One commonly used paralytic drug is succinylcholine, which works by preventing contraction of muscles. Succinylcholine is able to prevent muscles contracting because it has a similar shape to acetylcholine.
Suggest how succinylcholine is able to prevent muscles contracting.
Answer
- Succinylcholine has a complementary shape to acetylcholine, so it binds to the acetylcholine receptors on the sarcolemma (post-synaptic membrane) at the neuromuscular junction, acting as a competitive inhibitor.
- Binding of succinylcholine does not open the ligand-gated sodium ion channel proteins in the receptors, so sodium ions do not flow into the muscle cell / sarcoplasm.
- The sarcolemma is not depolarised, so an action potential is not generated in the muscle fibre and contraction cannot occur.
See answer.
Background Concept
The neuromuscular junction (NMJ) is the synapse between a somatic motor neurone and a striated muscle fibre. When an action potential arrives at the motor neurone's axon terminal, voltage-gated calcium channels open, enters the terminal, and acetylcholine (ACh) is released into the synaptic cleft by exocytosis. ACh diffuses across the cleft and binds to nicotinic ACh receptors on the sarcolemma (the post-synaptic membrane).
Nicotinic ACh receptors are ligand-gated cation channels. Each receptor has two ACh-binding sites; when ACh occupies both, the channel opens and allows (and some ) to flow down their electrochemical gradients. The net influx of depolarises the sarcolemma. If this depolarisation reaches threshold, voltage-gated sodium channels along the sarcolemma and T-tubules open, generating an action potential that sweeps into the fibre, releases from the sarcoplasmic reticulum, and triggers contraction via the sliding filament mechanism.
A competitive inhibitor is a molecule with a shape similar enough to the natural ligand that it can occupy the same binding site, but which does not itself activate the receptor. Because the inhibitor and the natural ligand compete for the same site, a high enough concentration of inhibitor can prevent the natural ligand from binding and producing its effect.
Understanding the Question
The stem tells us two crucial things: succinylcholine prevents muscle contraction, and it has a shape similar to acetylcholine. The question asks the candidate to suggest the mechanism — that is, to apply the principle of competitive inhibition at the NMJ, using the shape similarity as the starting clue, and to follow the consequence through the synaptic transmission sequence. Three marks are available, so the answer must go beyond "it binds the receptor" and trace the effect on ion flow and membrane potential.
Approach
Start from the molecular interaction (receptor binding), then step through the downstream consequences that the mark scheme is looking for: failure of the channel to open → no entry → no depolarisation. A common trap is to stop at "it binds the receptor"; the mark scheme rewards only the consequence.
Step-by-Step Reasoning
Mark point 1 — binding to ACh receptors / competitive inhibitor
Because succinylcholine has a similar shape to ACh, it fits into the ACh-binding sites on the nicotinic receptors on the sarcolemma. The mark scheme phrasing is either "binds to ACh receptors" or "acts as a competitive inhibitor"; either is accepted, but writing both makes the answer stronger. The mark scheme explicitly rejects "binds to the active site of the receptor" — receptors do not have "active sites" in the enzyme sense; they have binding sites. Using the enzyme language here is a mark-losing error.
Mark point 2 — sodium channels do not open
Although succinylcholine occupies the receptor, it does not activate it. The ligand-gated sodium channel associated with the receptor remains closed. The mark scheme specifically rejects "voltage-gated channels do not open" — the channels at the NMJ are ligand-gated (opened by ACh binding), not voltage-gated. Voltage-gated channels are the ones along the rest of the sarcolemma and T-tubule, and they would only matter at a later step.
Mark point 3 — no entry / no depolarisation
With the channels closed, cannot flow into the muscle cell down its electrochemical gradient, so the sarcolemma is not depolarised. No end-plate potential is generated, threshold is not reached, no muscle action potential fires, and so the excitation–contraction coupling cascade is never initiated — the muscle cannot contract. The mark scheme accepts either "sodium ions do not enter" or "sarcolemma is not depolarised" as the third point, but writing both is safest.
Key Takeaways
- ACh is the natural agonist at nicotinic receptors; succinylcholine, with a similar shape, is a competitive antagonist at those receptors.
- "Similar shape" is the key clue to a competitive-inhibition mechanism anywhere in biology (receptors, enzymes, transporters).
- At a synapse, blocking the receptor has the same downstream effect as blocking the channel or removing the neurotransmitter: no depolarisation, no action potential, no response.
- The distinction between ligand-gated and voltage-gated channels is important: ACh receptors are ligand-gated, sarcolemmal Na⁺ channels are voltage-gated.
Common Mistakes
- Saying succinylcholine "binds to the active site" of the receptor — receptors have binding sites, not active sites (this wording is explicitly rejected by the mark scheme).
- Saying the drug "blocks voltage-gated sodium channels" — these are not the channels at the NMJ; the relevant ones are ligand-gated.
- Stopping at "it binds the receptor" without going on to say what that prevents.
- Confusing depolarisation with hyperpolarisation, or saying the membrane "becomes more positive outside" — the change to be stated is simply "not depolarised".
Things to Be Careful About
- The wording "R if voltage gated" in the mark scheme is a hard reject: writing "voltage-gated sodium channels do not open" will not earn the second mark. Use the correct channel type.
- "R if binds to active site of receptor" is also a hard reject; the receptor's correct feature is a binding site.
- The candidate should connect the answer to the muscle's response (or lack of one) — the ultimate consequence is no contraction because the action potential is not generated.
Duchenne muscular dystrophy (DMD) is a genetic disease that is caused by a single gene. DMD affects striated muscle, and symptoms of the disease first appear at an early age.
A fibrous protein, dystrophin, stabilises muscle fibres during contraction. A person with DMD produces non-functioning dystrophin or no dystrophin at all. The disease occurs in about four in people and mainly affects boys.
Suggest and explain why boys are more likely to have DMD than girls.
Answer
- The gene for dystrophin is located on the X chromosome (it is sex-linked).
- The allele causing DMD is recessive.
- Males (XY) have only one X chromosome, so they have only one copy of the gene; if that single allele is the recessive DMD allele, they have no second copy to mask it and so they will have DMD.
- A female (XX) would need two copies of the recessive allele to express DMD; a female with one DMD allele and one normal allele is a heterozygous carrier and does not have the disease.
See answer.
Background Concept
Human sex is determined by the sex chromosomes: females are XX and males are XY. The Y chromosome is much smaller than the X and carries only a few genes, so most of the genes on the X chromosome have no corresponding allele on the Y. A gene carried only on the X chromosome is described as sex-linked (more precisely, X-linked).
A male has only one X chromosome, so for any X-linked gene he has only one allele — he is hemizygous, not homozygous or heterozygous. This means that in a male, whichever allele is on his single X chromosome is the one whose phenotype is expressed; there is no second allele to be dominant or recessive against. A recessive allele on the male's X chromosome will therefore always show its effect in a male. A female has two X chromosomes, so she can be either homozygous (both alleles the same) or heterozygous (one of each), and the usual dominance relationships apply — a recessive allele can be masked by a dominant one.
Duchenne muscular dystrophy (DMD) is a classic example of an X-linked recessive disease. It is caused by mutations in the DMD gene on the X chromosome, which codes for the protein dystrophin. Dystrophin links the cytoskeleton of the muscle fibre to the surrounding extracellular matrix, stabilising the sarcolemma during contraction. Without functional dystrophin, muscle fibres are damaged during contraction and gradually replaced by fatty and fibrous tissue, producing progressive weakness.
Understanding the Question
The stem gives several pieces of information: DMD is caused by a single gene, it affects striated muscle, it appears early, the protein dystrophin is affected, the disease is common (about 4 per 100,000), and it mainly affects boys. The command word is "suggest and explain", which means the answer must both name the genetic explanation and connect it to the observation that boys are predominantly affected. Three marks are available, so three connected points are needed.
Approach
The logic chain is: (1) locate the gene on the X chromosome; (2) note that the DMD allele is recessive; (3) reason that males, having only one X, will show the disease with just one copy, whereas females need two. Each step is a marking point. Writing them in this order makes the explanation read as a single argument, which is the most efficient way to access all three marks.
Step-by-Step Reasoning
Mark point 1 — sex-linked / gene on the X chromosome
The first step is to state explicitly that the gene is located on the X chromosome. This is the foundational claim on which the rest of the explanation rests. Without it, the rest of the argument does not follow.
Mark point 2 — the allele is recessive
The DMD allele behaves as recessive to the normal allele. This is needed because if the DMD allele were dominant, a heterozygous female would also show the disease, and there would be no sex bias of the kind observed.
Mark point 3 — males have only one X (one copy) / females can be carriers
Because males are XY, they have only one X chromosome and therefore only one copy of the dystrophin gene. If that single allele is the recessive DMD allele, there is no normal allele on a second X chromosome to mask it, and the male has the disease. A female (XX) who inherits one DMD allele has a second, normal allele on her other X chromosome; because DMD is recessive, she does not have the disease herself but is a carrier who can pass the allele to her sons. A female would have to be homozygous (two DMD alleles) to have the disease, which is much rarer because it requires the allele to be inherited from both parents.
The mark scheme accepts either of two wordings for this third point: "female heterozygotes do not have DMD / are carriers" or "only homozygous females have DMD". Both correctly capture the recessivity, but the carrier point is the more biologically interesting one and the one that connects to the inheritance pattern across generations.
Key Takeaways
- A sex-linked recessive disease affects many more males than females because males need only one copy of the allele to express the phenotype.
- Heterozygous females are phenotypically normal carriers — they do not have the disease but can pass the allele on.
- For a rare X-linked recessive allele, the typical affected genotypes are (affected male) and (carrier female); an affected female requires an affected father and a carrier or affected mother and is therefore very rare.
- The DMD gene is one of the largest human genes, which is why new mutations arise relatively often — but most DMD cases are still inherited from carrier mothers.
Common Mistakes
- Saying "DMD is on the Y chromosome" — it is on the X, and that is precisely why it shows a sex bias.
- Saying "males are more likely because the gene is dominant" — dominance makes no difference to the sex bias; recessivity combined with hemizygosity is what produces the bias.
- Saying "girls have two X chromosomes so they are immune to DMD" — they are not immune; they can have it if homozygous. The correct framing is that they are usually carriers and unaffected.
- Confusing sex-linked with autosomal and talking about sex-limited or sex-influenced inheritance — these are different phenomena and not what is being tested here.
Things to Be Careful About
- The phrase "males only have one copy of the gene / allele / X chromosome" is the precise wording the mark scheme is looking for; "males have fewer chromosomes than females" is not the same claim and does not earn the mark.
- "Carrier" must be tied to a heterozygote — a candidate who writes "females can carry the disease" without specifying the heterozygous genotype has missed the genetic precision.
- The mark scheme is generous about how the third point is expressed, but the strongest answers combine both the male-hemizygote point and the female-carrier point in a single sentence.