Biology 9700/53 — October/November 2023
Cambridge A-Level · Planning, Analysis and Evaluation · worked solutions for every part, with the mark scheme
Topics Planning · Analysis, Conclusions and Evaluation
Fruits in the diet can be a source of vitamins, such as vitamin C and vitamin A, which are important in maintaining good health.
Vitamin A is a group of molecules that includes retinol and retinal.
Vitamin C is an organic acid known as ascorbic acid.
Ripening occurs in fruit when molecular changes cause an increase in sugar content, colour changes and softening of the fruit, over time.
Ascorbic acid is found in plant cells. The fruits of many plants have high concentrations of ascorbic acid.
A student planned to investigate how ascorbic acid concentration changes with ripeness in the fruit of the apple tree, Malus domestica.
The fruit of M. domestica (apples) are shown in Fig. 1.1.
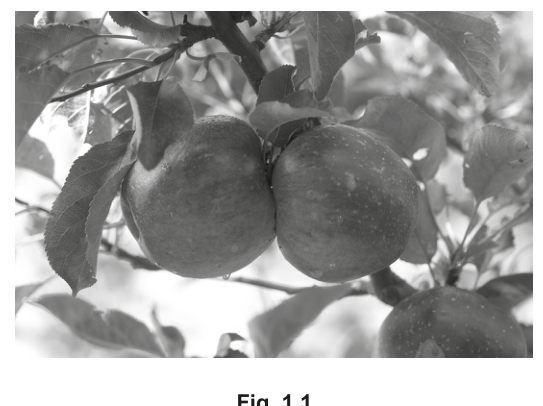
Fig. 1.1
The student removed an apple that was in diameter from a tree. The student measured the sugar content of the apple, which was low. This indicated that the apple was at the early stages of ripening (unripe).
For the investigation, the student decided to select apples from trees when each apple was in diameter.
The student assumed that the ripeness of each apple would increase each day after it had been picked from a tree.
Suggest why the diameter of the apples selected may not give accurate estimates of ripeness.
Describe an improvement to the method for selecting the apples that would give more accurate estimates of ripeness.
The student researched how ascorbic acid concentration changes with ripeness in the fruit of other species.
Based on this research, the student predicted that ascorbic acid concentration in apples will:
- be lowest in unripe apples when they are first picked from the tree
- increase over several days and peak in partially ripe apples
- decrease slightly in later days as the apples become fully ripe.
Sketch a line graph below, including labelled axes, to show the predicted results.
The student used the redox indicator DCPIP to investigate how ascorbic acid concentration changes as the apples ripen.
The student tested the ascorbic acid concentration of the apples at intervals from the time they were taken from the tree until the apples were fully ripe.
For each test, the student prepared an apple extract solution and reacted this with a DCPIP solution of standardised concentration.
The student was provided with a stock solution of DCPIP.
After preliminary research, the student decided to dilute the stock solution to prepare a DCPIP solution to use in the experiment.
The student used two steps to dilute the stock solution to the DCPIP solution.
Complete the description of the two steps for the dilution by adding the correct values to the sentences.
step 1
The student mixed of DCPIP stock solution with ______ of distilled water to produce solution A. Solution A had a concentration of .
step 2
The student then mixed ______ of solution A with of distilled water to produce the DCPIP solution.
DCPIP changes colour from blue to colourless when it is reduced by ascorbic acid.
- The volume of DCPIP that can be reduced by ascorbic acid is a measure of the concentration of ascorbic acid present in a solution.
- When all the ascorbic acid present in a solution has reacted with DCPIP, any more DCPIP that is added will remain blue.
The student had access to standard laboratory equipment and a burette.
DCPIP solution can be added to a burette and released one drop at a time by turning a tap.
Fig. 1.2 shows a burette set up for this investigation.
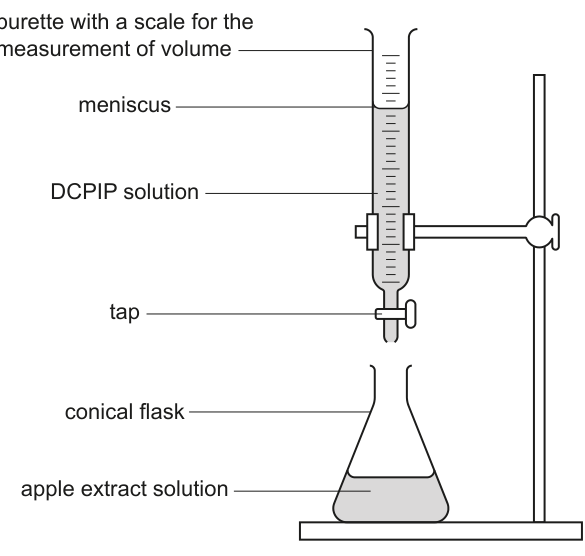
Fig. 1.2
Describe a method the student could use to:
- prepare apple extract solutions from the fruit
- collect the results needed to show the changes in ascorbic acid concentrations as the apples ripen, using DCPIP.
The description of your method should be set out in a logical way and be detailed enough for another person to follow.
You should not repeat the details from (c)(i) describing how to dilute the stock solution of DCPIP.
After recording the results, the student decided that Pearson’s linear correlation was a more appropriate test to use than Spearman’s rank correlation to test whether ripeness and ascorbic acid concentration were correlated.
Suggest two reasons why Pearson’s linear correlation was the more appropriate statistical test.
Many fruits are a good source of -carotene, which can be converted in the human body to vitamin A.
The student investigated the -carotene content of apples.
The student measured the -carotene concentration in ripe apples and the ripe fruit of four other species.
Fig. 1.3 shows the results.
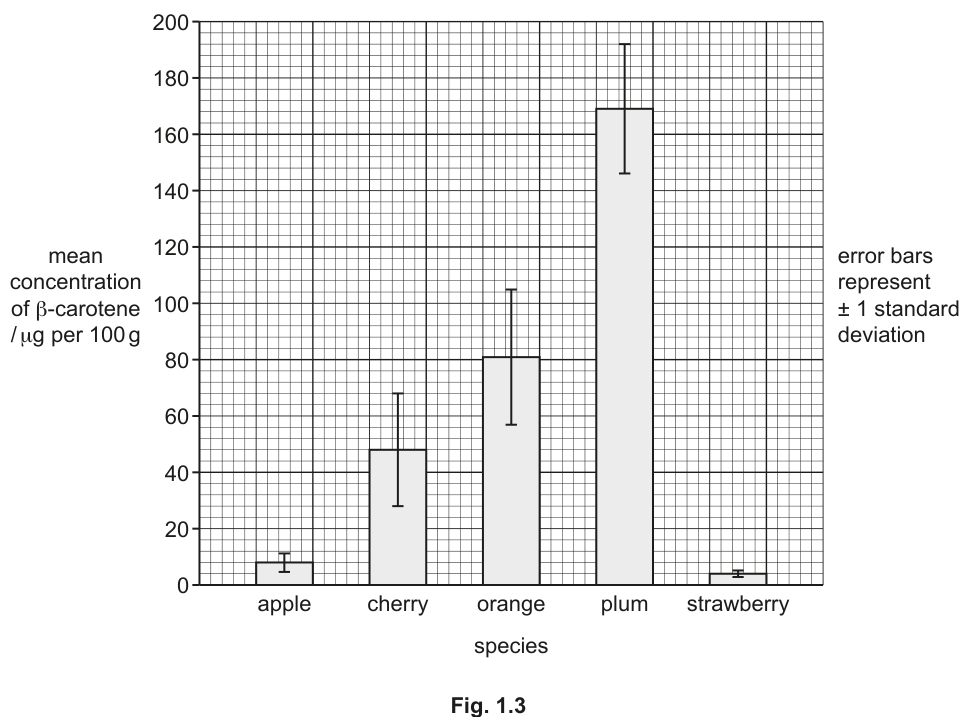
Fig. 1.3
The student concluded that apples are not a good dietary source of vitamin A.
Use the data in Fig. 1.3 to evaluate this conclusion.
The rest of this paper
1 more questions- Q2Planning · Analysis, Conclusions and Evaluation10M