Biology 9700/52 — October/November 2023
Cambridge A-Level · Planning, Analysis and Evaluation · worked solutions for every part, with the mark scheme
Topics Planning · Analysis, Conclusions and Evaluation
Rocky shore ecosystems are found in some coastal regions. These ecosystems are inhabited by many different species of algae and animals. Twice each day the sea level rises to the high tide level and decreases to the low tide level in a regular pattern. The organisms in these ecosystems are exposed to very different conditions during the course of each day.
Algae are photosynthetic protoctists. Multicellular algae are found in many marine ecosystems.
Rock pools are formed in depressions in the shore as the water level lowers when the tide goes out.
Fig. 1.1 is a profile of a rocky shore ecosystem showing the positions of some rock pools. The mid-shore zone lies between the lower-shore zone and the upper-shore zone.
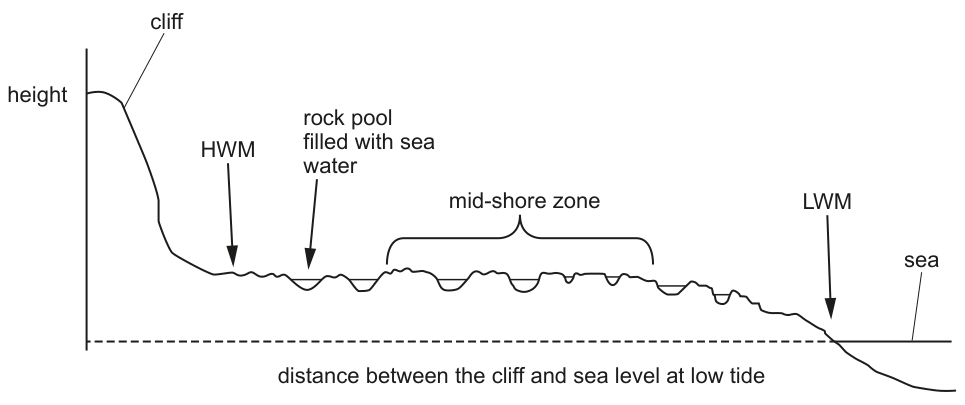
HWM = high-water mark – the highest point on the shore that is covered by sea water at high tide
LWM = low-water mark – the lowest point on the shore that is exposed to the air at low tide
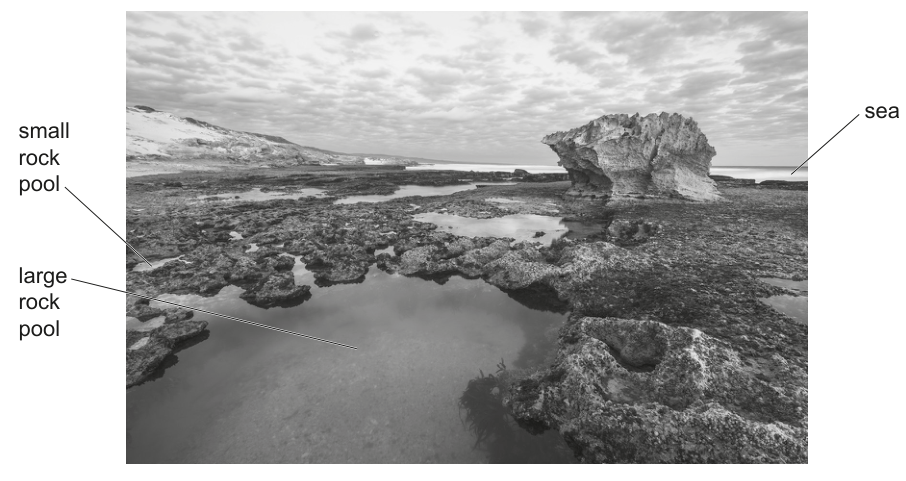
Fig. 1.2 shows a large rock pool on the mid-shore zone surrounded by smaller rock pools at low tide.
A student investigated the distribution and abundance of large, multicellular algae on a rocky shore in North Wales in the UK at low tide on one day in October 2011.
The student completed a preliminary survey of the shore at low tide and made some observations.
- There were several different species of algae growing in the mid-shore zone.
- Some algae were exposed to the air at low tide, but most grew in rock pools.
- The distribution and abundance of the algae differed on the shore between the low-water mark (LWM) and the high-water mark (HWM).
- Large rock pools appeared to have more species of algae than small rock pools.
- Large rock pools were deeper than small rock pools.
The student decided to investigate the relationship between the depth of rock pools and the species diversity of the algae in the rock pools in the mid-shore zone.
The student selected 32 rock pools at random. Approximately half the rock pools were small and half were large. The depth of each rock pool at its deepest point was measured and the number of different species of algae in each rock pool was counted.
State two variables that have been standardised in the investigation.
Answer
Any two from:
- Low tide (the investigation was conducted at low tide).
- Day / date / month / season (one day in October 2011).
- The same rocky shore / same location (in North Wales, UK).
- The mid-shore zone (only pools in this zone were sampled).
- Random selection of rock pools.
- Depth measured at the deepest point of each rock pool.
Two standardised variables identified, e.g. low tide and the same rocky shore.
Background Concept
In any investigation, only one variable should be deliberately changed (the independent variable) and one measured to see its effect (the dependent variable). Every other variable that could affect the result must be kept constant — these are the standardised (or controlled) variables. Without standardisation, observed differences in the dependent variable cannot be confidently attributed to the independent variable. In a field study such as this one, the things the researcher could fix in advance (location, time of day, season, zone of the shore, sampling method) are the controlled variables.
Understanding the Question
The stem describes a student who measured two quantities in 32 randomly chosen rock pools in the mid-shore zone:
- Independent variable: depth of the rock pool (at its deepest point).
- Dependent variable: number of different species of algae in the pool (species diversity).
We are asked for two standardised variables — features that were held the same for every pool sampled.
Approach
Re-read the description of the study and the preliminary observations, and identify each detail that the student fixed (rather than measured or varied). Good candidates are any combination of when, where, which zone, how the pools were chosen and how the depth measurement was standardised.
Step-by-Step Reasoning
- The investigation was carried out "at low tide on one day in October 2011" → time of tide and date/season are fixed across all 32 pools.
- The student worked on "a rocky shore in North Wales in the UK" → a single location was used.
- Pools were selected from the mid-shore zone only → the zone is standardised.
- "The student selected 32 rock pools at random" → the method of selection (random sampling) is held constant.
- "The depth of each rock pool at its deepest point was measured" → where depth was measured is standardised.
Any two of these points earn the marks; the strongest pair covers both a temporal standardisation (low tide / same day / same season) and a spatial standardisation (same shore / same zone), because together they show understanding of why ecological studies need controls.
Key Takeaways
- Standardised variables are those held constant by design, not measured.
- In a field ecology study, time, location, season, zone and sampling protocol are common standardisations.
- When writing experimental design, always state which variables are controlled and how.
Common Mistakes
- Confusing standardised variables with the independent or dependent variable.
- Giving "number of species" or "depth of pool" — these are measured, not standardised.
- Giving "the student used the Spearman's rank test" — this is the analysis, not a control.
Things to Be Careful About
- "Random" refers to how pools were selected — it is a feature of the sampling protocol rather than a property of the pool, but the mark scheme accepts it as a standardised variable.
- Make sure the two answers are genuinely different and not just restatements of the same idea.
The results of the investigation are shown in Fig. 1.3.
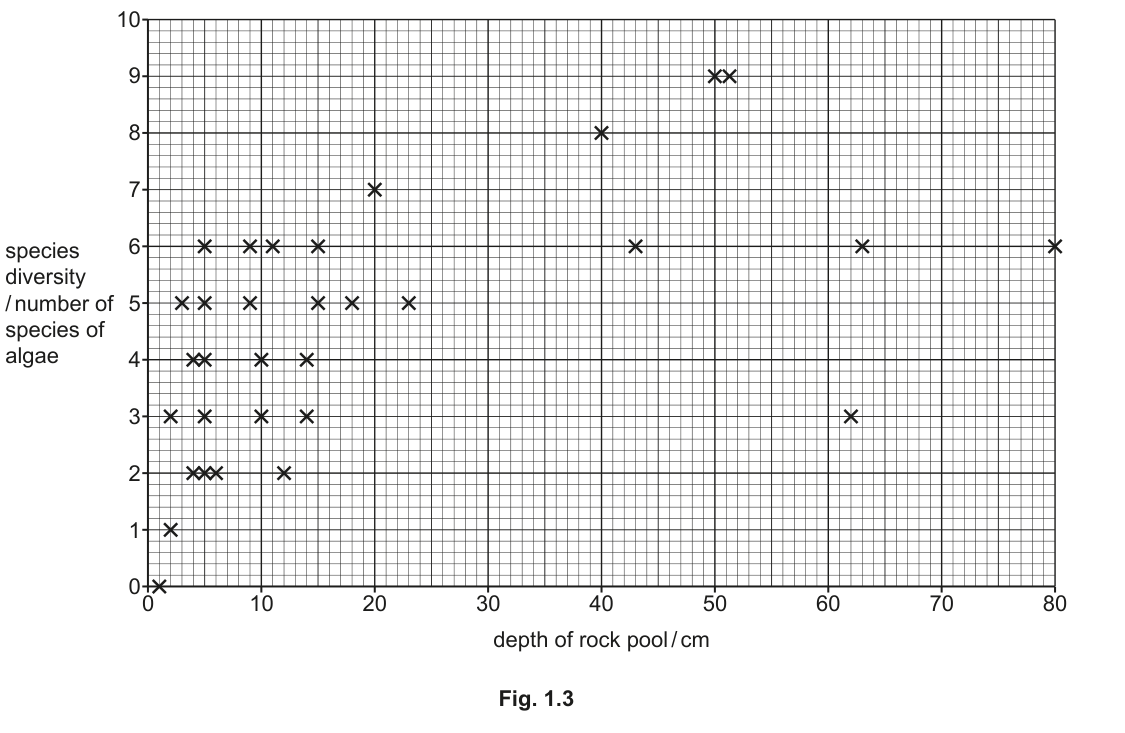
The student used the Spearman’s rank correlation to analyse the data in Fig. 1.3.
State a null hypothesis for this investigation.
Answer
There is no (significant) correlation between the number of (different) species of algae in a rock pool and the depth of the rock pool.
There is no correlation between species diversity and depth of rock pool.
Background Concept
A null hypothesis (H₀) is the statistical assumption that any pattern seen in the sample data has arisen by chance — i.e. there is no real relationship in the population from which the sample was drawn. The statistical test (here, Spearman's rank) calculates the probability of obtaining the observed result if H₀ is true. If that probability is below the chosen significance level (typically ), H₀ is rejected and we say the result is statistically significant.
For a correlation test the null hypothesis always takes the form "there is no correlation between variable X and variable Y".
Understanding the Question
The student is testing whether rock-pool depth and algal species diversity are related. Part (b)(i) asks for the null hypothesis that the Spearman's rank test in (b)(ii) will assess.
Approach
- Identify the two variables: depth of rock pool and number of species of algae.
- Use the standard null form: "There is no correlation between [variable 1] and [variable 2]."
- Avoid directional language ("positive"/"negative") — the null is two-sided.
Step-by-Step Reasoning
- Variable 1 (independent / measured as the x-axis): depth of the rock pool.
- Variable 2 (dependent / measured as the y-axis): number of different species of algae.
- Combine them into a single statement that says these two are not related.
Key Takeaways
- A null hypothesis is always a statement of no effect or no relationship.
- It must reference the two specific variables that were measured.
- The hypothesis is then accepted or rejected against a critical value at a chosen level.
Common Mistakes
- Writing a directional null ("deeper pools do not have more species") — the null must be two-sided.
- Including the word "significant" inside the null hypothesis itself.
- Confusing the null with the alternative ("there is a positive correlation").
Things to Be Careful About
- "Species diversity" and "number of species" are both acceptable ways of naming the y-axis variable; the mark scheme accepts either.
The student calculated the Spearman’s rank correlation coefficient () as 0.628.
Table 1.1 shows some of the critical values for the Spearman’s rank correlation test.
Table 1.1
| number of pairs of measurements | critical values (5%) | critical values (1%) |
|---|---|---|
| 30 | 0.362 | 0.467 |
| 31 | 0.356 | 0.459 |
| 32 | 0.350 | 0.452 |
| 33 | 0.345 | 0.446 |
| 34 | 0.340 | 0.439 |
Discuss, with reference to Table 1.1, the conclusions that can be made from the analysis of the data collected by the student.
Answer
- Critical value at for pairs is .
- The calculated value of is greater than this critical value.
- The null hypothesis is rejected.
- There is a significant positive correlation between the depth of a rock pool and the number of species of algae it contains.
rs (0.628) > critical value (0.350) at p = 0.05, so the null hypothesis is rejected; there is a significant positive correlation between rock-pool depth and species diversity.
Background Concept
For Spearman's rank correlation, the decision rule is:
- If critical value at the chosen significance level () and number of pairs (), reject H₀.
- If critical value, do not reject H₀.
For and the table gives a critical value of . Because the calculated value is positive and lies between and , the correlation is positive (as one variable increases, so does the other).
Understanding the Question
The student has computed for pairs. We must use the critical value for from Table 1.1 to decide whether this correlation is statistically significant, and what the biological conclusion is.
Approach
- Read the critical value for 32 pairs at : it is .
- Compare: is greater than ? Yes.
- Therefore reject H₀ and conclude a significant correlation.
- Because is positive, the correlation is positive — deeper pools tend to have more species.
Step-by-Step Reasoning
- From Table 1.1, for 32 pairs at , the critical value is .
- The student's .
- By the decision rule, the null hypothesis is rejected.
- We conclude there is a statistically significant correlation.
- The sign of is positive, so the correlation is a positive one: as depth increases, species diversity tends to increase.
Key Takeaways
- A correlation is significant when the calculated statistic exceeds the critical value.
- The sign of tells you the direction (positive or negative); exceeding the critical value tells you significance.
- "Reject the null hypothesis" and "there is a significant correlation" are two ways of saying the same thing.
Common Mistakes
- Comparing against the critical value () and saying the result is not significant — also exceeds , so the result is significant at both levels.
- Saying "the correlation is strong" — strength of correlation and significance are different things.
- Forgetting to mention direction (positive correlation).
Things to Be Careful About
- The conclusion must include both the decision (reject H₀ / significant) and the direction (positive). The mark scheme rewards either, but the strongest answers give both.
- Do not extrapolate beyond the data: "significant" refers to a relationship in the data, not necessarily a causal one.
State one reason why Pearson’s linear correlation coefficient is not appropriate for analysing the data shown in Fig. 1.3.
Answer
Any one of:
- The scatter diagram does not indicate a linear relationship between depth and species diversity.
- The data are not normally distributed.
- Species diversity (number of species of algae) is not a continuous variable — it is a count / discrete data.
Pearson's is unsuitable because the scatter diagram shows no clear linear trend (and/or because the number of species is a discontinuous, non-normal count).
Background Concept
Pearson's linear correlation coefficient () measures the strength of a linear relationship between two continuous variables that are approximately normally distributed. If any of these conditions is violated, Pearson's is inappropriate and a rank-based test such as Spearman's should be used instead.
Understanding the Question
Part (b)(iii) asks for one reason Pearson's is not appropriate for the data in Fig. 1.3, given that Spearman's has been used instead.
Approach
Look at the scatter diagram (Fig. 1.3) and at the variable definitions. Three independent reasons make Pearson's unsuitable:
- The points do not fall along a straight line.
- The values are not normally distributed.
- The y-variable (number of species) is a count — integers only, not continuous.
Give one of these, stated clearly.
Step-by-Step Reasoning
- Inspect Fig. 1.3 — there is a general positive trend but the points are widely scattered and the relationship does not look like a straight line.
- Consider the data type — number of different species of algae can only take whole-number (integer) values: . It is not continuous.
- A variable made of whole-number counts is rarely normally distributed, especially at low values, so the assumption of normality also fails.
Key Takeaways
- Pearson's requires linearity, continuity and approximate normality of both variables.
- Number-of-species data is discrete, often skewed, and not normally distributed — Spearman's is the safer choice.
- Choosing a statistical test is about matching it to the data, not to the size of the sample.
Common Mistakes
- Saying "the data are not correlated" — that is what the test is trying to assess, not why Pearson's is unsuitable.
- Saying "Pearson's is for experiments, not surveys" — there is no such rule.
Things to Be Careful About
- Only one reason is required; any one of the three marks-scheme-listed reasons is sufficient.
- "Number of species is not continuous" is the most decisive single reason and the safest to give.
One important feature of scientific reports is that they provide enough information for other researchers to repeat each investigation.
Explain why it is difficult for researchers to repeat this investigation of species diversity in rock pools from the information provided.
Answer
Any two from:
- The exact location of the rocky shore (in North Wales) is not given.
- The position / extent of the mid-shore zone on that shore is not given.
- The size (depth or area) range of the rock pools sampled is not stated.
- The locations of individual rock pools are not given.
- The state of the tide (height of tide at the time of sampling) is not specified.
Replication is difficult because key spatial and tidal details (exact shore location, mid-shore zone position, pool size, individual pool positions, tide height) are not given.
Background Concept
For a scientific investigation to be repeatable, the report must contain enough information for an independent researcher to repeat the procedure in the same place and under comparable conditions. Anything that varies naturally (geography, season, time of day, tide state) must either be fixed in the report or randomised in a way that can be reproduced.
Understanding the Question
The student described a survey done at one specific rocky shore, in October 2011, at low tide, in the mid-shore zone, on 32 randomly chosen rock pools. We are asked why another researcher could not repeat this study using only the information in the report.
Approach
List everything that the report does not tell the reader but would be needed to find and re-sample the same set of pools on the same shore. Think place, zone, pool identity and tide.
Step-by-Step Reasoning
- The shore is in "North Wales" but no map reference, name of bay, or grid reference is given — another researcher cannot locate the same shore.
- The mid-shore zone is bracketed in Fig. 1.1, but its physical boundaries on this particular shore are not described.
- Pools were described as "small" and "large" but no size thresholds (depth or surface area) are stated, so the sample cannot be reconstructed.
- Pools were selected "at random" from 32, but their individual positions on the shore are not recorded.
- The work was done "at low tide", but the height of tide, the time of low water and the predicted tidal range are not given, so conditions (submersion time, temperature, salinity) cannot be matched.
Key Takeaways
- A repeatable field study needs precise spatial and temporal details — site, zone, time, tidal state.
- "Random selection" alone is not reproducible unless the sampling frame is also described.
- Vague language ("small", "large", "mid-shore") is a common weakness of ecological reports.
Common Mistakes
- Saying "the student did not repeat the investigation" — repeatability refers to whether others can repeat it.
- Giving issues with the data themselves (e.g. scatter of points) rather than missing procedural details.
Things to Be Careful About
- "Location of the rocky shore" and "location of the rock pool" are two separate marks-scheme points — credit both if relevant.
- Two clearly distinct reasons are required; do not give two versions of the same idea.
The student noticed that part of the rocky shore had no rock pools. The student observed that the species of algae were not distributed equally on this part of the rocky shore from the LWM to the HWM.
Describe an investigation to find out how the distribution and abundance of the different species of algae varies on a rocky shore with no rock pools from the LWM to the HWM.
Your method should be set out in a logical order and be detailed enough for another person to follow.
Hypothesis / Prediction
The distribution and abundance of algal species will differ along the shore between LWM and HWM, with species diversity (and the abundance of each species) varying in a regular way with vertical position on the shore.
Variables
- Independent variable: vertical position on the shore (distance, or height, between LWM and HWM).
- Dependent variables: number of different species of algae per quadrat; abundance (e.g. percentage cover) of each species per quadrat.
- Standardised variables:
- Time of day (sample at low tide, e.g. ±1 h of low water).
- Date / season (sample on a single day, or replicate across days within the same week/season).
- Quadrat size and shape.
- Sampling interval along the transect.
- Method of identification of algae (same key / same expert).
Apparatus
- Measuring tape / marked rope long enough to span from LWM to HWM.
- 0.5 m × 0.5 m quadrat (or 1 m × 1 m — must be consistent).
- Identification key for marine algae of North Wales.
- Notebook, pencil, ruler.
- Camera (optional, for verification of uncertain specimens).
- Appropriate clothing: non-slip boots, gloves, waterproofs.
Method
- Choose a section of rocky shore with no rock pools, in North Wales. Locate the LWM and HWM using a tide table / map reference.
- Lay a measuring tape (or marked rope) on the rock surface in a straight belt transect running from the LWM up the shore to the HWM. Record the total transect length.
- Mark sampling points at regular intervals along the transect (e.g. every 1 m, or every fixed vertical height measured with a tape and clinometer). Use the same interval at every point.
- At each sampling point place the same-sized quadrat on the rock surface. Identify every species of multicellular alga inside the quadrat using a standard key.
- Take care to search the whole quadrat, including cracks and small depressions, so that small species are not missed.
- Record, in a results table, the number of different species of algae present in the quadrat and the abundance of each species (e.g. percentage cover, or ACFOR scale, or count of thalli).
- Move to the next sampling point and repeat until the HWM is reached.
- Repeat the entire belt transect at two other positions along the shore (separated by several metres laterally) so that means can be calculated for each sampling point and any unusual areas identified.
- Calculate the mean number of species and mean abundance of each species at each sampling point, and plot them against distance (or height) along the transect.
Quality of results / Replication
- Three replicate transects are sufficient to calculate means.
- At each sampling point, an anomaly check (e.g. a point well outside the trend) prompts a repeat measurement.
- Use the same observer (or inter-observer calibration) to reduce identification bias.
Safety
- Hazard: slipping on wet, seaweed-covered rock.
Risk: falls and injuries.
Precaution: wear non-slip footwear; do not work alone. - Hazard: being cut off by the incoming tide.
Risk: drowning / being trapped against the cliff.
Precaution: check tide times; leave the shore well before the tide rises. - Hazard: sharp barnacles / jagged rock edges.
Risk: cuts and abrasions.
Precaution: wear gloves and tough-soled boots; carry a small first-aid kit.
Belt transect from LWM to HWM with quadrats at regular intervals; record species and abundance per quadrat; replicate at two other transects; identify a specific hazard with risk and precaution.
Background Concept
On a rocky shore, organisms are arranged in roughly horizontal bands (zones) whose position depends on how long they are exposed to air between tides. To describe how a community changes with position, ecologists use a belt transect: a line laid along an environmental gradient, with samples taken at fixed intervals along it. At each point a quadrat — a frame of fixed size — is used so that the area sampled is comparable.
Two measurements are useful for each quadrat:
- Species diversity — the number of different species present (which can be turned into Simpson's or Shannon diversity indices later).
- Abundance — how much of each species is present, often measured as percentage cover (estimated to the nearest or ), or on an ACFOR scale (Abundant, Common, Frequent, Occasional, Rare), or as a count of individual thalli.
Replication is essential because any single transect may pass through an unusual patch; two further transects let you average the results and identify consistent patterns.
Understanding the Question
Part (d) asks for a complete, repeatable plan to investigate how the distribution and abundance of different species of algae vary on a rocky shore with no rock pools, from LWM to HWM. The command word "describe" with "detailed enough for another person to follow" means we must specify apparatus, the procedure step-by-step, controls, replication and safety.
Approach
A high-scoring plan addresses, in order:
- Variables — what is varied (position along the shore), what is measured (diversity and abundance), what is held constant (tide state, quadrat size, sampling interval, time of year).
- Method — use a belt transect with quadrats at regular intervals.
- Identification and counting — same key, careful search for small species, consistent abundance measure.
- Replication — at least three transects, calculation of means.
- Safety — at least one named hazard with the risk and a precaution.
Step-by-Step Reasoning
- Variables. The independent variable is position between LWM and HWM. The dependent variables are species diversity (number of species) and abundance of each species. Standardised: time of day, season, quadrat size, sampling interval, identification method.
- Transect. Lay a rope or tape from LWM to HWM in a straight line on a pool-free section of shore. This is the belt transect.
- Sampling interval. Choose a regular interval (e.g. every 1 m, or every fixed height interval measured with a tape/clinometer). Mark the points so they can be returned to.
- Quadrat. Place the same quadrat at each point. Record every algal species present. Use percentage cover (or ACFOR, or counts of thalli) for abundance. The mark scheme requires a method for abundance of each species.
- Care with small species. The mark scheme explicitly rewards taking care not to miss small species — search cracks, lift algal fronds gently, and use the same observer / key throughout.
- Replication. Repeat the whole transect at two further positions laterally separated along the shore, then calculate means at each sampling point. The mark scheme gives a dedicated mark for "repeat belt transect at two other positions … and calculate means".
- Safety. The mark scheme requires a named hazard and a risk and a precaution. Slippery rocks → non-slip boots and a buddy; rising tide → check tide tables and time limit on the shore; sharp barnacles → gloves.
Key Takeaways
- A belt transect is the standard tool for studying change along an environmental gradient.
- Quadrats standardise the area sampled; their size must be the same at every point.
- Both species diversity and abundance should be measured, not just diversity.
- Replication (≥ 3 transects) is essential to identify real patterns versus local anomalies.
- Risk assessment requires three linked items: hazard, risk, and precaution.
Common Mistakes
- Using a line transect (recording species touched by the line) instead of a belt transect with quadrats — the mark scheme explicitly requires quadrats.
- Failing to specify the interval between sampling points — must be regular.
- Recording only "number of species" and not abundance — the mark scheme rewards an abundance method.
- Identifying a hazard without saying the risk and a precaution.
- Forgetting to replicate — a single transect is not a defensible ecological study.
Things to Be Careful About
- The shore section must have no rock pools (the stem says so); an investigator who includes pools will not answer the actual question.
- "Algae" here means the multicellular marine algae — the stem is explicit.
- A belt transect goes from LWM to HWM across the zones, not along the shore.
- The same quadrat must be used at every sampling point (and the same quadrat size in the repeated transects).
The rest of this paper
1 more questions- Q2Planning · Analysis, Conclusions and Evaluation14M