Biology 9700/51 — October/November 2023
Cambridge A-Level · Planning, Analysis and Evaluation · worked solutions for every part, with the mark scheme
Topics Planning · Analysis, Conclusions and Evaluation
Fruits in the diet can be a source of vitamins, such as vitamin C and vitamin A, which are important in maintaining good health.
Vitamin A is a group of molecules that includes retinol and retinal.
Vitamin C is an organic acid known as ascorbic acid.
Ripening occurs in fruit when molecular changes cause an increase in sugar content, colour changes and softening of the fruit, over time.
Ascorbic acid is found in plant cells. The fruits of many plants have high concentrations of ascorbic acid.
A student planned to investigate how ascorbic acid concentration changes with ripeness in the fruit of the apple tree, Malus domestica.
The fruit of M. domestica (apples) are shown in Fig. 1.1.
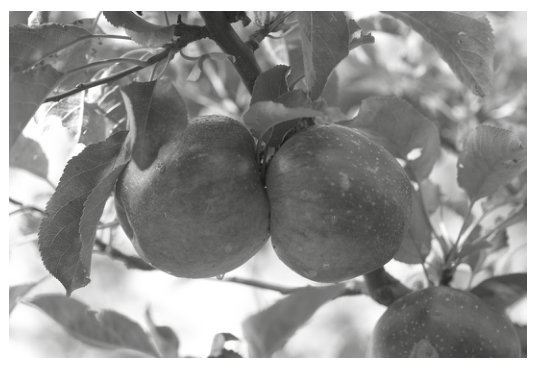
Fig. 1.1
The student removed an apple that was in diameter from a tree. The student measured the sugar content of the apple, which was low. This indicated that the apple was at the early stages of ripening (unripe).
For the investigation, the student decided to select apples from trees when each apple was in diameter.
The student assumed that the ripeness of each apple would increase each day after it had been picked from a tree.
Suggest why the diameter of the apples selected may not give accurate estimates of ripeness.
Answer
Diameter of an apple may not be related (proportionally) to its ripeness, so apples of the same diameter may be at different stages of ripening.
Size may not be related/proportional to ripeness; or apples may ripen at different rates; or other factors may affect ripeness/diameter.
Background Concept
Ripening of a fruit such as an apple is a coordinated set of molecular and physiological changes: starches are converted into sugars, chlorophyll is broken down to reveal underlying pigments, and cell walls are softened by enzymes such as pectinase. These changes occur over a continuous timescale, but they are not strictly synchronised with growth in size. A fruit can be expanding rapidly and yet still be biochemically unripe.
When a variable (here, diameter) is used to select experimental material, it must reflect the property being studied (ripeness). Diameter is a cumulative measure of all previous growth, whereas ripeness is a current biochemical state; the two need not correspond.
Understanding the Question
The student removes apples of exactly in diameter and assumes they are all at the same, early, ripening stage. The question asks why this assumption may be inaccurate.
Approach
Think about what could decouple diameter from ripeness: variation between individual fruits on a tree, the influence of environmental conditions on growth, and the fact that size is a cumulative measure while ripeness is a current-state measure.
Step-by-Step Reasoning
The mark scheme accepts any one of these points (1 mark):
- Size is not proportional to ripeness. Two apples of the same diameter may have been on the tree for different lengths of time or grown under different conditions, so they may be biochemically at different points along the ripening pathway even though they look similar in size.
- Apples ripen at different rates. Genetic and microenvironmental differences between individual apples mean two apples of the same size need not be at the same stage of ripening.
- Other factors affect ripeness and/or diameter. Position on the tree, light exposure, water availability and pest damage can all change either how big an apple grows or how quickly it ripens, so a single diameter value cannot capture this variation.
Any of these is sufficient. The strongest answer ties the two ideas together: diameter sums all previous growth, while ripeness reflects recent biochemistry, so they need not match.
Key Takeaways
- Selecting experimental material requires choosing a variable that reflects the property you actually want to study.
- A convenient, easy-to-measure variable is not necessarily a good proxy for the underlying biology.
- Variation between individuals of the same species and developmental stage can introduce uncontrolled variables.
Common Mistakes
- Saying that diameter is "not accurate" without giving a reason. The mark scheme requires the reason (size may not be related to ripeness, or apples may ripen at different rates).
- Confusing this with measurement error; the issue here is the validity of the criterion, not the precision of the measurement.
Things to Be Careful About
- Stay close to the mark scheme wording: "size may not be related to ripeness" or "apples may ripen at different rates" are accepted; do not invent unrelated criticisms such as "the ruler was inaccurate".
Describe an improvement to the method for selecting the apples that would give more accurate estimates of ripeness.
Answer
Measure the sugar content (or colour or softness) of each apple and select only those with the same / similar sugar content (or colour or softness) to use in the investigation.
Pick apples with the same/similar sugar content, colour, softness or age; or test/measure these properties.
Background Concept
The stem of the question defines ripeness by three changes: an increase in sugar content, a change in colour, and a softening of the fruit. These are the direct indicators of ripeness, in contrast to diameter which is an indirect and unreliable proxy. A good selection method uses one of these direct indicators.
Understanding the Question
Following the criticism in (a)(i), the student is asked to describe a more accurate way of selecting apples that are all at the same stage of ripening. The improvement must give a more accurate estimate of ripeness than diameter does.
Approach
Replace the diameter criterion with one of the actual ripening indicators mentioned in the stem: sugar content, colour, or softness. The improvement should be both measurable (so it can be standardised across apples) and biologically meaningful (so it really tracks ripeness).
Step-by-Step Reasoning
The mark scheme accepts any one of these (1 mark):
- Select apples with the same / similar sugar content, colour, softness, or age. Choosing apples that match on one of these direct ripeness indicators ensures the sample starts the experiment at a comparable biological state.
- Test / measure the sugar content, colour, softness, or age of the apples. This makes the criterion operational — instead of just describing what would be a better criterion, the student specifies the measurement that will be used to apply it (e.g. a refractometer for sugar content, a colour chart for colour, a penetrometer for firmness, or a known picking date for age).
A complete answer often combines the two ideas: "Measure the sugar content of each apple and only use those with similar sugar contents." That scores as one mark for either half, with the other half being bonus detail.
Key Takeaways
- Whenever possible, the criterion used to standardise a variable should be the direct measure of the property of interest.
- A measurable criterion (e.g. Brix refractometer reading, colour score, penetrometer reading) is stronger than an unmeasurable one (e.g. "similar appearance").
- The improvement should be specific to the question, not a generic method-improvement such as "use more samples".
Common Mistakes
- Saying "use apples of the same mass" — this is another proxy for growth, not for ripeness, and is not credited.
- Saying "use a colourimeter to measure the colour" is acceptable; the mark scheme accepts "measure colour", and a specific instrument is bonus detail.
Things to Be Careful About
- Stay within the biological indicators given in the stem: sugar content, colour, softness. Do not invent new criteria like "use the same cultivar" or "pick from the same branch" — these are controls, not ripeness measures.
The student researched how ascorbic acid concentration changes with ripeness in the fruit of other species.
Based on this research, the student predicted that ascorbic acid concentration in apples will:
- be lowest in unripe apples when they are first picked from the tree
- increase over several days and peak in partially ripe apples
- decrease slightly in later days as the apples become fully ripe.
Sketch a line graph below, including labelled axes, to show the predicted results.
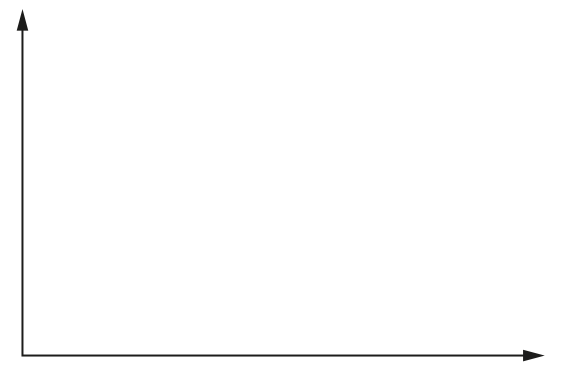
Answer
Axes:
- y-axis: ascorbic acid concentration
- x-axis: time (days after picking)
Curve: starts at a low positive value on the y-axis, rises with a positive gradient to a peak (in the partially-ripe region), then falls slightly with a small negative gradient as the apples become fully ripe.
Sketch graph: y-axis = ascorbic acid concentration, x-axis = time; line starts low, rises to a peak, then decreases slightly.
Background Concept
A sketch graph is a quick line drawing that conveys the predicted relationship between two variables. It is not a precise plot of data: it does not need accurate numerical scales, but it must have (i) axes correctly labelled with the two variables, and (ii) a curve whose shape matches the predicted relationship.
The prediction in this question is three-staged: ascorbic acid concentration is lowest at picking, rises over several days to a peak in partially-ripe apples, then falls slightly as the apples become fully ripe. The sketch must therefore start low, rise, peak, and then fall — but only slightly, because the prediction is "decrease slightly" rather than collapse.
Understanding the Question
The question asks the student to convert the verbal prediction (a low start, a rise to a peak, a small fall) into a sketch graph on the axes provided in Fig. 1.b.
Approach
Identify the dependent and independent variables: ascorbic acid concentration is what changes, and time is what it changes with, so ascorbic acid goes on the y-axis and time on the x-axis. Then draw a single smooth curve that rises to a peak and falls slightly afterwards.
Step-by-Step Reasoning
- Label the y-axis "ascorbic acid concentration" — this is the dependent variable (it is what is being predicted). Mark awarded: 1.
- Label the x-axis "time" — this is the independent variable (days after picking). Together with (1) this gives a fully labelled pair of axes.
- Draw the curve. The mark scheme awards 1 mark for a line of the correct shape: starting at a positive y-value (low but not zero), increasing with a positive gradient, reaching a peak, then decreasing with a small negative gradient. The decrease should be visibly smaller than the rise, matching "decrease slightly" in the prediction.
- The curve should be smooth (or a single straight line of best fit through the conceptual points), and the peak should be roughly in the middle of the time axis but slightly to the right (since the prediction says concentration increases over several days before peaking).
Key Takeaways
- A sketch graph carries two pieces of information: the axes and the shape. Both are required for full marks.
- Quantitative units are not needed for a sketch, but the qualitative shape must match the verbal description.
- "Slightly decrease" means a small negative gradient, not a sharp drop.
Common Mistakes
- Plotting the curve so that it falls back to zero — the prediction specifies "decrease slightly", not return to baseline.
- Putting time on the y-axis and concentration on the x-axis — the dependent variable must be on the y-axis by convention.
- Drawing a straight line rather than a curve that rises, peaks, and falls; the prediction is explicitly three-staged.
Things to Be Careful About
- A sketch graph should not include data points; the question asks for a predicted line, not plotted data.
- The curve should not start at the origin (the prediction is that concentration is lowest in unripe apples, not zero).
The student used the redox indicator DCPIP to investigate how ascorbic acid concentration changes as the apples ripen.
The student tested the ascorbic acid concentration of the apples at intervals from the time they were taken from the tree until the apples were fully ripe.
For each test, the student prepared an apple extract solution and reacted this with a DCPIP solution of standardised concentration.
The student was provided with a stock solution of DCPIP.
After preliminary research, the student decided to dilute the stock solution to prepare a DCPIP solution to use in the experiment.
The student used two steps to dilute the stock solution to the DCPIP solution.
Complete the description of the two steps for the dilution by adding the correct values to the sentences.
step 1
The student mixed of DCPIP stock solution with ______ of distilled water to produce solution A. Solution A had a concentration of .
step 2
The student then mixed ______ of solution A with of distilled water to produce the DCPIP solution.
Working
Step 1 — dilute the stock to (solution A):
So of distilled water must be added.
Step 2 — dilute solution A to (final total volume ):
So of solution A is mixed with of distilled water.
Answer
- Step 1: add of distilled water.
- Step 2: mix of solution A with the of distilled water.
Step 1: 90 cm³ of distilled water; Step 2: 50 cm³ of solution A.
Background Concept
A serial dilution reduces the concentration of a solution in controlled steps using the relationship , where and are the concentration and volume of the starting solution, and and are the concentration and volume of the diluted solution. The total volume of the diluted solution is the volume of stock plus the volume of diluent (here, distilled water).
In a two-step serial dilution, the output of the first step becomes the input to the second step. The mathematics is the same for each step, but the working out must be kept separate so that the volumes in step 2 are not confused with the volumes in step 1.
Understanding the Question
The student has a stock of DCPIP and needs a working solution. They do this in two stages, producing an intermediate solution A of . The question gives the volumes of stock (10 cm³) and final water (50 cm³) for one of the two stages, and asks for the missing volumes in each stage.
Approach
For each step, apply , solve for the missing total volume , and then subtract the known volume of stock/solution A to find the volume of distilled water required.
Step-by-Step Reasoning
Step 1
- (stock)
- (volume of stock used)
- (target concentration of solution A)
- Substitute into :
, giving . - Distilled water to add = .
Step 2
- (solution A)
- (final working solution)
- (solution A) (distilled water) .
- Substitute into :
, giving . - Volume of solution A required = .
So the missing values are (in step 1) and (in step 2). Each is worth 1 mark.
Key Takeaways
- The dilution equation requires the total volume of the diluted solution () to be used, not just the volume of diluent added.
- In a two-step dilution, the output of step 1 is the input to step 2 — keep the working separate and clearly labelled so the two stages are not muddled.
- A useful sanity check: in step 1, the stock is diluted by a factor of 10 (from 0.01 to 0.001), so the total volume must be 10× the stock volume (10 cm³ → 100 cm³), giving 90 cm³ of water. In step 2, the dilution factor is 2 (0.001 to 0.0005), so equal volumes of solution A and water are needed.
Common Mistakes
- Using as the volume of diluent (e.g. writing and giving the answer as "100 cm³ of water" instead of subtracting the 10 cm³ of stock).
- Dividing by the wrong concentration, e.g. using 0.01 instead of 0.001 in step 2, which would give 5 cm³ instead of 50 cm³.
- Forgetting that the units on both sides of the equation must be the same — the cm³ cancel cleanly as long as the same unit is used throughout.
Things to Be Careful About
- The in the equation refers to the total volume of the new solution, which equals (volume of stock + volume of water added). Always subtract the stock volume to get the volume of water.
- Double-check the direction of the dilution: if then , and the answer must be a positive volume of water.
DCPIP changes colour from blue to colourless when it is reduced by ascorbic acid.
- The volume of DCPIP that can be reduced by ascorbic acid is a measure of the concentration of ascorbic acid present in a solution.
- When all the ascorbic acid present in a solution has reacted with DCPIP, any more DCPIP that is added will remain blue.
The student had access to standard laboratory equipment and a burette.
DCPIP solution can be added to a burette and released one drop at a time by turning a tap.
Fig. 1.2 shows a burette set up for this investigation.
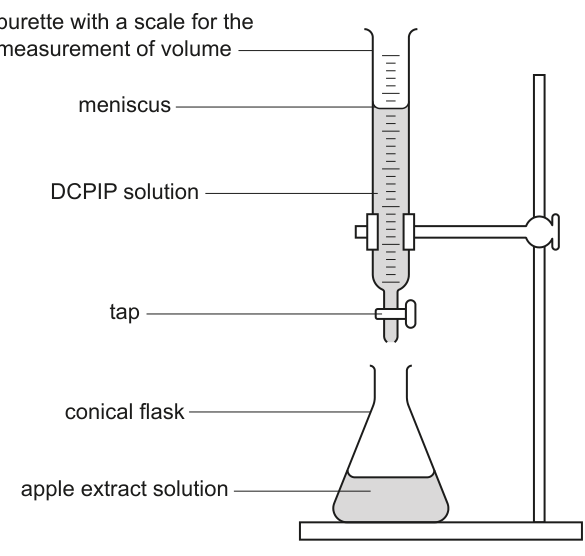
Fig. 1.2
Describe a method the student could use to:
- prepare apple extract solutions from the fruit
- collect the results needed to show the changes in ascorbic acid concentrations as the apples ripen, using DCPIP.
The description of your method should be set out in a logical way and be detailed enough for another person to follow.
You should not repeat the details from (c)(i) describing how to dilute the stock solution of DCPIP.
Answer
Sampling schedule and standardisation
- Test the apples on at least 5 different days (e.g. day 0, 2, 4, 6, 8) from picking until they are fully ripe.
- Use apples from the same tree (or the same variety) to control for genetic and environmental variation.
- Store all the apples under the same conditions (same temperature, humidity, light level) between tests.
Preparing the apple extract solution
- Peel the apple and remove the core and seeds, leaving only the flesh.
- Cut the flesh into small pieces and weigh out a fixed mass (e.g. ) using a balance.
- Grind the apple pieces in a mortar and pestle with a small, fixed volume of distilled water (e.g. ) to release the cell contents.
- Filter the mixture (e.g. through muslin or filter paper) or centrifuge it to obtain a clear apple extract solution; discard the solid residue.
Measuring ascorbic acid with DCPIP
- Pipette a fixed volume (e.g. ) of the clear apple extract into a conical flask.
- Fill a burette with the DCPIP solution prepared in (c)(i) and record the initial volume.
- Open the tap of the burette and add DCPIP to the conical flask one drop at a time.
- After each drop, swirl / mix the contents of the flask.
- Stop adding DCPIP when the blue colour of the DCPIP persists in the flask (the end-point: all the ascorbic acid has reacted and any further DCPIP is in excess).
- Record the final volume of DCPIP in the burette and calculate the volume used. Read the bottom of the meniscus at eye level to avoid parallax error.
- Repeat the titration on at least 3 replicate apples (or 3 replicate extracts from the same apple) for each day and calculate a mean volume of DCPIP used.
Safety
- DCPIP is an irritant (and a possible allergen / toxin): wear gloves, goggles and a lab coat; wash hands after use.
- Sharp blades (knife / scalpel) are used to cut the apple: cut on a stable board, away from the hand holding the apple.
- Some people are allergic to apples: do not eat the apple during the practical; anyone with a known apple allergy should not handle the extract.
Standardise apples (same tree, same storage); test on ≥5 days; prepare extract (peel, core, weigh, grind, filter/centrifuge); titrate fixed extract volume with DCPIP from burette dropwise to a persistent blue end-point; record volume from meniscus; ≥3 replicates per day and mean; safety PPE for DCPIP and sharp blades.
Background Concept
DCPIP titration. DCPIP (2,6-dichlorophenolindophenol) is a blue redox dye that is reduced by ascorbic acid to a colourless form. In a titration, a standardised DCPIP solution is added to a solution containing ascorbic acid; the end-point is the first drop of DCPIP that remains blue, because at that point all of the ascorbic acid has been oxidised and there is nothing left to reduce the next drop. The volume of DCPIP used is directly proportional to the concentration (or amount) of ascorbic acid in the sample.
Why standardise everything. Because the student wants to track how ascorbic acid concentration changes with ripeness, the only thing that should change between samples is ripeness. Anything else that varies (apple variety, storage temperature, mass of apple used, volume of extract pipetted, etc.) will introduce noise that masks the effect of ripeness, so each of these must be controlled.
Understanding the Question
The student has prepared a DCPIP solution in (c)(i). Now they need (i) a way to get the ascorbic acid out of the apple tissue in a form that can be titrated, and (ii) a titration procedure that gives reliable, comparable results across the ripening period. The method must be detailed enough for another person to follow, and it must include safety.
Approach
Structure the method in three blocks:
- Sampling and standardisation — how often the apples are tested and what is held constant.
- Extraction — how the apple is converted into a clear, measurable solution.
- Titration — how the DCPIP is added to the extract and the result read off.
Add a safety section covering DCPIP and any sharp tools used to cut the apple.
Step-by-Step Reasoning
The mark scheme offers 14 possible points; any 9 score 9 marks. The points group naturally into the four blocks above.
Sampling and standardisation (mark-scheme points 1–3):
- Test on at least 5 days. Ripening is a slow process; a single comparison between day 0 and day 8 would not capture the rise-peak-fall pattern. Five or more time points spread across the ripening period are needed.
- Use apples from the same tree / variety. Different apple cultivars have very different ascorbic acid contents, and even within one cultivar, trees grown in different soils / climates differ. Mixing sources would add uncontrolled variation.
- Same storage conditions (temperature, humidity, light) between tests. Storage conditions affect how quickly the apple ripens and how much ascorbic acid is lost to oxidation. Holding these constant removes them as confounders.
Extract preparation (mark-scheme points 4–7):
- Remove the skin and seeds. The skin is low in ascorbic acid and the seeds contain compounds that could interfere with the titration; the flesh is the part actually being studied.
- Use a set / stated mass of apple. Without a fixed mass, a sample of extract from a 5 g piece of apple contains a different amount of ascorbic acid than the same volume from a 20 g piece, so the titration result would not be comparable between days.
- Grind the apple. Cells must be broken open to release the ascorbic acid; a mortar and pestle (with a small volume of water to help break the cells) is the standard method.
- Centrifuge or filter the homogenate. The result must be a clear solution, not a suspension; otherwise the suspended solids would obscure the colour change of the DCPIP.
DCPIP titration (mark-scheme points 8–13):
- Place a set / stated volume of the extract in a conical flask. The volume of extract titrated must be the same on every day, otherwise the volume of DCPIP used is not directly comparable.
- Add DCPIP dropwise to the extract solution until the blue colour remains. This is the end-point: at this point, all the ascorbic acid has been oxidised and any further DCPIP stays blue because nothing in the extract can reduce it.
- Shake / mix after each drop. The DCPIP must contact the ascorbic acid in the extract before the next drop is added; without mixing, locally the extract becomes saturated and the colour change is slow / uneven.
- Measure and record the volume of DCPIP used. This is the dependent variable; record the difference between the final and initial burette readings.
- Read the volume from the bottom of the meniscus (at eye level). Standard practice for reading a burette; avoids parallax error.
- At least 3 replicates per day, then take a mean. Random variation between apples (and between extractions) means a single titration per day is unreliable. Three or more replicates allow a mean to be calculated and anomalies to be identified.
Safety (mark-scheme point 14):
- State a hazard, the risk it poses, and the precaution to take. The mark scheme table gives credit for hazard + risk + precaution. Examples:
- DCPIP is an irritant / toxin → wear gloves and goggles, wash hands after use.
- Knife / scalpel used to cut the apple → cut on a board, away from the hand.
- Some people are allergic to apples → do not eat the apple during the practical; allergy sufferers should not handle the extract.
A full 9-mark method covers all four blocks; usually a student will write 9 of the 14 possible points.
Key Takeaways
- A titration method needs (i) a defined end-point, (ii) a way to detect it, and (iii) a way to record the amount of titrant used.
- Standardising the variables that are not being studied is essential to isolate the effect of the variable that is.
- Replication (≥3) and a calculated mean are required for a reliable result.
- Safety points need to link a specific hazard to a specific risk and a specific precaution; vague answers like "be careful" are not credited.
Common Mistakes
- Saying "add DCPIP until the solution turns blue" without saying dropwise — this misses the pointwise addition needed to detect the end-point precisely.
- Omitting the meniscus reading point — a common error because it is assumed rather than stated.
- Replicating the dilution step from (c)(i) — the question explicitly says not to repeat the dilution details.
- Vague safety ("be careful with the chemicals") — the mark scheme requires hazard + risk + precaution, all three linked.
- Forgetting the control of variables: testing apples from different trees, or at different storage temperatures, makes the day-to-day comparison invalid.
Things to Be Careful About
- "DCPIP changes colour from blue to colourless when it is reduced by ascorbic acid" — so during the titration the blue disappears as the DCPIP is reduced. The end-point is the first drop that does not lose its blue colour, because at that point the ascorbic acid has run out.
- The mass of apple used and the volume of extract pipetted must both be fixed; if either changes between days, the DCPIP volume is not directly comparable.
- The method should be in a logical order (sampling → extract → titration → safety) so that another person could follow it; the mark scheme explicitly looks for logical set-out.
After recording the results, the student decided that Pearson’s linear correlation was a more appropriate test to use than Spearman’s rank correlation to test whether ripeness and ascorbic acid concentration were correlated.
Suggest two reasons why Pearson’s linear correlation was the more appropriate statistical test.
Answer
- The data are continuous (ripeness can take any value along a numerical scale, and ascorbic acid concentration is a continuous measurement); Pearson's linear correlation requires both variables to be continuous, whereas Spearman's rank correlation is used for ordinal or non-normal data.
- The scatter diagram suggests a linear relationship between the two variables, so the conditions for Pearson's correlation are satisfied; Spearman's would be more appropriate for a monotonic but non-linear relationship.
Data is continuous; scatter diagram suggests a linear relationship; data is normally distributed.
Background Concept
Pearson's linear correlation measures the strength of a linear relationship between two continuous variables that are approximately normally distributed. It calculates a coefficient that lies between and .
Spearman's rank correlation is the non-parametric equivalent. It works on ranked (ordinal) data and detects any monotonic relationship (one that consistently goes up or goes down, not just linear ones). It does not require the data to be normally distributed.
Choosing the correct test depends on the data type and distribution:
- Continuous, normally distributed, linear relationship → Pearson's.
- Ordinal, or non-normal, or non-linear (but monotonic) → Spearman's.
Understanding the Question
The student has collected paired measurements (ripeness and ascorbic acid concentration) on the same apples across the ripening period. Both variables are quantitative. The student chose Pearson's over Spearman's and the question asks why this is appropriate.
Approach
List the conditions under which Pearson's is the better test, and check each against the data in this experiment.
Step-by-Step Reasoning
The mark scheme accepts any two of the following (1 mark each):
- The data are continuous. Ripeness can be quantified on a continuous scale (e.g. days from picking, sugar content), and ascorbic acid concentration is a continuous measurement. Pearson's requires continuous data, while Spearman's is reserved for ranked / ordinal data where the intervals between values are not equal.
- The scatter diagram suggests a linear relationship. Pearson's measures the strength of a linear correlation; if a plot of the data shows points lying approximately along a straight line, Pearson's is the appropriate test. Spearman's would be chosen if the relationship were monotonic but curved.
- The data are normally distributed. Pearson's assumes bivariate normality; Spearman's is a non-parametric test that does not require normality, so if normality holds, Pearson's is the more powerful choice.
Any two of these are sufficient for the two marks. The strongest answers pick the two most directly observable features of the data (continuous and approximately linear) rather than the more abstract normality assumption.
Key Takeaways
- Pearson's correlation: continuous data, approximately linear, normally distributed.
- Spearman's correlation: ranked / ordinal data, or non-linear but monotonic, or non-normal data.
- The choice of test is determined by the data, not by which test the student prefers.
Common Mistakes
- Saying "Pearson's is more accurate" without giving a reason that links to the data type or distribution.
- Confusing the tests with their alternatives: Spearman's is for ranked data, not for unranked data with outliers.
- Saying "the relationship is linear" without saying how this was established (i.e. from a scatter diagram).
Things to Be Careful About
- "Linear" in Pearson's refers to a straight-line relationship, not a general trend. The candidate should justify linearity by referring to a scatter diagram.
- "Continuous" here means numerical on an interval or ratio scale, not "measured in whole numbers". A count that only takes integer values is still treated as continuous for the purposes of correlation.
Many fruits are a good source of -carotene, which can be converted in the human body to vitamin A.
The student investigated the -carotene content of apples.
The student measured the -carotene concentration in ripe apples and the ripe fruit of four other species.
Fig. 1.3 shows the results.
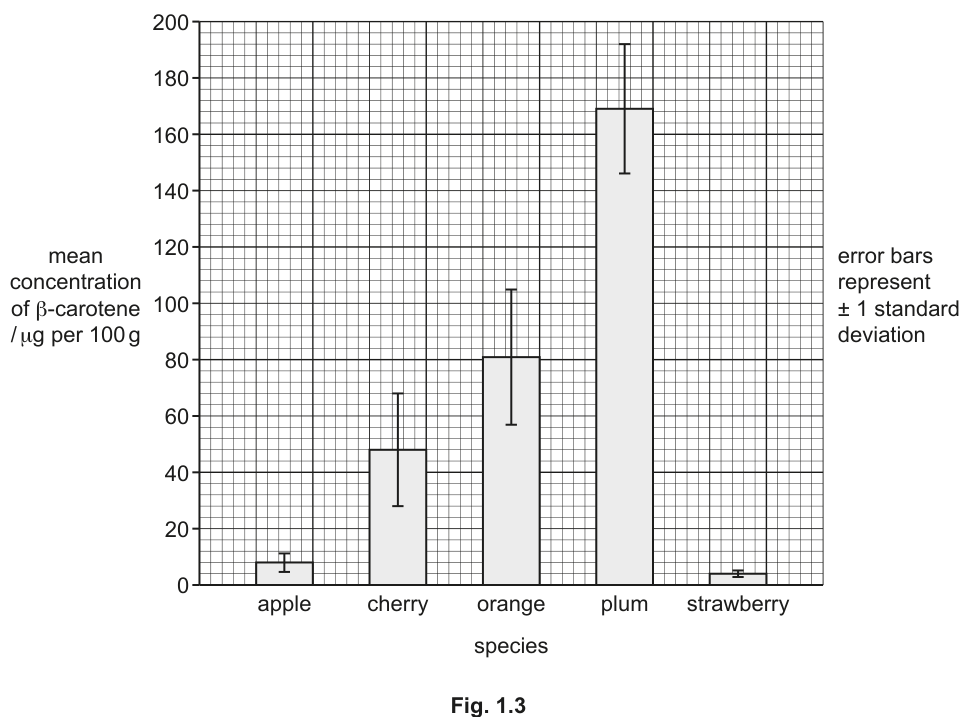
Fig. 1.3
The student concluded that apples are not a good dietary source of vitamin A.
Use the data in Fig. 1.3 to evaluate this conclusion.
Answer
For the conclusion:
- Apple has the second lowest mean -carotene concentration of the five fruits shown (≈ ), so on this evidence it does appear to be a poor source.
- The standard deviation for apple is small (the error bars in Fig. 1.3 are very short), so the mean is reliable — the result is not being driven by a few unusual values.
Against the conclusion:
- No statistical test (e.g. t-test) was carried out to confirm that the difference between apple and the other fruits is significant; the SE / 95% CI would need to be calculated to be sure that the difference is not due to random variation.
- Only 5 fruit species were tested, so the comparison is too narrow to support a general claim that apples are not a good source of vitamin A.
For: apple has second lowest β-carotene (≈ 8 μg/100 g) with small error bars. Against: no statistical test (t-test / SE / 95% CI) and only 5 species tested, so the comparison is too narrow to support a general claim.
Background Concept
β-carotene is a yellow-orange pigment found in many fruits and vegetables. In the human body it is converted to retinol (vitamin A), so dietary β-carotene is a major source of vitamin A. The Recommended Daily Allowance (RDA) for vitamin A is around retinol-equivalents per day for an adult.
Bar charts with error bars show the mean of each sample plus a measure of spread (here, ±1 standard deviation). A small error bar means the individual measurements cluster close to the mean; a large error bar means the measurements are spread out and the mean is less reliable.
Statistical tests (such as the t-test) and confidence intervals (e.g. 95% CI = mean ± 2 × standard error) are needed to determine whether differences between groups are statistically significant or could be due to random variation.
Understanding the Question
The student measured β-carotene in five ripe fruits, including apple, and concluded that apples are not a good dietary source of vitamin A. The question asks the candidate to evaluate this conclusion, which means weighing the evidence that supports the conclusion against the evidence that undermines it, and identifying the limitations of the data.
Approach
Read the bar heights and error bars from Fig. 1.3 to support or contradict the conclusion, then identify the statistical and sampling limitations that the student has not addressed.
Step-by-Step Reasoning
For the conclusion (data that supports the claim):
- Apple has the second lowest mean concentration. Reading from Fig. 1.3, the bar for apple is at about , which is just above strawberry (about ) and well below cherry (≈ ), orange (≈ ) and plum (≈ ). On this comparison alone, apple is a poor source of β-carotene.
- Quoted data from Fig. 1.3 (e.g. "apple ≈ , plum ≈ — a 20-fold difference") strengthens the argument with specific values rather than vague terms like "much less".
- The error bar for apple is small, indicating a small standard deviation. This means the mean is reliable and not the result of a few outlier values; the result is reproducible across the apples tested.
Against the conclusion (caveats and weaknesses):
- No SE or 95% CI has been calculated. The error bars show ±1 SD, which describes the spread of the data but does not by itself tell us whether the means of two fruits are significantly different. To make a claim about a real difference, the student would need to calculate the standard error of each mean and either compare 95% CIs or carry out a t-test.
- No statistical test has been carried out. A formal t-test would tell us whether the difference between apple and, say, cherry or orange is statistically significant. Without it, the apparent difference could be due to random sampling.
- Only 5 species were tested. The conclusion is a general claim about apples as a dietary source, but the data only compare apple with four other specific fruits. A robust claim would require testing many more species (or many cultivars within apple) and against an RDA benchmark rather than against other fruits.
Any three of the six points above earn the three marks. The strongest evaluation gives at least one point for and at least one point against, so the conclusion is not accepted or rejected outright.
Key Takeaways
- An "evaluate" question always requires both supporting and contradicting evidence, plus an awareness of what the data cannot tell you.
- Error bars on a bar chart are only as informative as the statistic they represent; ±1 SD is a measure of spread, not of significance.
- General claims require broad sampling; testing 5 species is not enough to support a conclusion about all fruits.
- A conclusion based on a small number of means needs a statistical test (or at least 95% CIs) before it can be claimed as significant.
Common Mistakes
- Only giving points for the conclusion (or only points against). The mark scheme requires both directions.
- Saying the difference is "significant" because the error bars do not overlap. ±1 SD bars overlapping does not mean the means are not different; significance requires a formal test (t-test) or 95% CIs (mean ± 2 × SE).
- Vague statements like "the sample is too small" without saying what should be done (test more species, or test more apples within each species, or use a statistical test).
- Saying "apples are a good source of vitamin A" — the data clearly show the opposite, so this contradicts the data and the question.
Things to Be Careful About
- The y-axis of Fig. 1.3 is in of fruit, not per serving. A typical serving of apple (≈ 150 g) would still only deliver around of β-carotene, well below the RDA of retinol-equivalents. The numerical data therefore support the student's conclusion qualitatively, but the general claim still needs more rigorous support.
- "Statistically significant" is a technical term; a difference between two means is only significant if a statistical test (or comparison of 95% CIs) supports it. Do not use the word "significant" loosely.
The rest of this paper
1 more questions- Q2Planning · Analysis, Conclusions and Evaluation10M