Biology 9700/53 — May/June 2023
Cambridge A-Level · Planning, Analysis and Evaluation · worked solutions for every part, with the mark scheme
Topics Analysis, Conclusions and Evaluation · Planning
Hydrogencarbonate indicator is a water-soluble solution that can act as a source of carbon dioxide for aquatic photosynthetic organisms. The solution changes colour depending on the concentration of carbon dioxide in the solution. These colours are related to different pH values, as shown in Table 1.1.
Table 1.1
| colour of hydrogencarbonate indicator solution | pH | concentration of carbon dioxide in the solution |
|---|---|---|
| yellow | 7.6 | increasing carbon dioxide concentration |
| yellow-orange | 7.8 | |
| orange | 8.0 | |
| orange-red | 8.2 | |
| red | 8.4 | atmospheric concentration |
| red-magenta | 8.6 | decreasing carbon dioxide concentration |
| magenta | 8.8 | |
| magenta-purple | 9.0 | |
| purple | 9.2 |
Chlorella vulgaris is a protoctist that is single-celled, aquatic and photosynthetic. It can be immobilised in alginate beads.
Alginate beads with immobilised C. vulgaris can be used to measure the rate of photosynthesis.
A student noticed that a colour change occurred, from red to magenta, when the alginate beads with immobilised C. vulgaris were left in a container of hydrogencarbonate indicator solution and exposed to light.
Explain why this colour change occurred.
The student used the alginate beads with immobilised C. vulgaris in hydrogencarbonate indicator solution to investigate the rate of photosynthesis in different light intensities.
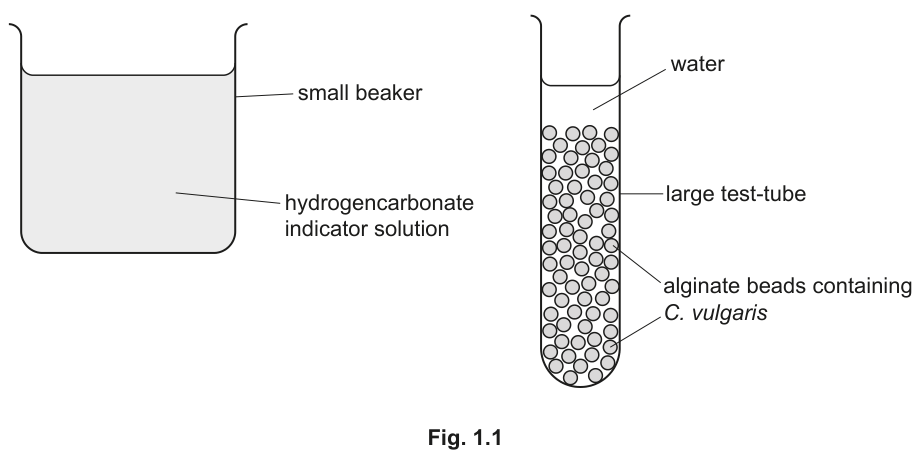
Fig. 1.1 shows some of the apparatus and reagents the student used.
Identify the independent variable in this investigation.
The student was provided with a supply of alginate beads containing immobilised C. vulgaris.
Describe a method the student could use to collect data to determine the effect of light intensity on the rate of photosynthesis of C. vulgaris using hydrogencarbonate indicator and the experimental set-up in Fig. 1.1.
Your method should be set out in a logical order and be detailed enough to let another person follow.
The student set up a large test-tube containing alginate beads with immobilised C. vulgaris in hydrogencarbonate indicator solution at pH 8.4 (red).
The student kept this set-up in the dark for 12 hours.
Predict and explain the results that will be observed after 12 hours in the dark.
Some scientists wanted to culture cells of C. vulgaris on a large scale for use as a biofuel.
To determine the optimal growing conditions for C. vulgaris, the scientists needed to determine the number of cells per of suspension to monitor the population growth.
They tried two methods to determine the number of cells per of suspension.
The first method used a Secchi stick, as shown in Fig. 1.2.
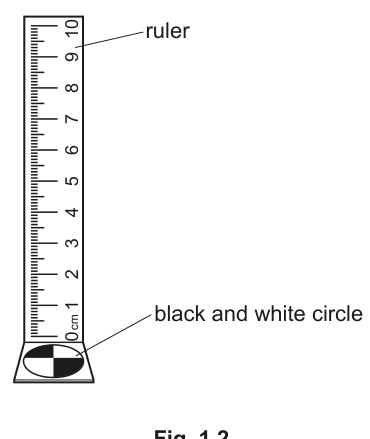
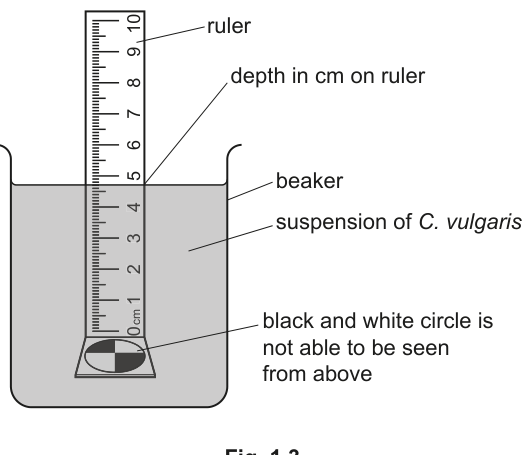
The Secchi stick is lowered into the suspension of cells until the black and white circle is not able to be seen from above.
The depth in is recorded from the ruler, as shown in Fig 1.3.
The () of the number of cells is determined from a graph of of cells counted per suspension against Secchi depth (), as shown in Fig 1.4.
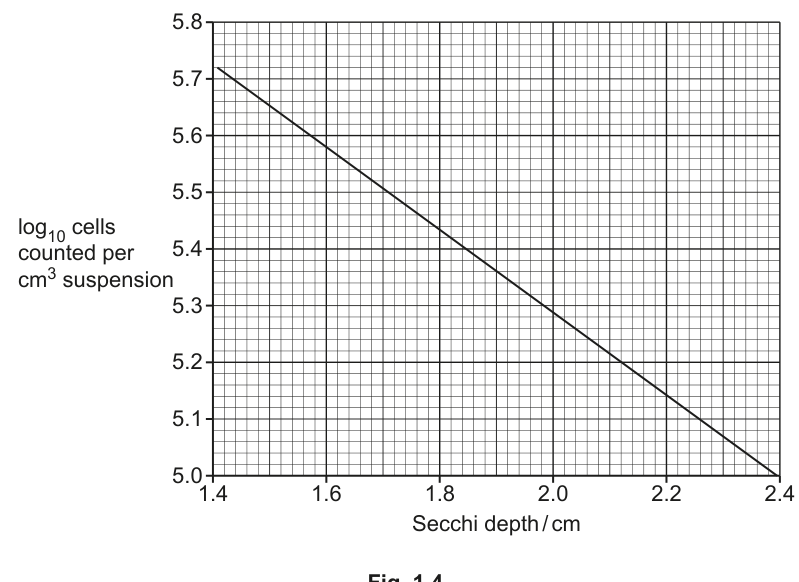
When the scientists inserted the Secchi stick into a sample from their cell suspension, the circle (on the Secchi stick) was not able to be seen at a depth of .
Using the graph in Fig. 1.4, calculate the actual number of cells per of suspension.
Show your working and give your answer to the nearest cells.
number of cells per of suspension = ______
The second method used a counting chamber to determine the number of cells per of suspension.
Fig. 1.5 shows a section of a counting chamber with cells present, as viewed using the high power of a light microscope.
The depth of the counting chamber is .
The scientists counted the number of cells in several sections of a counting chamber.
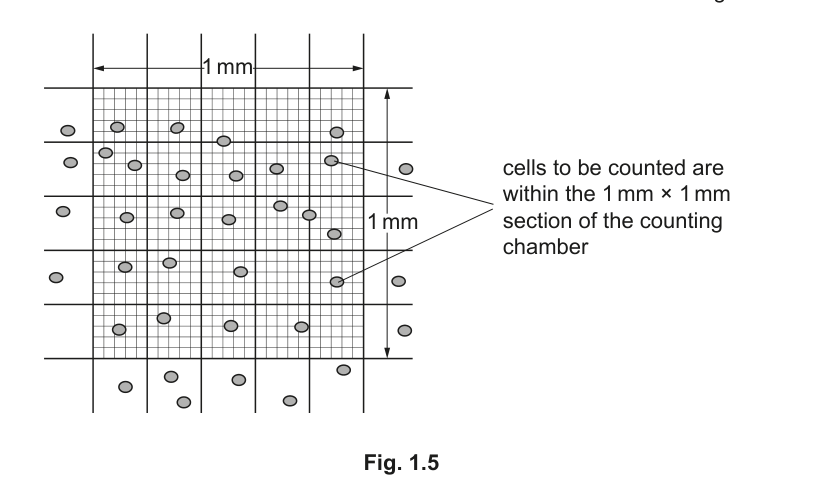
Count the number of cells in the section of the counting chamber shown in Fig. 1.5.
Use your answer to calculate the number of cells per of the suspension.
Show all your working.
number of cells per of suspension = ______
The scientists decided that using the Secchi stick was a less accurate method for determining the number of cells per of suspension.
Give two reasons why using the Secchi stick is less accurate than using a counting chamber.
The rest of this paper
1 more questions- Q2Planning · Analysis, Conclusions and Evaluation10M