Biology 9700/52 — May/June 2023
Cambridge A-Level · Planning, Analysis and Evaluation · worked solutions for every part, with the mark scheme
Topics Planning · Analysis, Conclusions and Evaluation
Polyphenol oxidase is an enzyme involved in the browning of fruit.
Fig. 1.1 shows browning of the skin of bananas.
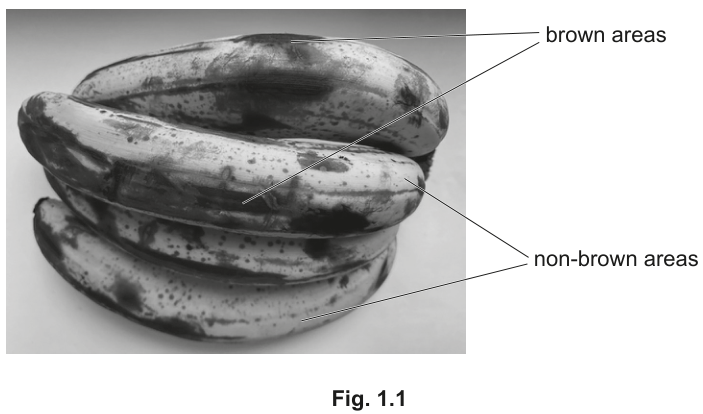
A student extracted polyphenol oxidase enzyme from ripened bananas. The student used this enzyme extract to investigate the factors affecting the activity of the enzyme.
The student initially found that the enzyme extract was too concentrated, so the student made a 1:10 dilution of the enzyme extract.
Describe how the student made a 1:10 dilution of the enzyme extract.
Answer
Mix 1 part (by volume) of enzyme extract with 9 parts (by volume) of water (or buffer).
1 part enzyme extract + 9 parts water or buffer
Background Concept
A dilution reduces the concentration of a solute in a solution. A 1 in 10 (1:10) dilution means the final solution has one-tenth of the original concentration. To achieve this, 1 part of the concentrate is combined with 9 parts of diluent (water or buffer), giving a total of 10 parts.
Understanding the Question
The student's enzyme extract was too concentrated for the colorimeter experiment, so a 1 in 10 dilution was prepared. The question asks for a description of how this was done.
Approach
The total of 10 parts must consist of 1 part of the original extract and 9 parts of diluent. For an enzyme, a buffer at a suitable pH is preferable to plain water because it preserves the enzyme's tertiary structure and active-site ionisation state.
Step-by-Step Reasoning
- Choose the diluent: for an enzyme, a buffer (e.g. at pH 7) is preferred over water.
- Measure 1 part of enzyme extract (e.g. ).
- Measure 9 parts of diluent (e.g. of buffer or water).
- Combine the two and mix thoroughly.
- The total volume is 10 parts, of which only 1 part is the original extract, so the concentration of enzyme is one-tenth of the original.
Key Takeaways
- A 1:10 dilution = 1 part + 9 parts diluent
- Buffer is preferred over water when diluting an enzyme
- Mix thoroughly so the concentration is uniform
Common Mistakes
- Writing '1 part to 10 parts' (this is a 1:11 dilution, not 1:10)
- Forgetting to mix
- Using a diluent that denatures the enzyme
Things to Be Careful About
- Use buffer (at a pH that keeps the enzyme stable) rather than plain water when the enzyme's stability is pH-sensitive
- Use clean glassware to avoid contamination
- Measure volumes accurately so the dilution factor is exactly 10
The student studied the effect of pH on the activity of polyphenol oxidase enzyme.
Dopamine hydrochloride solution was used as a substrate for the enzyme. The product of this reaction is red in colour.
A colorimeter can be used to follow the progress of this enzyme-catalysed reaction.
The student set up:
- 7 colorimeter tubes containing a solution of the substrate, dopamine hydrochloride
- 6 colorimeter tubes containing diluted polyphenol oxidase extract, each in a different buffered solution: pH 3.0, pH 4.0, pH 5.0, pH 6.0, pH 7.0, pH 8.0
- 1 colorimeter tube containing water in pH 7.0 buffer.
The colorimeter tubes were equilibrated at a set temperature.
A colorimeter was set up with a filter transmitting light at .
At time 0 seconds, the substrate solution and the polyphenol oxidase solution at pH 3.0 were mixed in one colorimeter tube. The colorimeter tube was then immediately put into the colorimeter.
The absorbance was measured at 15 second intervals over the first three minutes of the reaction.
The procedure was repeated for the remaining buffered solutions and the water at pH 7.0.
Identify the independent variable in this experiment.
Answer
pH (of the buffered enzyme solution).
pH
Background Concept
The independent variable (IV) is the factor that the experimenter deliberately changes to test its effect on the dependent variable. All other relevant factors are kept constant so that any change in the dependent variable can be attributed to the IV.
Understanding the Question
The student set up 6 tubes of buffered enzyme, each at a different pH (3.0, 4.0, 5.0, 6.0, 7.0, 8.0), and measured the absorbance of the red product over time. The factor that is deliberately varied across the tubes is the independent variable.
Approach
Look at what is different between the tubes. The substrate, enzyme, temperature, wavelength and timing are all the same — only the pH changes. So pH is the independent variable.
Step-by-Step Reasoning
- Six enzyme tubes are prepared, identical except that each is in a different pH buffer.
- The substrate, enzyme concentration, temperature, wavelength and timing are all held constant.
- The factor that differs between the tubes — pH — is the independent variable.
- The absorbance reading is the dependent variable, and the rate of change of absorbance is what the student is comparing across pH values.
Key Takeaways
- IV = what the experimenter changes
- DV = what the experimenter measures
- Controlled variables = everything kept the same
Common Mistakes
- Confusing the IV with a controlled variable (e.g. saying 'temperature' when temperature was kept the same)
- Giving a vague answer like 'pH level' — the mark scheme accepts just 'pH'
Identify one variable that the student has standardised.
Answer
Any one from:
- temperature of the solutions / tubes
- wavelength of the light / filter ()
- concentration of enzyme / polyphenol oxidase
- length of the time intervals / total time.
temperature (of the solutions / tubes)
Background Concept
Controlled (standardised) variables are factors that are deliberately kept the same throughout an experiment. They are essential because they make the comparison fair: if a controlled variable is allowed to vary, the results cannot be attributed unambiguously to the independent variable.
Understanding the Question
The student has set up tubes containing substrate, enzyme in different pH buffers, and a water blank. The stem mentions several factors that are kept the same: the tubes are equilibrated at a set temperature, the colorimeter is set with a 470 nm filter, the same diluted enzyme extract is used, and absorbances are read at 15-second intervals for 3 minutes. One of these is needed as the answer.
Approach
Identify any factor that is held constant across every tube. The mark scheme accepts any one of: temperature, wavelength/filter, enzyme concentration, or time interval/total time.
Step-by-Step Reasoning
- The stem says 'The colorimeter tubes were equilibrated at a set temperature' — so temperature is controlled.
- The stem says 'A colorimeter was set up with a filter transmitting light at ' — so wavelength is controlled.
- The same diluted enzyme extract is used in every enzyme tube — so enzyme concentration is controlled.
- Absorbance is read every for in every tube — so the time interval and total time are controlled.
Any one of these earns the mark.
Key Takeaways
- A controlled variable should be named precisely (e.g. 'temperature', not 'conditions')
- Temperature, pH and substrate/enzyme concentration are the most commonly standardised variables in enzyme experiments
- A controlled variable is not the same as the independent variable
Common Mistakes
- Stating pH as a controlled variable — pH is the independent variable in this experiment, not a controlled one
- Vague answers like 'amount of substrate' without specifying what is held constant
The student then plotted a graph of the results, showing the increase in absorbance. Absorbance is measured in absorbance units (au).
Fig. 1.2 shows the results for the increase in absorbance at pH 5.0.
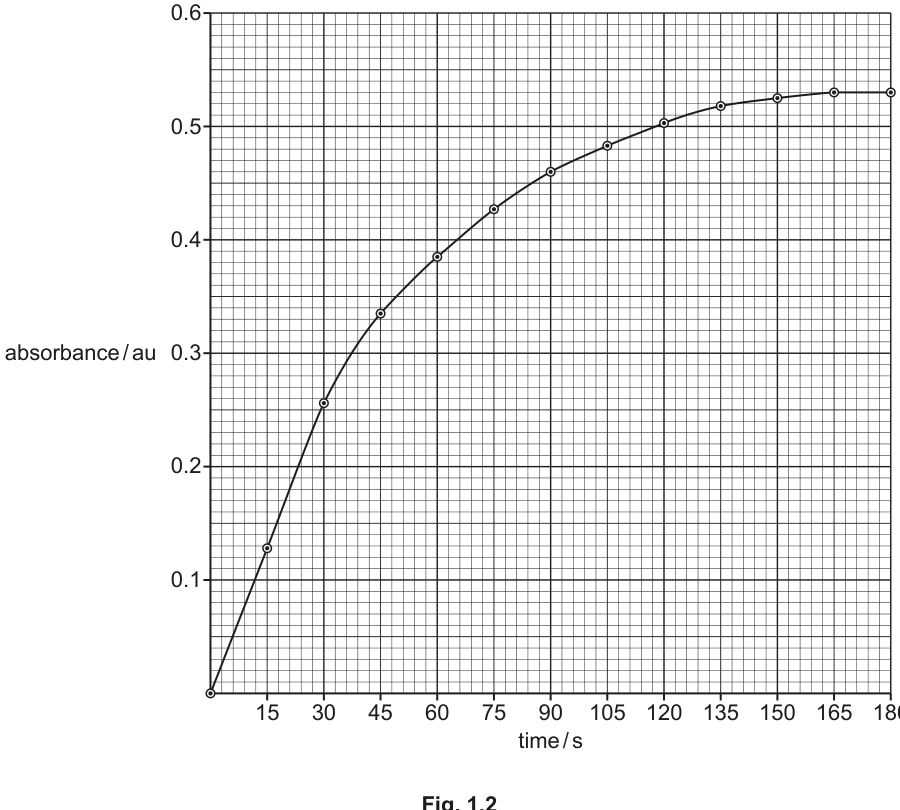
Use Fig. 1.2 to calculate the initial rate of this reaction in absorbance units per second ().
Show your working.
initial rate of reaction = ______
Working
From Fig. 1.2, at the absorbance is .
Answer
0.0087 au s⁻¹
Background Concept
The initial rate of an enzyme-catalysed reaction is the rate at the very start of the reaction, when substrate concentration is essentially at its starting value and product concentration is still low. On an absorbance vs time graph, the initial rate is the gradient of the steepest, linear portion of the curve at the start — either read off as the gradient of a tangent at , or estimated as the gradient from the origin to the first data point.
Understanding the Question
Fig. 1.2 shows the absorbance of the red product of the dopamine + polyphenol oxidase reaction at pH 5.0 over 3 minutes. The student must calculate the initial rate of the reaction from this graph.
Approach
Either draw a tangent at the origin and calculate its gradient, or read the absorbance at a very early time point (e.g. 30 s) and divide by that time. The mark scheme accepts either, with the result falling in the range to .
Step-by-Step Reasoning
- From the printed curve in Fig. 1.2, at the absorbance is .
- The initial rate is the gradient of the curve at . A reasonable estimate is the gradient from the origin to this first readable point:
- Calculate:
- Rounded to 2 significant figures: , which lies inside the accepted range –.
Key Takeaways
- Initial rate = gradient of the first (steepest, linear) part of the curve
- A quick estimate uses the first data point divided by its time; a tangent at is more accurate
- Always quote the unit
Common Mistakes
- Reading a value at the wrong time (e.g. or later, where the curve is already flattening) — this gives a smaller gradient
- Forgetting the units
- Using the plateau value (e.g. ) which is the maximum absorbance, not the initial slope
Things to Be Careful About
- Use the value printed on the curve (at or below at ) — the mark scheme allows any value in that range
- Quote the answer to 2 or 3 significant figures, not 1
- Make sure the gradient is the initial gradient, not the gradient at the plateau
Using the internet, the student found that pH 7.0 is the optimum pH for polyphenol oxidase.
On Fig. 1.2, sketch the line you would expect to get for the rate of reaction at pH 3.0.
Answer
On Fig. 1.2, sketch a line that:
- starts at the origin (0, 0),
- lies below the printed pH 5.0 line at every time point,
- is still rising at (has not yet plateaued).
Line below the printed pH 5.0 curve, starting at the origin, still rising at 180 s
Background Concept
Enzyme activity depends on pH because the ionisation state of amino-acid side chains in the active site changes with pH. Each enzyme has an optimum pH at which the tertiary structure and active-site geometry best bind substrate. At pH values far from the optimum, the enzyme is partially denatured and activity is much reduced.
Understanding the Question
Fig. 1.2 shows absorbance vs time for the dopamine + polyphenol oxidase reaction at pH 5.0. The optimum pH for polyphenol oxidase is pH 7.0. The student must sketch the curve that would result at pH 3.0, which is 4 pH units below the optimum.
Approach
Because pH 3.0 is far below the optimum pH 7.0, the enzyme is largely inactive. The reaction proceeds much more slowly, so the absorbance rises more slowly. The reaction does still occur, so the curve still rises — it just takes much longer to plateau.
Step-by-Step Reasoning
- pH 7.0 is the optimum. pH 3.0 is far below it, so the enzyme is largely inactive and the initial rate is much lower than at pH 5.0.
- The curve at every time point should be below the printed pH 5.0 curve.
- The reaction does still occur, so the absorbance increases with time and the line still starts at the origin.
- Because the rate is so much lower, the reaction will not have reached its plateau in 3 minutes — the line should still be rising at .
Key Takeaways
- pH far from the optimum → much lower rate
- The curve has a shallower initial gradient and a lower plateau, reached later
- The line still starts at the origin and still rises
Common Mistakes
- Drawing a horizontal line at zero (no reaction at all) — some reaction still occurs
- Drawing a curve that plateaus within 180 s (too fast)
- Drawing the curve above the printed line (incorrect direction)
Things to Be Careful About
- The line must start at the origin (no product present at )
- The line must be below the printed curve at every time point
- The line should be smooth and continuous, similar in form to the printed curve
The student wanted to determine the effect of the concentration of the substrate, dopamine hydrochloride solution, on the rate of the enzyme-catalysed reaction.
The student was provided with a stock solution of 0.2% dopamine hydrochloride solution and the diluted enzyme extract prepared in (a).
Describe a method the student could use to collect the data that is needed to determine the effect of the concentration of dopamine hydrochloride solution on the rate of the enzyme-catalysed reaction.
Your method should be set out in a logical order and be detailed enough to let another person follow it.
Dilutions
- Prepare at least 5 different concentrations of dopamine hydrochloride spanning 0.0–0.2% (e.g. 0.04, 0.08, 0.12, 0.16, 0.20%).
- Use a serial dilution: add of 0.20% stock to of water and mix, then add of this to of water, and so on, to obtain a series of dilutions.
Equilibration
- Place a colorimeter tube containing of each substrate concentration into a water bath at a set constant temperature (e.g. ). Place a separate tube containing of the buffered (pH 7.0) enzyme extract in the same water bath. Leave for 5 minutes to equilibrate.
Variables kept constant
- Use the same volume of substrate () and enzyme () in every tube; use the same pH 7.0 buffer for the enzyme; use the same filter in the colorimeter; use the same temperature for every tube; use the same diluted enzyme extract throughout.
Procedure
- Calibrate the colorimeter to zero absorbance using a blank of water (or buffer) at at the start of the experiment (and re-zero between readings if necessary).
- Add of buffered enzyme to of substrate in the equilibrated colorimeter tube. Start a stopwatch immediately and place the tube in the colorimeter.
- Record the absorbance at intervals for . Repeat for each substrate concentration.
Replicates and rate
- Repeat the whole procedure 3 times for each concentration (3 replicates) and calculate a mean absorbance at each time point.
- Plot mean absorbance against time for each substrate concentration and calculate the initial rate (gradient of the initial linear portion) for each concentration.
Control
- Repeat one tube using boiled (denatured) enzyme in place of active enzyme to confirm that any change in absorbance is due to the enzyme-catalysed reaction.
Safety
- Dopamine hydrochloride is toxic if ingested and an irritant/allergen to skin and eyes — wear gloves and goggles, do not eat or drink in the lab, wash hands after the experiment, and dispose of solutions in the labelled waste container (not down the sink).
Method using ≥5 substrate concentrations, serial dilution, separate water-bath equilibration, standardised variables, calibrated colorimeter, absorbance at 15 s intervals for 3 min, 3 replicates with mean, calculation of initial rate, boiled-enzyme control, and PPE for toxic dopamine hydrochloride.
Background Concept
The rate of an enzyme-catalysed reaction depends on the substrate concentration. As substrate concentration rises, the rate rises (more enzyme active sites occupied) up to a maximum, , at which all sites are saturated. To investigate this, the experimenter varies the substrate concentration (independent variable), measures the rate (dependent variable), and keeps everything else (enzyme concentration, pH, temperature, wavelength, timing) constant.
A colorimeter measures the absorbance of light at a chosen wavelength by a coloured solution. The product of polyphenol oxidase acting on dopamine is red, and its absorbance at is proportional to its concentration. The rate of increase of absorbance is therefore proportional to the rate of product formation.
Understanding the Question
The student has % dopamine hydrochloride stock and the diluted enzyme extract prepared in (a). They need a method, detailed enough for another person to follow, that will collect the data needed to determine the effect of substrate concentration on the rate of the enzyme-catalysed reaction.
Approach
Plan the experiment systematically:
- IV: substrate (dopamine hydrochloride) concentration
- DV: rate of reaction (from absorbance vs time)
- Controlled: enzyme concentration, pH, temperature, volume of substrate and enzyme, wavelength, timing
- Procedure: serial dilution → equilibration → mix → read absorbance at intervals → repeat for each concentration with replicates → calculate rate
- Control: boiled enzyme
- Safety: dopamine hydrochloride hazard
Step-by-Step Reasoning
1. Independent variable and range
Use at least 5 different concentrations of substrate across the available range 0.0–0.2% (e.g. 0.04, 0.08, 0.12, 0.16, 0.20%). Five values is the minimum for plotting a meaningful rate-vs-concentration curve.
2. Serial dilution method
A simple way to make the dilutions is by serial dilution: take of stock and add it to of water to halve the concentration; take of this and add to of water again, and so on. The mark scheme requires at least two correct dilutions.
3. Equilibration
Before mixing, the substrate and the enzyme must each be at the same temperature. Putting them in a water bath at, say, for 5 minutes ensures that mixing does not cause a temperature jump that would alter the rate. The water bath must be at a constant temperature (any value between 10 and , the range over which enzymes are active without denaturing).
4. Variables to standardise
- Volume of substrate (e.g. ) and enzyme (e.g. ) in every tube
- pH of the enzyme buffer (pH 7.0, the optimum)
- Wavelength/filter ()
- Temperature
- Time interval and total time
- Concentration of enzyme (use the same diluted extract throughout)
The mark scheme explicitly requires two standardised variables to be named.
5. Calibration
Set the colorimeter to zero absorbance using a blank tube of water (or buffer) at at the start, and re-zero between readings if the colorimeter drifts.
6. Procedure
Add the enzyme to the substrate, start timing immediately, place the tube in the colorimeter, and record the absorbance at intervals for . The reaction is fast, so a short interval is needed. Repeat for each substrate concentration.
7. Replicates and rate
Carry out 3 replicates for each concentration and calculate a mean absorbance at each time point. Then plot mean absorbance against time for each concentration and find the initial rate from the gradient of the initial linear part of the curve (or a tangent at ).
8. Control
A control with boiled (denatured) enzyme should show no change in absorbance, confirming that the colour change is enzyme-catalysed.
9. Safety
Dopamine hydrochloride is toxic if ingested and is an irritant/allergen to skin and eyes. Wear gloves and goggles, do not eat or drink in the lab, wash hands afterwards, and dispose of waste in the labelled container, not down the sink.
Key Takeaways
- A well-designed enzyme experiment clearly identifies the IV, DV and the controlled variables
- Substrate and enzyme must be equilibrated separately before mixing
- The colorimeter must be zeroed with a blank at the chosen wavelength
- Initial rate is the gradient of the first (linear) part of the absorbance vs time curve
- Replicates and a control are essential for valid conclusions
- Hazards must be identified with both a risk and a precaution
Common Mistakes
- Mixing the enzyme and substrate at room temperature, then trying to use a water bath afterwards (the rate has already been affected by the temperature jump)
- Using only one concentration of substrate (no curve possible)
- Not standardising the pH (the optimum pH should be used so that any change in rate is attributable to substrate concentration, not pH)
- Vague safety statements like 'be careful' instead of naming the hazard, the risk and the precaution
- Forgetting to include a control
Things to Be Careful About
- Use the same volume of substrate and enzyme in every tube (the mark scheme explicitly requires standardising volumes)
- Use the optimum pH so that the rate reflects the substrate concentration, not partial denaturation
- Keep the colorimeter filter constant ()
- Present the plan in a clear sequence: dilutions → equilibration → mix → read → repeat → calculate rate
The browning of fruit such as bananas can make them more difficult to sell. One way to prevent browning of bananas is to use an anti-browning agent.
The student searched the internet and found data from different scientific papers on the inhibitory effect of various anti-browning agents on polyphenol oxidase from different plants.
The student processed and ranked these data, as shown in Table 1.1.
Table 1.1
| anti-browning agent | percentage of maximum activity of polyphenol oxidase | plant source of polyphenol oxidase |
|---|---|---|
| heated onion extract | 17.0 | potato |
| fresh onion extract | 44.4 | potato |
| ascorbic acid | 60.0 | sorrel |
| L-cysteine | 70.0 | sorrel |
| potassium sorbate | 76.8 | potato |
| citric acid | 80.4 | potato |
| EDTA | 88.0 | red poppy |
| no anti-browning agent (control) | 100.0 | potato |
The student concluded that heated onion extract was the most effective anti-browning agent and that EDTA was the least effective.
Use the information to suggest why this conclusion may not be supported.
Answer
- The polyphenol oxidase used in the different studies came from different plant sources (potato, sorrel, red poppy). The enzyme's amino-acid sequence and 3D structure differ between species, so inhibitors may bind with different strengths. The data are therefore not directly comparable.
- There is no information about the conditions under which each measurement was made (pH, temperature, substrate concentration, inhibitor concentration, incubation time). Without these being standardised, the percentages of activity cannot be meaningfully compared.
(Any two of the following also earn marks: no statistical test; no information on the substrate used; not known whether the inhibitor is competitive or non-competitive in each case; an anti-browning agent may have been more or less effective if tested on a different enzyme source.)
The enzyme came from different plant sources and the experimental conditions were not standardised, so the data cannot be compared and the conclusion is not supported.
Background Concept
A valid scientific conclusion must be supported by data collected under controlled, comparable conditions. When data are pooled from multiple published studies, the validity of the comparison depends on:
- The same biological material being tested in every study (same enzyme source, same substrate, same inhibitor concentration).
- The same experimental conditions (pH, temperature, timing, replicates).
- An appropriate statistical test to support any claim of a difference.
Understanding the Question
Table 1.1 lists the percentage of maximum activity of polyphenol oxidase remaining after treatment with various anti-browning agents, along with the plant source of the enzyme. The student has concluded that heated onion extract is the most effective anti-browning agent and EDTA the least effective. The question asks why this conclusion may not be supported.
Approach
Look for reasons the data in the table cannot legitimately be compared. The strongest criticisms are:
- The enzyme sources differ (different proteins, different sensitivities to inhibitors).
- The conditions under which each measurement was made are not given and may differ.
- No statistical analysis is reported.
Step-by-Step Reasoning
- The enzyme source is different for every entry except the control (which is potato). Potato, sorrel and red poppy are different species with different polyphenol oxidase amino-acid sequences and therefore different sensitivities to inhibitors. Heated onion extract may be particularly effective against the potato enzyme but not against the sorrel or red poppy enzyme.
- There is no information about pH, temperature, substrate concentration, inhibitor concentration or incubation time. If these differed between studies, the percentages of remaining activity are not directly comparable. For example, the experiment with ascorbic acid (% activity, sorrel) and the one with L-cysteine (% activity, sorrel) could have used different pH values that affect inhibition.
- No statistical test (e.g. t-test, error bars, confidence intervals) is reported, so the apparent ranking is not supported by evidence of significance — the differences might be due to random variation.
Key Takeaways
- Data from different studies can only be compared if the conditions and biological material are the same
- A table of single percentages from different sources is a weak basis for a ranking
- Conclusions should be supported by statistical evidence, not just by a single number per condition
Common Mistakes
- Saying 'the data are unreliable' without giving a specific reason
- Suggesting only one issue rather than the strongest two
- Focusing on the units/apparatus rather than the experimental design
Things to Be Careful About
- The question is about validity of the conclusion, not about the design of the anti-browning agents themselves
- 'The data come from different sources' must be backed by a specific reason (different enzyme source / no standardised conditions / no statistics)
The student found that a sulfur-containing molecule in the heated onion extract acted as a non-competitive inhibitor to the enzyme polyphenol oxidase.
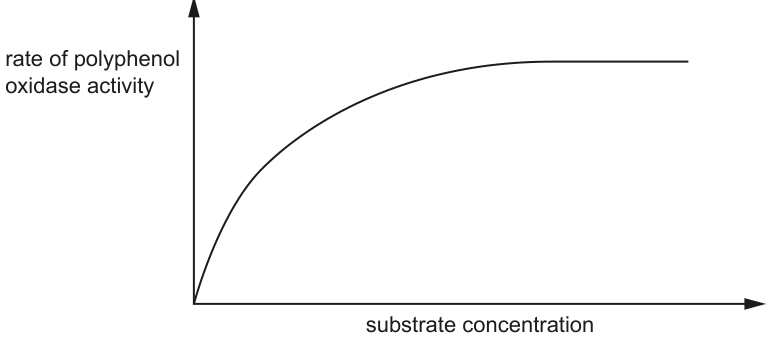
Fig. 1.3 is a graph showing how the substrate concentration affects the rate of polyphenol oxidase activity.
On Fig. 1.3 sketch the curve that shows the rate of activity for polyphenol oxidase treated with the heated onion extract.
Answer
On Fig. 1.3, sketch a curve that:
- starts at the origin (0, 0),
- rises and then levels off (plateaus),
- has a lower plateau than the printed uninhibited curve, i.e. a lower .
Curve starting at the origin, plateauing at a lower Vmax than the original curve.
Background Concept
A non-competitive inhibitor binds to a site on the enzyme that is different from the active site (an allosteric site). It does not compete with the substrate for the active site, so increasing the substrate concentration does not overcome the inhibition. The consequences are:
- The maximum rate of reaction () is reduced (because some enzyme molecules are permanently inactive, even at very high substrate concentration).
- The substrate concentration at which the rate is half () is unchanged (the enzyme that is still functional has the same affinity for substrate).
On a rate vs substrate concentration graph, the curve therefore plateaus at a lower value than the uninhibited curve, while the initial rise is similar.
Understanding the Question
Fig. 1.3 shows the rate of polyphenol oxidase activity vs substrate concentration for the uninhibited enzyme. The student has found that the sulfur-containing molecule in heated onion extract is a non-competitive inhibitor. The student must sketch the curve that would result in the presence of this inhibitor.
Approach
For a non-competitive inhibitor, the new curve should:
- Start at the origin (no substrate → no reaction).
- Have a similar initial slope to the uninhibited curve ( is unchanged).
- Plateau at a lower than the printed curve (because some enzyme is permanently non-functional).
Step-by-Step Reasoning
- At zero substrate concentration the rate is zero in both cases — both curves start at the origin.
- As substrate is added, the initial rise of the inhibited curve is similar to the uninhibited curve ( is unchanged in non-competitive inhibition).
- At high substrate concentration, the inhibited curve levels off at a lower plateau than the uninhibited curve because the inhibitor has permanently removed some enzyme molecules from the active pool, lowering .
Key Takeaways
- Non-competitive inhibitor → lower , same
- Competitive inhibitor → same , higher
- Both curves start at the origin
Common Mistakes
- Drawing a curve that plateaus at the same as the original (this would be no effect, or a competitive inhibitor at very high substrate)
- Drawing a curve with a much shallower initial slope (this is a competitive inhibitor)
- Drawing a curve that does not level off (the rate must plateau as substrate saturates the remaining active enzyme)
Things to Be Careful About
- The new curve must clearly level off (plateau)
- The plateau must be lower than the original
- The new curve should start at the origin
The rest of this paper
1 more questions- Q2Planning · Analysis, Conclusions and Evaluation14M