Biology 9700/51 — May/June 2023
Cambridge A-Level · Planning, Analysis and Evaluation · worked solutions for every part, with the mark scheme
Topics Planning · Analysis, Conclusions and Evaluation
Catalase is an enzyme that is found in many plant cells and animal cells. Catalase breaks down hydrogen peroxide, which is a waste product from cell metabolism.
Fig. 1.1 shows the breakdown of hydrogen peroxide by catalase.

A student decided to investigate how catalase activity varies along the length of a carrot root.
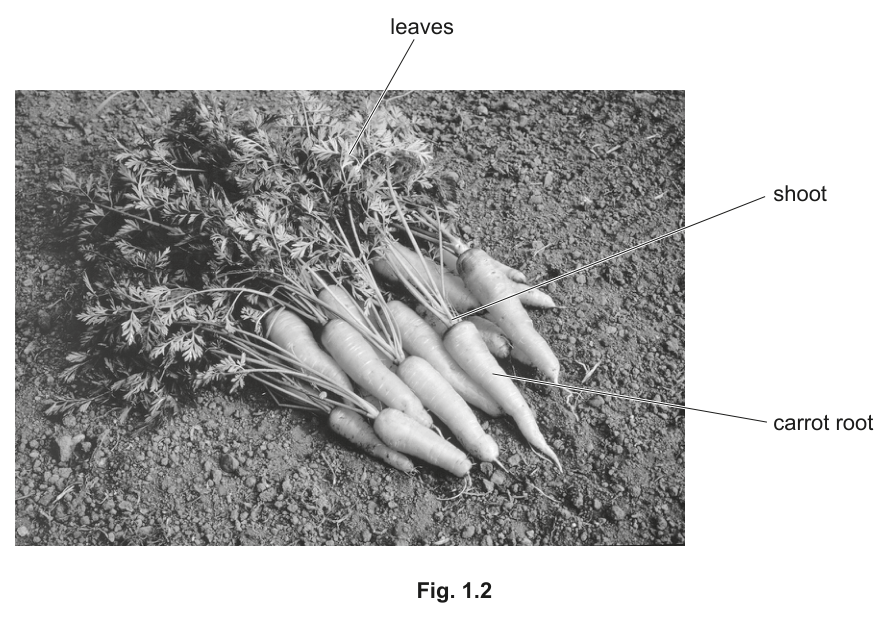
Fig. 1.2 shows a photograph of some carrots.
The student extracted catalase from different parts of the carrot root tissue.
- Carrot root tissue was mixed with a small volume of pH7 buffer and some fine sand.
- The mixture was ground with a pestle and mortar.
- The mixture was placed into a centrifuge tube and spun in a variable speed centrifuge for a few minutes.
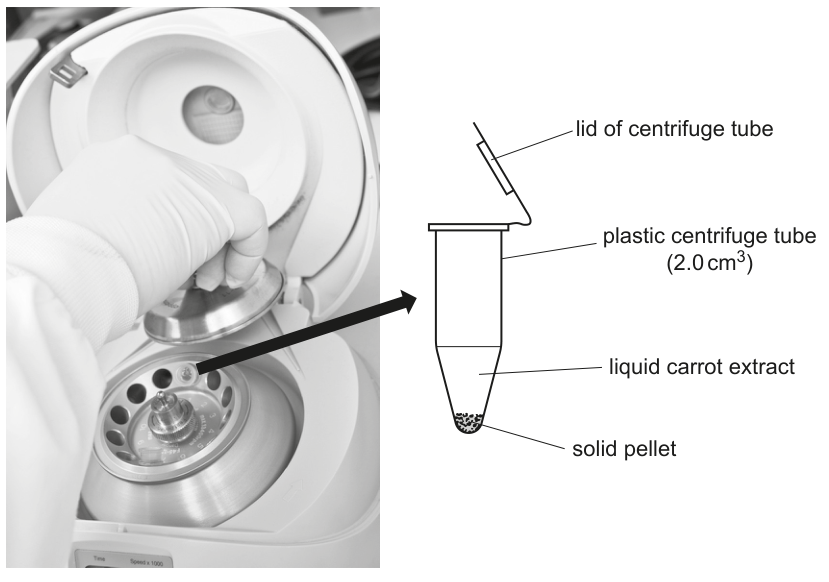
- This caused the mixture to be separated into a solid pellet at the bottom of the centrifuge tube and a liquid carrot extract at the top, as shown in Fig. 1.3.
- The liquid carrot extract was poured into a clean test-tube. This liquid contained catalase.
Fig. 1.3 shows a centrifuge and centrifuge tube with its contents, after spinning in the centrifuge for a few minutes.
State one variable that should be standardised in the procedure to obtain the liquid carrot extract, other than the carrot tissue, fine sand and apparatus used.
The student carried out these steps to investigate the activity of catalase in the different samples of carrot root tissue.
- A disc of filter paper of diameter was dipped into the liquid carrot extract using forceps.
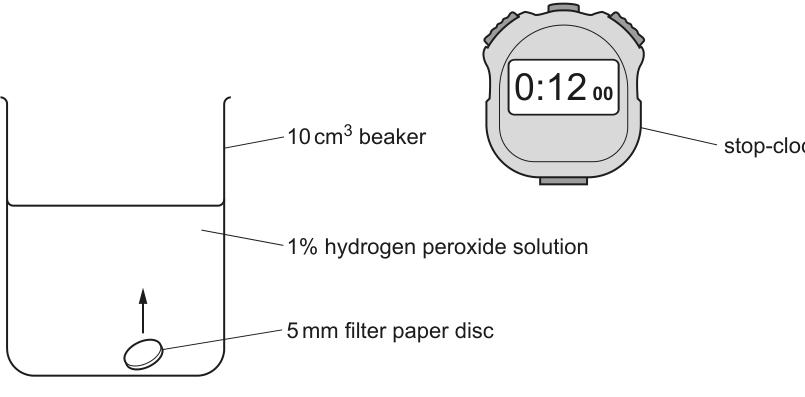
- The filter paper disc was placed at the bottom of a beaker of hydrogen peroxide solution using forceps.
- The time taken for the filter paper disc to rise to the surface of the hydrogen peroxide solution was measured.
Fig. 1.4 shows the apparatus used to measure the time taken for the filter paper disc to rise.
State the relationship between the time taken for the filter paper disc to rise to the surface of the hydrogen peroxide solution and the catalase activity of the liquid carrot extract.
The student decided to investigate how catalase activity varies along the length of a carrot root.
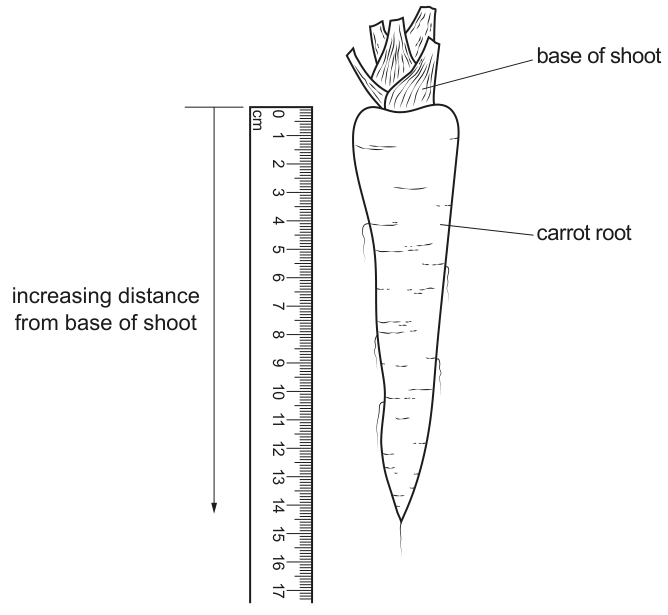
Fig. 1.5 shows a carrot.
The student made the prediction:
As the distance from the base of the shoot increases, the catalase activity of carrot root tissue increases.
Identify the independent variable in this investigation.
Describe a method that the student could use to test the prediction that:
As the distance from the base of the shoot increases, the catalase activity of carrot root tissue increases.
Your method should be set out in a logical order and be detailed enough to allow another person to follow it.
Details of how to use the centrifuge to prepare the liquid carrot extract should not be included.
In a different investigation, the student determined the effect of hydrogen peroxide concentration on the activity of catalase in yeast.
- hydrogen peroxide solution was placed in a test-tube at .
- dried yeast was added to the test-tube, so that the yeast cells formed a suspension in the hydrogen peroxide solution.
- A gas syringe was quickly connected to the test-tube using a bung and delivery tube, as shown in Fig. 1.6.
- The volume of gas collected after one minute was measured.
Fig. 1.6 shows the apparatus used by the student.
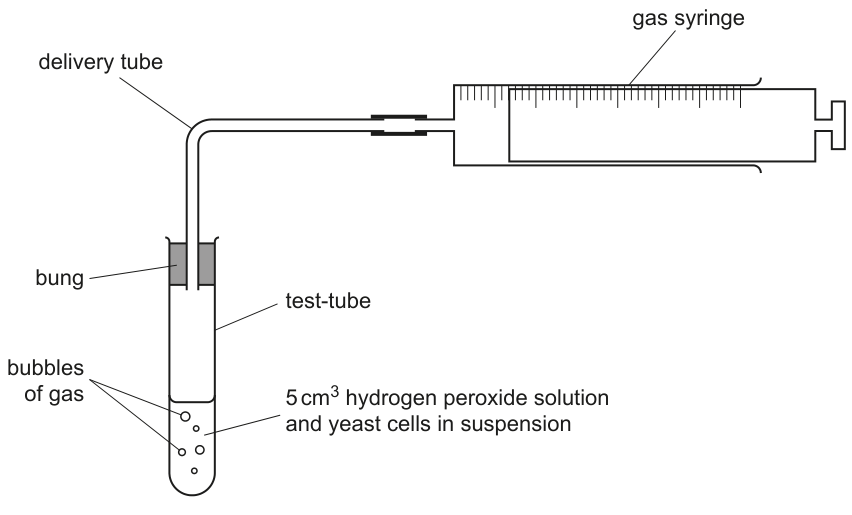
Identify the dependent variable in this investigation.
To investigate the effect of hydrogen peroxide concentration on the activity of catalase in yeast, the student first prepared a range of known concentrations of hydrogen peroxide.
The student was given a stock solution of hydrogen peroxide. The student decided to use the stock solution to make hydrogen peroxide solutions with concentrations of , , and .
The student made of each solution.
Complete Table 1.1 to show how these solutions could be made by proportional dilution of the stock solution of hydrogen peroxide.
Table 1.1
| percentage concentration of hydrogen peroxide | volume of stock solution / | volume of ______ / |
|---|---|---|
| 3.0 | ||
| 3.6 | ||
| 4.8 | ||
| 5.4 |
Use this space for your working.
Fig. 1.7 shows the results of the investigation.

The student made two conclusions:
- As the concentration of hydrogen peroxide increases, the volume of oxygen produced after one minute increases.
- The of catalase is .
Use the information shown in Fig. 1.7 to evaluate these conclusions.
The rest of this paper
1 more questions- Q2Planning · Analysis, Conclusions and Evaluation15M