Biology 9700/52 — October/November 2022
Cambridge A-Level · Planning, Analysis and Evaluation · worked solutions for every part, with the mark scheme
Topics Planning · Analysis, Conclusions and Evaluation
Egg albumen (egg white) is a good source of protein. Some eggs contain up to 10.0% w/v () protein.
A biuret assay can be used to determine the concentration of protein in egg albumen.
- Biuret reagent is a mixture of copper(II) sulfate solution and sodium hydroxide solution.
- In a biuret assay, biuret reagent is added to a solution.
- If protein is present, copper(II) ions () in the biuret reagent bind with the nitrogen atoms that form peptide bonds in the protein.
- This binding causes the reagent to change from a clear, pale blue to a purple colour.
- Different concentrations of protein result in different intensities of purple colour.
A colorimeter can be used to measure differences in the intensity of the purple colour in samples tested.
Fig. 1.1 shows a colorimeter that measures the absorbance of light when it passes through different coloured solutions.
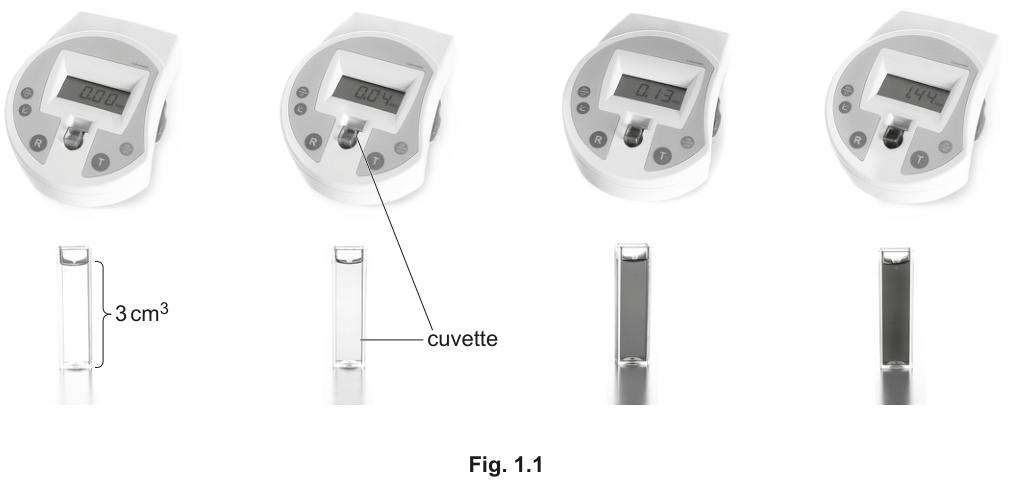
Outline how a colorimeter is set up so that a test cuvette can be placed in the slot to obtain a correct measurement of intensity of a coloured solution.
A student carried out a biuret assay to determine the concentration of protein in egg albumen from eggs produced by a chicken that had been fed on a new type of chicken feed. The eggs produced by the chicken before eating the new feed contained 6.0% w/v of protein in the egg albumen.
Egg albumen is diluted to obtain a concentration that is suitable for testing in the biuret assay. For example, egg albumen with 6.0% w/v protein is diluted by a factor of 10 to obtain a 0.6% w/v solution for a biuret assay.
To carry out the biuret assay on egg albumen of unknown protein concentration, a calibration curve needs to be produced. This involves using standard solutions of known concentrations of protein.
The range of concentrations that can be measured using a colorimeter in a biuret assay is 0.1 – 1.0% w/v.
A stock solution of 1.0% w/v protein can be diluted using distilled water to prepare the standard solutions of protein.
Describe how the student could prepare a 0.1% solution of protein using the stock solution.
Construct a table to show how the dilution is made for the 0.1% solution and for other concentrations the student could use to produce a calibration curve for the biuret assay.
Space for table.
Identify the independent variable and dependent variable for the preparation of the calibration curve.
independent variable ______
dependent variable ______
Complete Fig. 1.2 by labelling the axes and sketching the expected calibration curve.

The biuret assay assumes that if the same intensity of colour in the biuret test is obtained with the test sample and a protein standard, then the protein concentration is the same, even though they are different proteins. This is summarised in Fig. 1.3.
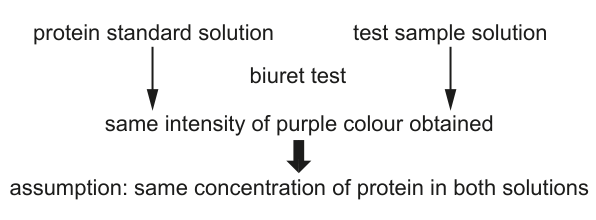
Use the information on the biuret test given on page 2 to explain why different proteins of the same concentration will result in the same intensity of purple colour in the biuret test.
Describe how the student would:
- use the standard protein concentrations prepared in (b)(i) to obtain a calibration curve
- determine the concentration of protein in the egg albumen from eggs of chickens fed on the new chicken feed.
Do not repeat any detail given in (a) of how to use the colorimeter or in (b)(i) of how the standard protein solutions would be prepared.
Your method should be set out in a logical way and be detailed enough to let another person follow it.
The rest of this paper
1 more questions- Q2Planning · Analysis, Conclusions and Evaluation15M