Biology 9700/52 — May/June 2022
Cambridge A-Level · Planning, Analysis and Evaluation · worked solutions for every part, with the mark scheme
Topics Planning · Analysis, Conclusions and Evaluation
Fig. 1.1 A shows the root vegetable beetroot, Beta vulgaris.
Fig. 1.1 B shows a single cell from the beetroot tissue. The vacuole contains the red pigment, betalain.
The pigment molecules are too large to diffuse out of the vacuole.
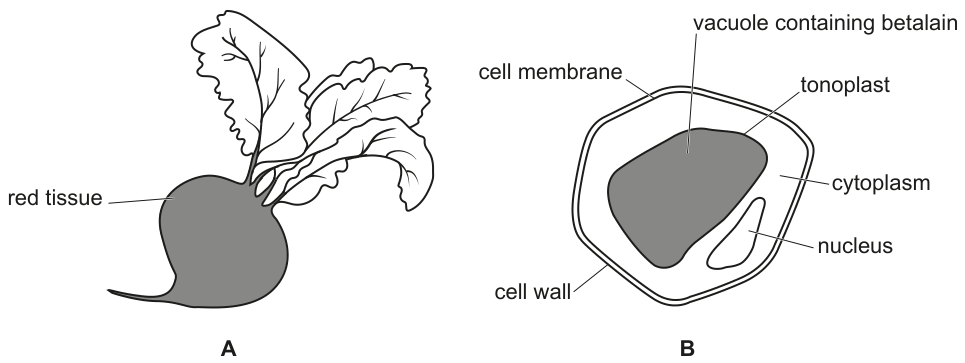
When pieces of beetroot are soaked in a solution of calcium hypochlorite, , the beetroot tissue changes from red to white. This is caused by the calcium hypochlorite diffusing into the beetroot cell vacuoles and decolourising the betalain pigment.
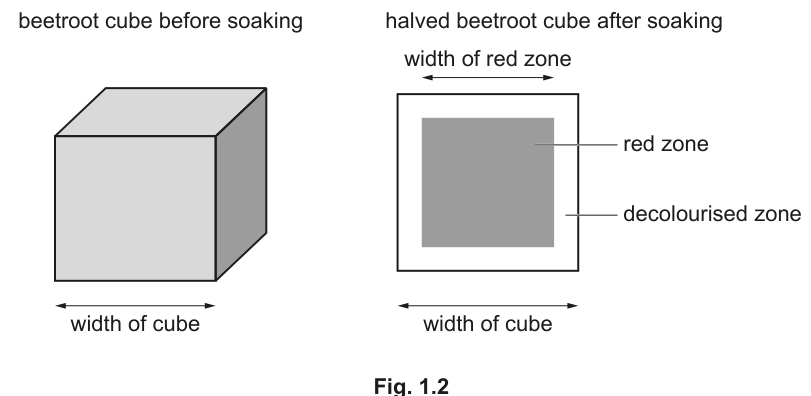
Fig. 1.2 shows a cube of beetroot before soaking in the solution of calcium hypochlorite and the halved cube of beetroot after soaking in the solution of calcium hypochlorite.
In a class experiment:
- Cubes of beetroot of different dimensions were placed in a beaker containing a 10% solution of calcium hypochlorite.
- The cubes were left for 30 minutes.
- The cubes were then cut in half, and the width of the tissue remaining red (the red zone) was measured.
A group of students investigated the effect of changing the surface area:volume ratio on the diffusion of calcium hypochlorite into beetroot cubes. The students used cubes of different sizes and measured the width of the red zone after soaking the beetroot in calcium hypochlorite.
The students suggested the hypothesis:
The width of red tissue remaining in the beetroot after soaking in calcium hypochlorite is inversely proportional to the surface area:volume ratio of the beetroot cubes.
Identify the dependent variable in this investigation.
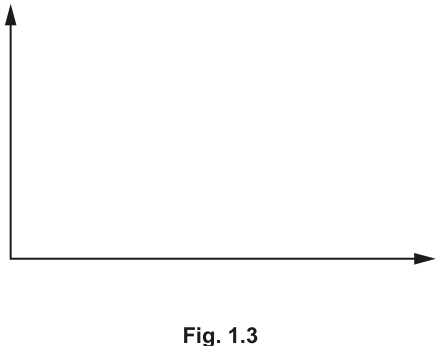
Sketch a curve on Fig. 1.3 to show how you expect the width of red tissue to change as the surface area:volume ratio changes if the hypothesis is correct.
Label the axes.
Describe a method the students could use to collect the data needed to test their hypothesis.
The students were provided with beetroot tissue, a 10% calcium hypochlorite solution and standard laboratory equipment.
Your method should be set out in a logical order and be detailed enough to let another person follow it.
The students decided to calculate the percentage change in volume of the red tissue in each cube.
State how the students could calculate the percentage change in volume of the red tissue in each cube.
In a further experiment the students investigated the effect of temperature on the release of betalain pigments from beetroot tissue.
- Cubes of beetroot were cut.
- Beakers containing water were prepared.
- The beakers were placed in water-baths at temperatures between 0°C and 85°C.
- The beakers were allowed to equilibrate for 5 minutes.
- The beetroot cubes were added to the beakers.
- After 30 minutes the beetroot cubes were removed.
- Colorimeters, each with a blue-green filter, were used to measure the percentage transmission of light through the fluid remaining in each beaker.
The results of this experiment are shown in Table 1.1.
Table 1.1
| temperature / °C | percentage transmission of light | ||||
|---|---|---|---|---|---|
| student 1 | student 2 | student 3 | student 4 | mean | |
| 5 | 100 | 97 | 98 | 96 | 97.8 |
| 25 | 83 | 92 | 96 | 86 | |
| 45 | 82 | 73 | 68 | 71 | 70.7 |
| 65 | 26 | 31 | 29 | 17 | 28.7 |
| 85 | 1 | 2 | 1 | 1 | 1.3 |
The students decided that two of their results are anomalous. One of the results that they considered anomalous is circled in Table 1.1.
Circle the other anomalous result and complete Table 1.1 by calculating the mean percentage transmission of light at 25°C.
Describe two ways in which the method described in (c) could have been improved to give better repeatability between the results of the different students.
With reference to the data in Table 1.1, state and explain the effect that increasing temperature has on the release of betalain from beetroot tissue.
The rest of this paper
1 more questions- Q2Planning · Analysis, Conclusions and Evaluation12M