Biology 9700/51 — May/June 2022
Cambridge A-Level · Planning, Analysis and Evaluation · worked solutions for every part, with the mark scheme
Topics Planning · Analysis, Conclusions and Evaluation
A group of students investigated two habitats: dense woodland and open grassland.
• Trees are the dominant plants in woodland. The trees form a canopy under which flowering herbs, small shrubs and grasses grow.
• Grasses are the dominant plants in grassland. The grasses and small flowering plants form a continuous ground cover with only a few small shrubs present.
Fig. 1.1 shows photographs of the two areas.
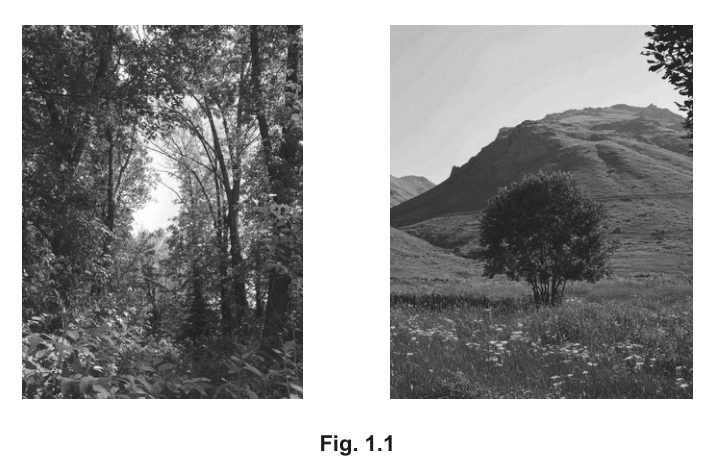
Fig. 1.1
The students decided to compare the adaptations for reducing water loss in the plants growing in each area.
The students suggested the following hypothesis:
The density of stomata will be higher in plants found in the woodland habitat than in the grassland habitat.
State the independent and dependent variables in this investigation.
independent variable = ______
dependent variable = ______
The students collected leaves from a number of different plant species in each area. To study the density of stomata on leaves, impressions of the epidermis can be made using clear varnish.
• One surface of each leaf is painted with a thin layer of varnish.
• The varnish is left to dry.
• Clear sticky tape is applied to the leaf over the varnished area, to make a leaf impression.
• The tape and varnish are removed and stuck to a microscope slide.
• The leaf impression on the slide is viewed using a microscope.
Fig. 1.2 shows the microscope image of one leaf impression prepared in this way.
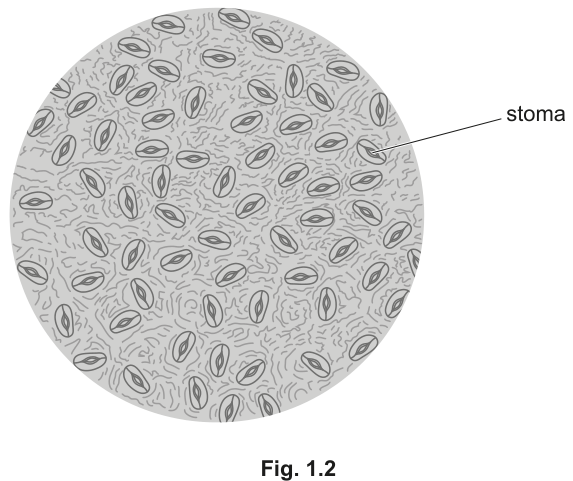
Fig. 1.2
State the measurements that the students need to make to determine the stomatal density in Fig. 1.2.
Calculate the stomatal density in Fig. 1.2.
Space for working.
stomatal density = ______
Describe how the students could gather data to compare the stomatal density of plants growing in the woodland and the grassland habitat.
Your method should be set out in a logical order and be detailed enough to allow another person to follow it.
You should not repeat details of the method for making the leaf impressions.
The students found a published investigation on the effect of light intensity on stomatal density in the species Lycopersicon esculentum.
Two plants of Lycopersicon esculentum were selected. One was grown in high light intensity and the other was grown in low light intensity.
The results are shown in Table 1.1.
Table 1.1
| leaf number | high light intensity | low light intensity | ||||
|---|---|---|---|---|---|---|
| number of stomata | leaf area / | number of stomata | leaf area / | |||
| upper surface | lower surface | upper surface | lower surface | |||
| 1 | 1634 | 3131 | 496 | 18 | 1277 | 160 |
| 2 | 1482 | 5072 | 509 | 10 | 906 | 115 |
| 3 | 1865 | 6365 | 637 | 14 | 1398 | 171 |
| mean | 1660 | 4856 | 547 | 14 | 1194 | 149 |
Calculate the percentage decrease in mean leaf area for leaves grown in low light intensity compared with those grown in high light intensity.
Your answer should be expressed as a whole number.
______ %
The scientists who carried out the published investigation concluded that:
plants grown in higher light intensity have higher stomatal density only on the upper surface of the leaves compared to plants grown in lower light intensity.
Evaluate whether or not the data in Table 1.1 supports this conclusion.
The rest of this paper
1 more questions- Q2Planning · Analysis, Conclusions and Evaluation14M