Biology 9700/52 — February/March 2022
Cambridge A-Level · Planning, Analysis and Evaluation · worked solutions for every part, with the mark scheme
Topics Analysis, Conclusions and Evaluation · Planning
Some students wanted to investigate the effect of light intensity on the rate of photosynthesis in the Brazilian waterweed, Egeria densa. This plant is found in freshwater ponds.
The students used the apparatus shown in Fig. 1.1 in their investigation. A stand and clamp were used to hold the apparatus in a vertical position.
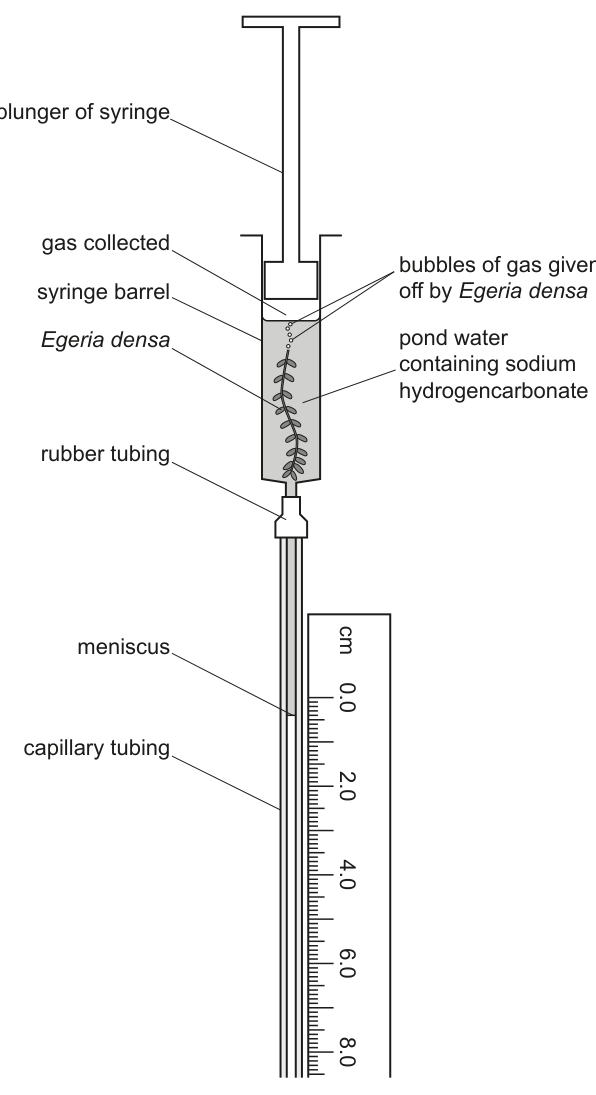
The students carried out these steps to set up the apparatus shown in Fig. 1.1.
- Some sodium hydrogencarbonate was added to a sample of pond water as a source of carbon dioxide.
- The syringe barrel was filled with the pond water containing sodium hydrogencarbonate.
- A fresh piece of E. densa was cut under water.
- The cut stem was quickly placed in the pond water in the syringe barrel.
- The plunger was replaced, as shown in Fig. 1.1, and adjusted until the meniscus in the capillary tubing was near the top of the scale.
- A bench lamp was used as a light source.
The students noticed that bubbles of gas were given off from the E. densa. As the gas collected in the syringe barrel, the meniscus moved down the capillary tube. The plunger of the syringe did not move.
The students used the apparatus to investigate the effect of different light intensities on the rate of photosynthesis in E. densa.
Suggest a suitable control for this investigation.
Describe a method, using the apparatus shown in Fig. 1.1, that the students could use to investigate the effect of light intensity on the rate of photosynthesis of E. densa.
Your method should be set out in a logical order and be detailed enough to allow another person to follow it.
The steps carried out to set up the apparatus shown in Fig. 1.1 should not be included.
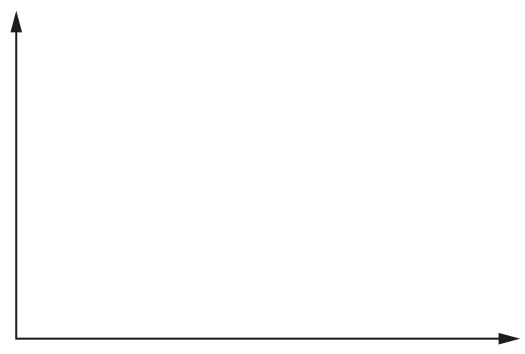
Complete the sketch graph to predict the results that you would expect from the method you have given in (b)(i).
Include axis labels with units in your answer.
The students decided to use paper chromatography to separate the photosynthetic pigments found in E. densa leaves.
- E. densa leaves were ground up in a small volume of solvent to make a concentrated solution of pigments.
- The different pigments in the solution were separated using paper chromatography.
- The distance moved by the solvent was measured on the completed chromatogram.
- The distances moved by the pigments were also measured.
- The values were calculated for these pigments.
Table 1.1 shows the results.
Table 1.1
| pigment number | colour of pigment | distance moved by pigment / mm | distance moved by solvent / mm | value |
|---|---|---|---|---|
| 1 | orange | 105 | 107 | 0.98 |
| 2 | yellow | 94 | 107 | ______ |
| 3 | blue–green | 62 | 107 | 0.58 |
| 4 | green | 45 | 107 | 0.42 |
Complete Table 1.1 by calculating the value for pigment 2.
Give your answer to two significant figures.
The formula for the calculation of is:
The students used a published source to find the values for three of the pigments that they expected to be present.
- of carotene = 0.95
- of chlorophyll = 0.60
- of chlorophyll = 0.50
The students correctly identified pigment 1 as carotene, pigment 3 as chlorophyll and pigment 4 as chlorophyll .
The calculated values were not exactly the same as the values in the published source.
Describe one difficulty with paper chromatography that could explain why the values calculated by the students were not exactly the same as the published data.
The rest of this paper
2 more questions- Q2Planning · Analysis, Conclusions and Evaluation13M
- Q3Analysis, Conclusions and Evaluation4M