Biology 9700/52 — October/November 2021
Cambridge A-Level · Planning, Analysis and Evaluation · worked solutions for every part, with the mark scheme
Topics Planning · Analysis, Conclusions and Evaluation
Some students researched how yeast, Saccharomyces cerevisiae, is used in the food industry. The students found that in different manufacturing processes yeast is provided with different types of sugar. These sugars are either monosaccharides or disaccharides.
The students decided to compare the effect of supplying yeast with glucose or with maltose.
Glucose is a monosaccharide. Maltose is a disaccharide composed of two glucose molecules joined by a glycosidic bond.
• The students made a standard yeast suspension using of dried yeast and of deionised water.
• The suspension was left at for two hours. During this time the yeast became active.
• After two hours the yeast culture was divided into two samples.
• Sample A was provided with glucose and sample B was provided with maltose.
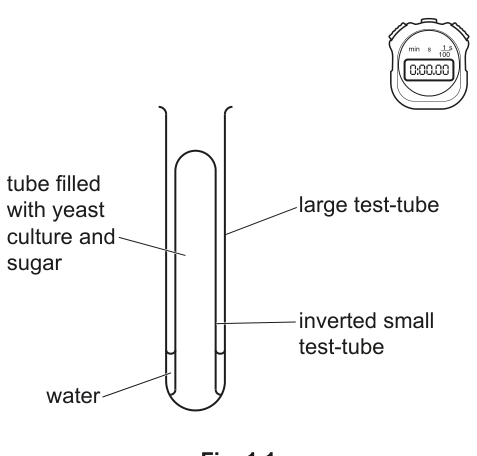
• The apparatus shown in Fig. 1.1 was set up for each sample separately.
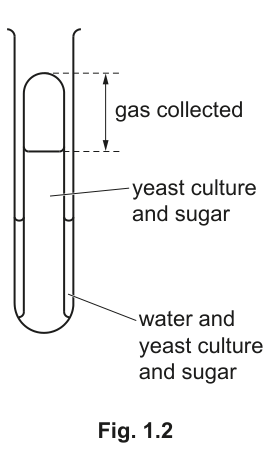
• As the yeast respired, gas collected at the top of the small test-tubes, as shown in Fig. 1.2.
The students used the apparatus to test the hypothesis:
Yeast has a higher rate of respiration when supplied with glucose than when supplied with maltose.
State the independent variable and the dependent variable in this investigation.
independent variable ______
dependent variable ______
The students stirred the yeast suspension before dividing it into the two samples.
Explain why it is important to stir the suspension.
Describe a method using the apparatus set up as shown in Fig. 1.1 that the students could use to test their hypothesis.
Your method should be set out in a logical order and be detailed enough for another person to follow.
You should not include details of how to make the yeast suspension or how to set up the apparatus.
Other students used a gas syringe to measure the volume of gas produced when a suspension of yeast was supplied with glucose or maltose.
Fig. 1.3 shows their results.
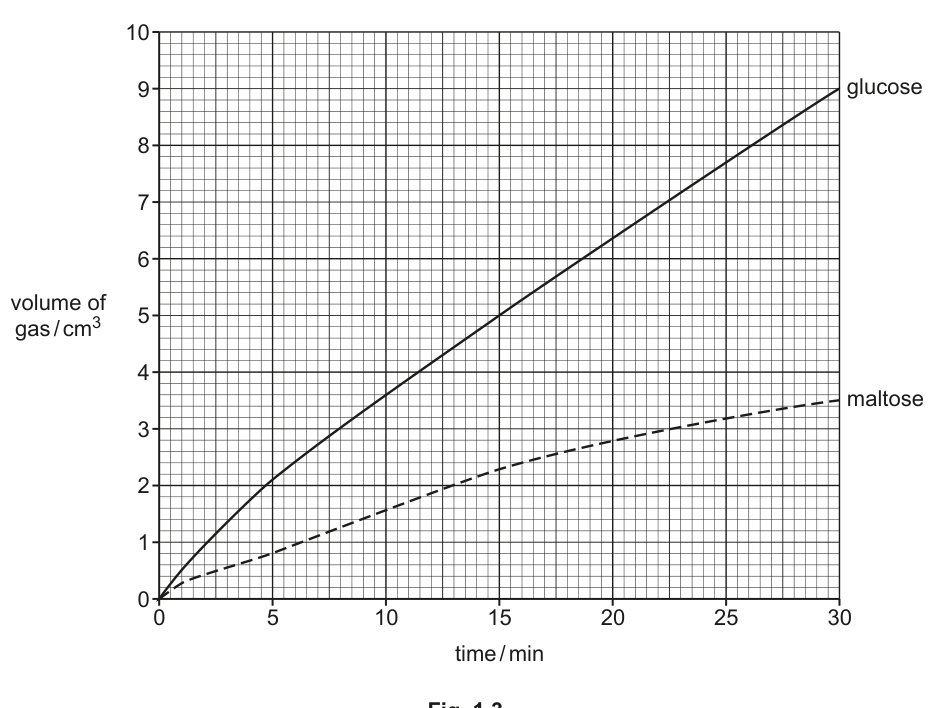
State how the students could calculate the rate of respiration from the results shown in Fig. 1.3.
State and explain the conclusions that can be made for the results in Fig. 1.3.
When the students evaluated their method they thought that they could measure the change in pH in the yeast suspension as the gas produced by yeast is carbon dioxide.
One student suggested using an indicator solution and colour chart. Another student suggested using a pH meter.
Suggest the advantages of using a pH meter rather than an indicator solution and colour chart.
The rest of this paper
1 more questions- Q2Planning · Analysis, Conclusions and Evaluation13M