Biology 9700/53 — May/June 2021
Cambridge A-Level · Planning, Analysis and Evaluation · worked solutions for every part, with the mark scheme
Topics Analysis, Conclusions and Evaluation · Planning
When bananas ripen, they turn brown in colour. This is due to the formation of a brown product called melanin.
The enzyme catechol oxidase acts on its substrate, catechol, leading to the formation of a brown product, melanin, as shown in Fig. 1.1.
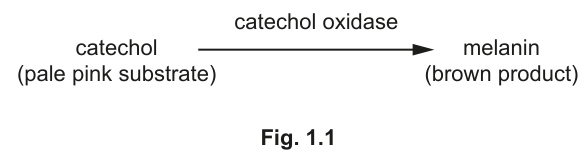
Fig. 1.1
As melanin is produced, the colour of the reaction mixture changes to brown. The intensity of the brown colour produced is proportional to the concentration of melanin. The more active the enzyme, the more intense the brown colour.
A colorimeter is used to measure the absorbance of the reaction mixture. Absorbance is a measure of the light absorbed by a coloured solution. With the reaction shown in Fig. 1.1, the more intense the brown colour, the higher the absorbance.
Catechol oxidase can be extracted from bananas.
Some students were asked to extract catechol oxidase by grinding a slice of banana with sand and water, using a mortar and pestle. The resulting mixture was then filtered through a piece of cloth.
Suggest a reason for:
grinding with sand
filtering through cloth.
Answer
Grinding with sand breaks open / ruptures the banana cells, releasing the catechol oxidase enzyme into the solution.
Filtering through cloth removes the sand and cell debris so that the enzyme solution is clear / free of solid particles that would interfere with the colorimeter.
See working
Background Concept
Enzymes such as catechol oxidase are located inside plant cells. To study an enzyme in the laboratory, the cells must first be broken open so the enzyme is released into a watery solution (the extract). Mechanical disruption (grinding) is the simplest method. Solid debris must then be removed because particles in the extract would scatter light in the colorimeter and give a false absorbance reading.
Understanding the Question
Part (a) is asking the candidate to justify two specific stages of the extraction protocol:
- grinding a banana slice with sand and water using a mortar and pestle
- filtering the resulting mixture through cloth
Each justification should be one clear sentence linking the step to a biological or practical purpose.
Approach
Think of each step in terms of what is being achieved physically:
- Sand is abrasive → it grinds against the plant tissue and breaks the cells.
- Cloth is a coarse filter → it lets liquid and dissolved molecules through but holds back solid matter.
Step-by-Step Reasoning
- Grinding with sand: Sand grains are hard and abrasive. As the pestle grinds the banana slice against the sand, the cellulose cell walls and membranes are torn open and the contents of the cells (including the enzyme catechol oxidase) spill out into the water. Without this step, the enzyme would remain trapped inside intact cells and could not act on the substrate.
- Filtering through cloth: After grinding, the mixture contains enzyme solution along with sand grains, broken cell walls, starch granules and other insoluble debris. If this were placed in a colorimeter, the suspended particles would scatter the light beam and produce an artificially high absorbance, masking the colour change caused by the melanin product. Passing the mixture through cloth retains the solids but allows the clear enzyme solution to pass through.
Key Takeaways
- Mechanical disruption (sand, pestle and mortar) is required to release intracellular enzymes.
- Filtration/centrifugation is needed to obtain a clear extract suitable for colorimetry.
Common Mistakes
- Saying that sand "mixes with" the banana — sand is not a chemical reagent; it acts mechanically.
- Saying that filtration "purifies the enzyme" — it does not; it only removes insoluble debris. Purification would require further steps (e.g. ammonium-sulphate precipitation, column chromatography).
- Stating that the cloth removes the enzyme — the enzyme is in solution and passes through the cloth with the water.
Things to Be Careful About
The two answers must be stated as separate reasons; the mark scheme awards one mark per correct justification. Do not give a single combined answer.
The students investigated the effect of the substrate concentration on the enzyme-catalysed reaction shown in Fig. 1.1.
The students were provided with:
- the extracted catechol oxidase enzyme solution prepared in step (a), which was kept cold until needed
- a stock solution of catechol solution made up in a buffered solution of pH 7.0
- a buffer solution of pH 7.0.
The procedure used by the students is outlined in steps 1 to 3.
- The extracted catechol oxidase enzyme solution was mixed with the catechol solution.
- After 2 minutes a colorimeter was used to measure the absorbance of this mixture.
- Step 1 and step 2 were repeated using different concentrations of catechol solution.
Suggest why the students used a colorimeter to measure the absorbance rather than judging the intensity of the colour by eye.
Answer
A colorimeter gives a quantitative / numerical measurement of the intensity of the brown colour, whereas judging by eye is subjective / qualitative.
See working
Background Concept
When an enzyme reaction produces a coloured product, the rate of reaction can be followed by measuring how quickly the colour develops. There are two broad approaches:
- Qualitative — describing the colour by eye ("light brown", "dark brown"). This depends on the observer and cannot easily be compared between samples.
- Quantitative — measuring absorbance with a colorimeter (or transmission with a spectrophotometer). The absorbance is directly proportional to the concentration of the coloured product (Beer–Lambert law) and gives a numerical value that can be plotted, compared and analysed statistically.
Understanding the Question
The students need to react catechol oxidase with catechol and judge how active the enzyme is. The brown product melanin is coloured, but its shade is hard to grade visually. The question asks why a colorimeter is preferable to judging the colour by eye.
Approach
Identify the key benefit of colorimetry: it produces a quantitative, objective, numerical reading that is independent of who is looking at the tube. The mark scheme rewards the words "quantitative" or equivalent (e.g. "numerical").
Step-by-Step Reasoning
- Different students would disagree about whether a brown solution is "moderately" or "strongly" coloured.
- A colorimeter measures the absorbance of light of a chosen wavelength through the solution; the reading is a number that does not depend on the observer.
- This numerical value can be compared between tubes, plotted on a graph and used to calculate a rate.
Key Takeaways
- Colorimetry converts a subjective colour judgement into an objective numerical value.
- A quantitative result allows comparison between treatments and statistical analysis.
Common Mistakes
- Saying the colorimeter is "more accurate" without explaining why — the key point is that the result is quantitative/objective.
- Saying it is "easier" — irrelevant; the mark is for the nature of the data produced.
Things to Be Careful About
Do not write vague statements such as "more reliable" without specifying the comparison (subjective judgement by eye vs. objective numerical reading).
Identify the independent variable and the dependent variable in this investigation.
independent variable = ______
dependent variable = ______
Answer
Independent variable = concentration of catechol (substrate)
Dependent variable = absorbance (measured using a colorimeter)
independent variable = concentration of catechol; dependent variable = absorbance
Background Concept
In any controlled investigation three kinds of variable are recognised:
- Independent variable (IV) — what the experimenter deliberately changes.
- Dependent variable (DV) — what is measured to see the effect of changing the IV.
- Standardised (controlled) variables — everything kept the same so that any change in the DV can be attributed to the IV.
Understanding the Question
The procedure (step 3) tells us that the students vary the concentration of the catechol solution and measure the absorbance with a colorimeter. Therefore the concentration of catechol must be the IV and the absorbance must be the DV.
Approach
Read the procedure carefully and pick out the verb "repeated using different concentrations of catechol solution" (the thing changed) and the verb "a colorimeter was used to measure the absorbance" (the thing measured).
Step-by-Step Reasoning
- "Different concentrations of catechol solution" = the variable the students deliberately alter → independent variable.
- "Absorbance of this mixture" measured with a colorimeter = the response being recorded → dependent variable.
Key Takeaways
- IV = what you change; DV = what you measure.
- The DV should ideally be linked to the rate of the enzyme-catalysed reaction; here absorbance is proportional to melanin concentration, so absorbance after a fixed time is proportional to the initial rate.
Common Mistakes
- Writing "amount of catechol" rather than "concentration of catechol" — concentration is the correct scientific term for an aqueous solution.
- Writing "rate of reaction" as the DV — the students are not measuring rate directly; they are measuring absorbance after a fixed time, which is then used as the initial rate.
Things to Be Careful About
The mark scheme requires the exact terms: concentration of catechol / substrate and absorbance. Do not paraphrase as "colour intensity" or "amount of melanin".
The students used the absorbance values at 2 minutes as the initial rates of reaction.
Fig. 1.2 shows the results.
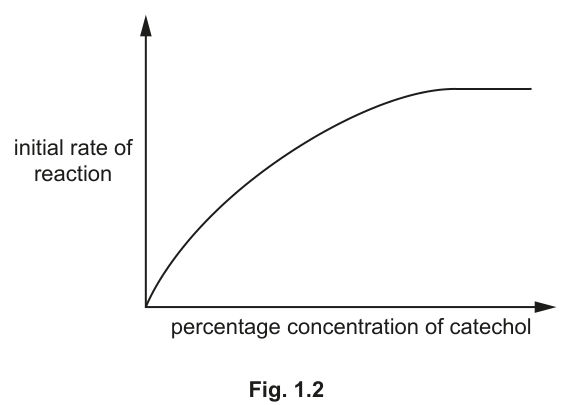
Fig. 1.2
The students decided to investigate the effect of inhibitors on the reaction shown in Fig. 1.1. The students planned to add an inhibitor, inhibitor Y, to reaction mixtures containing different concentrations of catechol solution.
Describe a method the students could use to collect the data needed to test the effect of inhibitor Y in reaction mixtures containing different concentrations of catechol solution.
The description of your method should be set out in a logical way and be detailed enough for another person to follow.
You should not repeat the details from (a) describing how the extract of catechol oxidase is prepared.
Hypothesis
Adding inhibitor Y will decrease the initial rate of the catechol oxidase reaction compared with the reaction in the absence of the inhibitor.
Variables
- Independent variable: concentration of catechol (substrate) solution, %
- Dependent variable: absorbance measured with a colorimeter (a measure of initial rate of reaction)
- Standardised variables: volume and concentration of catechol oxidase enzyme extract; volume and concentration of inhibitor Y; pH (pH 7.0 buffer); temperature; time before measuring absorbance (2 minutes); wavelength used in the colorimeter
Method
- Prepare a series of at least five different concentrations of catechol solution from the 1.0% stock using the pH 7.0 buffer to dilute, e.g. 0.2%, 0.4%, 0.6%, 0.8% and 1.0%. Label each solution.
- Keep the catechol oxidase enzyme extract cold in an ice bath until required, to prevent denaturation.
- Place the catechol solutions and the enzyme extract in a water bath at 25 °C for a few minutes so that both are equilibrated to the same temperature before mixing.
- For each catechol concentration, use a separate clean test tube. Add a fixed volume of catechol solution (e.g. 5 cm³) and a fixed volume of inhibitor Y (e.g. 1 cm³ of a stated concentration). Mix, then add a fixed volume of enzyme extract (e.g. 2 cm³) and start timing.
- After exactly 2 minutes, pour the reaction mixture into a cuvette and measure the absorbance using a colorimeter set to a suitable wavelength (e.g. 540 nm), having first zeroed the colorimeter with a blank of buffer.
- Repeat the whole experiment with the same range of catechol concentrations, but replacing the inhibitor Y with the same volume of buffer (control without inhibitor).
Replication and reliability
Repeat each reaction mixture at least three times and calculate the mean absorbance for each catechol concentration. Plot mean absorbance (initial rate) against catechol concentration for both series.
Safety
Catechol is irritant to skin and eyes — wear safety goggles and gloves, and wash off any spillages immediately.
See working
Background Concept
This question tests the planning of a controlled enzyme investigation. Catechol oxidase catalyses the conversion of catechol (pale pink) to melanin (brown). The brown colour can be quantified by absorbance at a chosen wavelength using a colorimeter; absorbance after a fixed short time is proportional to the initial rate of reaction. An inhibitor that lowers the rate can be characterised by the change it produces on the Michaelis–Menten curve (lower , unchanged for a non-competitive inhibitor).
A good plan must:
- state a clear hypothesis;
- identify IV, DV and standardised variables;
- describe a workable, ordered procedure that another person could follow;
- include appropriate controls (reaction without inhibitor);
- include replication (≥3 repeats) and the calculation of means;
- address a relevant safety hazard.
Understanding the Question
The students already have the procedure for an enzyme-only investigation (steps 1–3 in the question stem). They now need to extend that procedure so that they can test the effect of inhibitor Y on the same reaction, using a range of catechol concentrations. The question says "the description of your method should be set out in a logical way and be detailed enough for another person to follow" and explicitly tells you not to repeat the enzyme-extraction details from part (a).
Approach
Adopt the standard structure for a Paper 5 plan:
- Hypothesis.
- Variables — IV, DV, standardised variables.
- Method — dilution series, mixing protocol, measurement, control.
- Replication and analysis.
- Safety.
Hit each of the 13 possible marking points the examiner has identified so that you cover the 8 marks on offer.
Step-by-Step Reasoning
Hypothesis (covers the scientific rationale): The simplest statement — adding inhibitor Y will lower the rate of reaction compared with the uninhibited reaction — is sufficient.
Variables (marks 6, 7, 8):
- IV: concentration of catechol solution.
- DV: absorbance (initial rate).
- Standardised: same volume and concentration of enzyme extract; same volume and concentration of inhibitor Y; same volume of catechol solution; same pH (pH 7.0 buffer); same temperature; same time before reading absorbance (e.g. 2 minutes); same wavelength setting on the colorimeter.
Method (marks 1, 2, 3, 4, 5, 9, 10):
- Prepare at least five dilutions of catechol from the 1.0% stock (e.g. 0.2%, 0.4%, 0.6%, 0.8%, 1.0%) using the pH 7.0 buffer. State the range and include the % units.
- Keep the enzyme extract cold (e.g. in an ice bath) to preserve its activity.
- Equilibrate enzyme and substrate to the same temperature (e.g. 25 °C water bath) before mixing so that mixing does not cause a temperature jump that would alter the rate.
- Maintain the reaction at a constant temperature throughout, e.g. in the water bath.
- Mix a fixed volume of catechol + fixed volume of inhibitor Y + fixed volume of enzyme, start timing, leave for exactly 2 minutes, then read absorbance on the colorimeter.
- Additional colorimeter detail: zero the colorimeter with a buffer blank at the start and use the same wavelength for every reading.
Control (mark 12): Repeat the entire experiment with the same catechol concentrations but with the inhibitor replaced by the same volume of buffer. This gives the data to compare against (Fig. 1.3).
Replication (mark 11): Carry out at least three replicates of every mixture and calculate the mean absorbance for each catechol concentration.
Safety (mark 13): Catechol (and many enzyme substrates) is irritant. Name the hazard (skin/eye irritant), the risk (contact with skin or eyes) and the precaution (wear goggles and gloves; wash spillages immediately).
Key Takeaways
- A complete plan must cover hypothesis, variables, method (with controls and replication) and safety.
- For enzyme assays the rate must be measured under standardised conditions of temperature, pH, enzyme concentration and timing.
- A dilution series of at least five values across the range gives a graph shape from which inhibition type can be judged.
Common Mistakes
- Repeating the enzyme-extraction details from (a) — explicitly told not to.
- Failing to include a control without Y — without it, the experiment has nothing to be compared with.
- Forgetting to keep volumes of enzyme, substrate and inhibitor constant — any change in these would alter the rate independently of substrate concentration.
- Not stating a fixed time before measuring absorbance — the rate can only be inferred if the measurement time is the same for every tube.
- Vague temperature control ("at room temperature") — should specify a value and the method (water bath).
Things to Be Careful About
- Specify concentrations in % to match the question's wording.
- Use absorbance (not "colour") as the dependent variable, because the colorimeter is the chosen instrument.
- Replication means separate, independent repeats — repeating the same reading on the same tube is not a replicate.
Fig. 1.3 shows the results when no inhibitor Y was added.
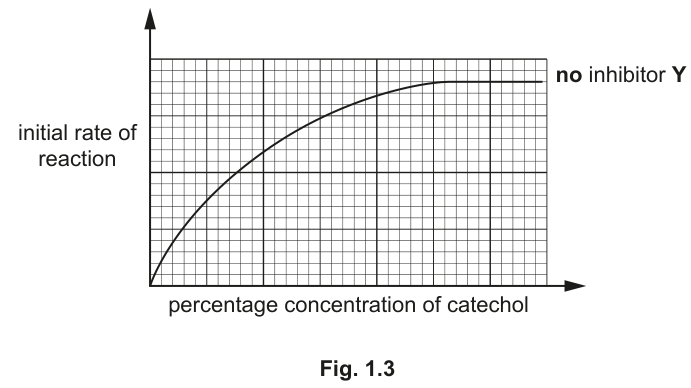
Fig. 1.3
The students suggested that inhibitor Y was acting as a non-competitive inhibitor.
On Fig. 1.3, sketch the curve expected if inhibitor Y was acting as a non-competitive inhibitor.
Answer
On Fig. 1.3, draw a second curve that:
- starts at the origin,
- lies to the right of the original curve at low catechol concentrations,
- rises and plateaus at a lower than the original curve.
The new curve should reach the same maximum height is wrong — it must plateau below the original.
See working
Background Concept
In a Michaelis–Menten plot of initial rate against substrate concentration:
- the curve rises steeply at first (rate limited by substrate availability),
- then plateaus as the enzyme becomes saturated with substrate — the maximum rate is .
Different inhibitors alter the curve in characteristic ways:
- Competitive inhibitor: raises the apparent (curve shifts to the right at low [S]) but is unchanged at high [S] because the substrate can out-compete the inhibitor.
- Non-competitive inhibitor: lowers (the inhibitor reduces the number of functional active sites, and this cannot be overcome by adding more substrate) but is unchanged because the inhibitor does not affect the affinity of the remaining active sites for substrate. The curve therefore plateaus below the uninhibited curve.
Understanding the Question
The students have plotted the uninhibited reaction on Fig. 1.3 (a curve rising to a plateau labelled "no inhibitor Y"). They claim that Y is a non-competitive inhibitor. You must sketch the curve that would result if they were correct.
Approach
Recall the two diagnostic features of a non-competitive inhibitor on this type of graph:
- The plateau is lower ( is reduced).
- The shape at low substrate concentrations can differ slightly, but — the [S] at half — is unchanged.
A practical way to draw it is to sketch a curve of the same general shape but levelling off at, say, two-thirds or half of the height of the original plateau, starting a little to the right of the original curve at low concentrations.
Step-by-Step Reasoning
- Mark a horizontal line at half the original (this defines the new , which is the same as the original because is unchanged).
- From that point sketch a curve of similar shape to the original that rises and plateaus at a lower maximum.
- The new curve should sit to the right of the original at low catechol concentrations but converge with the original only at the new, lower plateau (it should not cross the original curve at any point above the new plateau).
Key Takeaways
- Non-competitive inhibition reduces ; it does not change .
- The signature shape is the same general Michaelis–Menten curve but with a lower plateau.
Common Mistakes
- Drawing the new curve above the original (e.g. drawing an activator's curve) — non-competitive inhibition always reduces the maximum rate.
- Drawing the new curve plateauing at the same height as the original — that is the shape expected for a competitive inhibitor at very high [S], not a non-competitive one.
- Forgetting to indicate that the new curve should be clearly to the right of the original at low substrate concentrations.
Things to Be Careful About
The examiner awards one mark for "curve to the right of the original curve" and one mark for "plateau below the original curve". You must show BOTH features explicitly.
is the maximum initial rate of reaction of the enzyme.
The Michaelis-Menten constant, , is the substrate concentration at which the initial rate of reaction is half its maximum value.
Draw on Fig. 1.3 the positions of and of the enzyme when no inhibitor Y is present.
Answer
- Draw a horizontal dashed line from the plateau of the "no inhibitor Y" curve across to the y-axis; label this line .
- Find the value on the y-axis that is exactly half of . Draw a second horizontal dashed line from this value to the curve, then drop a vertical dashed line down to the x-axis. The x-axis value at the foot of this vertical line is ; label it on the x-axis.
See working
Background Concept
Two parameters describe the kinetic behaviour of an enzyme following Michaelis–Menten kinetics:
- — the maximum initial rate, reached when all enzyme active sites are saturated with substrate. On a rate vs. [substrate] graph it is the height of the plateau.
- — the Michaelis constant. It is the substrate concentration at which the initial rate is exactly half of . is also a (inverse) measure of the apparent affinity of the enzyme for its substrate: a low indicates high affinity, a high indicates lower affinity.
Understanding the Question
Fig. 1.3 shows the uninhibited enzyme's rate curve. The student is asked to mark and on this graph for the no-inhibitor situation.
Approach
Use the definitions literally:
- = the plateau height on the y-axis.
- = the [substrate] on the x-axis corresponding to a rate equal to half .
Draw construction lines (dashed) so the examiner can see how the values were obtained.
Step-by-Step Reasoning
- Identify the plateau of the curve. Draw a horizontal dashed line from this height across to the y-axis. The value on the y-axis is . Label it on the y-axis.
- Halve this value on the y-axis. From this halved value, draw a second horizontal dashed line until it meets the curve.
- From the point where this half-rate line meets the curve, drop a vertical dashed line down to the x-axis. The point at which it meets the x-axis is . Label it on the x-axis.
Key Takeaways
- is read off at the plateau; requires a construction at half the plateau height.
- The labels must be on the axes, not in the middle of the graph — the examiner must be able to read numerical values.
Common Mistakes
- Marking at the origin or at any arbitrary x-axis value rather than at the half- point.
- Drawing the construction lines but failing to label them, so the examiner cannot tell which axis intercept is meant.
- Confusing with the rate at any particular substrate concentration — is specifically the maximum (plateau) rate.
Things to Be Careful About
The construction lines should be dashed (or drawn clearly) so that they can be distinguished from the data curve. The labels and should be placed on the relevant axis, not floating in the middle of the graph.
Use your graph to describe the effect of the addition of inhibitor Y on the of this enzyme.
Answer
The of the enzyme is the same with inhibitor Y present as without inhibitor Y.
See working
Background Concept
is the substrate concentration at which the rate is half of . It is a measure of the affinity of the enzyme's active site for its substrate.
A non-competitive inhibitor binds to a site on the enzyme other than the active site (an allosteric site). It does not compete with the substrate for binding, so it does not change the affinity of the remaining functional active sites. Therefore:
- decreases (because some enzyme molecules are inactivated and cannot be rescued by adding more substrate),
- is unchanged (the uninhibited active sites still bind substrate with the same affinity).
On a Michaelis–Menten plot the inhibited curve therefore reaches half of the new, lower at the same substrate concentration as the uninhibited curve reached half of the original .
Understanding the Question
Part (c)(iv) asks specifically about the effect on , not on . The student must use the curves drawn on Fig. 1.3 to compare the two values.
Approach
Recall the definition of and the defining feature of non-competitive inhibition. State the conclusion in one sentence.
Step-by-Step Reasoning
- The is read off the x-axis where the rate equals half of the (relevant) .
- For the uninhibited curve, corresponds to a particular [catechol].
- For the non-competitively inhibited curve, is lower, so half of is also lower — but the [catechol] at which the rate equals this new half- is the same as before.
- Therefore is unchanged.
Key Takeaways
- Non-competitive inhibitors do not change .
- Competitive inhibitors, in contrast, raise the apparent (the curve shifts right at low [S]).
Common Mistakes
- Saying increases — this is true of a competitive inhibitor, not a non-competitive one.
- Saying decreases — the inhibitor does not improve the enzyme's affinity for substrate.
- Confusing with — the question asks specifically about , not about the maximum rate.
Things to Be Careful About
The mark scheme explicitly states that the expected answer is that is the same with the non-competitive inhibitor. Do not over-explain; one clear statement is enough for the single mark.
Hypertension is a condition where people have long-term high blood pressure.
Two main types of drug are used to lower blood pressure in people with hypertension:
- ACE inhibitors
- diuretics.
Scientists investigated the effectiveness of the drugs when used separately and in combination.
505 people with hypertension were split into four groups as shown in Table 1.1.
Table 1.1
| group | treatment |
|---|---|
| 1 | placebo (no active drug given) |
| 2 | ACE inhibitor only |
| 3 | diuretic only |
| 4 | ACE inhibitor and diuretic |
The results are shown in Fig. 1.4.
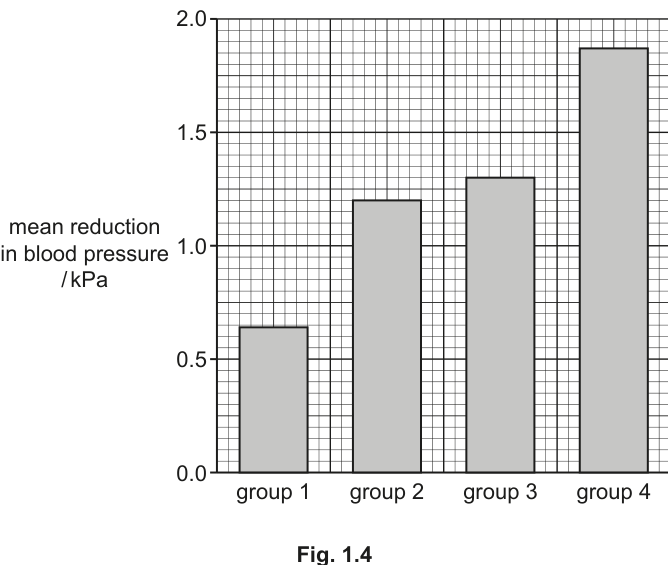
Fig. 1.4
The scientists analysed the data and concluded that a combination of an ACE inhibitor and a diuretic should be used to lower blood pressure in the treatment of hypertension.
With reference to the data in Table 1.1 and Fig. 1.4, discuss the conclusion that a combination of an ACE inhibitor and a diuretic should be used to lower blood pressure in the treatment of hypertension.
Answer
Points in support and against the conclusion:
- The bar chart in Fig. 1.4 shows that group 4 (ACE inhibitor + diuretic) has the largest mean reduction in blood pressure (~1.9 kPa) compared with placebo (~0.65 kPa), ACE inhibitor alone (~1.2 kPa) and diuretic alone (~1.3 kPa), so the combination appears to be the most effective treatment.
- However, there are no error bars on the bars in Fig. 1.4, so we cannot tell how variable the data are within each group.
- There is no information about whether a statistical test (e.g. a -test) has been carried out, so we do not know whether the difference between group 4 and the single-drug groups is statistically significant.
See working
Background Concept
When a clinical trial is published, its conclusions should be evaluated on:
- the data themselves (are the differences real, large, and consistent?),
- the experimental design (sample size, controls, randomisation, blinding),
- the statistical analysis (error bars, significance tests, confidence intervals),
- the scope of the trial (long-term vs short-term outcomes, side-effects, type of patients).
A bar chart without error bars and without any statistical test leaves the reader unable to judge whether apparent differences are real or could be due to random variation between patients.
Understanding the Question
A trial of 505 patients with hypertension has been split into four groups (placebo, ACE inhibitor alone, diuretic alone, ACE inhibitor + diuretic). The mean reduction in blood pressure has been plotted as a bar chart (Fig. 1.4). The scientists conclude that the combination drug treatment is the best option. The question asks the student to discuss this conclusion with reference to both Table 1.1 and Fig. 1.4 — that is, to weigh up the evidence for and against the conclusion.
Approach
Make a list of:
- What the data do show — point 1 below.
- What the data do not show, but the conclusion assumes — points 2 and 3 (and optionally 4).
For full marks, give both a supporting and at least one critical point.
Step-by-Step Reasoning
-
Supporting the conclusion: The bar chart clearly shows that group 4 (combination) has a higher mean reduction in blood pressure (~1.9 kPa) than groups 2 (ACE inhibitor alone, ~1.2 kPa), 3 (diuretic alone, ~1.3 kPa) and 1 (placebo, ~0.65 kPa). On the face of it, the combination does appear most effective.
-
Against the conclusion — no error bars: Fig. 1.4 shows only the means. There are no error bars (e.g. ± standard deviation or 95% confidence intervals), so we cannot tell how variable the patients' responses were within each group. A larger mean difference could still be within the spread of the data.
-
Against the conclusion — no statistical test: No information is given about whether the differences between the groups have been tested for significance (e.g. by a -test). Without such a test, we cannot tell whether the difference between group 4 and, say, group 3 is statistically significant or could easily have arisen by chance.
-
(AVP) Other reasonable concerns:
- No data on long-term effects — only short-term reductions in blood pressure are reported.
- No information about side-effects of the drugs.
- No information about the type of hypertension (e.g. primary vs secondary), the age or gender of the patients, or the dose of each drug.
- Even the placebo group showed some reduction (~0.65 kPa), suggesting that further factors (e.g. lifestyle advice, regression to the mean) contribute to the result.
Key Takeaways
- A conclusion is only as strong as the data and the statistical analysis behind it.
- Apparent differences on a bar chart must be supported by a measure of variability and a significance test before a treatment can be declared superior.
- Clinical conclusions should also be examined for scope (long-term outcomes, side-effects) and for patient details (age, gender, severity of disease).
Common Mistakes
- Simply repeating the heights of the bars without any critical evaluation — the question asks for a discussion, not a description.
- Saying the conclusion is fully supported because group 4 has the highest bar — this ignores the missing error bars and significance test.
- Saying the conclusion is wrong because "we do not know the mechanism" — the trial can still be valid even without a known mechanism.
- Bringing in irrelevant biology (e.g. how ACE inhibitors work at the molecular level) — the question is about the data, not the mechanism.
Things to Be Careful About
- The mark scheme awards one mark for the supporting point and two marks for the critical points. You must give at least one critical point to score full marks.
- Use the figures from Fig. 1.4 (e.g. ~1.9 kPa for group 4) where appropriate — quoting the data shows engagement with the question.
The rest of this paper
1 more questions- Q2Analysis, Conclusions and Evaluation9M