Biology 9700/52 — May/June 2021
Cambridge A-Level · Planning, Analysis and Evaluation · worked solutions for every part, with the mark scheme
Topics Planning · Analysis, Conclusions and Evaluation
The enzyme catalase catalyses the reaction shown in Fig. 1.1.
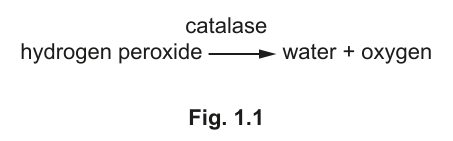
A student had read that copper(II) sulfate can act as an inhibitor, reducing the activity of catalase.
The student wanted to investigate the effect of copper(II) sulfate as an inhibitor on the activity of catalase to test the hypothesis:
The higher the concentration of the inhibitor copper(II) sulfate, the lower the volume of oxygen produced in the presence of catalase.
State the independent variable and dependent variable in this investigation.
independent variable ______
dependent variable ______
Answer
Independent variable: concentration of copper(II) sulfate
Dependent variable: volume of oxygen (collected)
Independent: concentration of copper(II) sulfate; Dependent: volume of oxygen
Background Concept
The independent variable (IV) is the factor the experimenter deliberately changes. The dependent variable (DV) is the factor that is measured to record the effect of that change. A useful trick is to read the hypothesis: the IV is what is being 'varied' or 'changed', and the DV is what is 'measured' or 'recorded'.
Understanding the Question
The hypothesis states: "The higher the concentration of the inhibitor copper(II) sulfate, the lower the volume of oxygen produced in the presence of catalase." The student is provided with one set of apparatus (Fig. 1.2) that will measure the volume of oxygen produced when catalase breaks down hydrogen peroxide. The student is told to test the effect of different inhibitor concentrations.
Approach
Identify the factor the student is going to change between experiments (the IV) and the factor the student is going to measure to see the effect (the DV). The hypothesis wording makes both clear.
Step-by-Step Reasoning
- "The higher the concentration of the inhibitor" — the student will make up several different concentrations of copper(II) sulfate and use a different one in each experiment. So concentration of copper(II) sulfate is the IV.
- "the lower the volume of oxygen produced" — the student will record how much oxygen is collected in the graduated tube. So volume of oxygen is the DV.
Key Takeaways
- IV = what is changed; DV = what is measured.
- A hypothesis often names both directly.
- These are the variables that will be plotted on the x- and y-axes later in the question.
Common Mistakes
- Saying "amount" of oxygen rather than "volume" — the mark scheme requires "volume", since gas is collected in a graduated tube.
- Saying "type of inhibitor" or "concentration of catalase" as the IV — these are not what the student varies.
Things to Be Careful About
Use the exact wording of the mark scheme: "concentration of copper(II) sulfate" and "volume of oxygen".
The student was provided with a solution of copper(II) sulfate.
Describe how the student could use serial dilution to make a suitable range of concentrations to test their hypothesis.
Answer
A suitable range of concentrations (mol dm⁻³): 0.04, 0.02, 0.01, 0.005, 0.0025 (plus 0 as a control) — five stated dilutions with units.
Method of serial dilution:
- Use a pipette to transfer 5 cm³ of the 0.04 mol dm⁻³ copper(II) sulfate into a test tube and add 5 cm³ of distilled water. Mix to give 0.02 mol dm⁻³.
- Transfer 5 cm³ of the 0.02 mol dm⁻³ solution into a second test tube and add 5 cm³ of distilled water. Mix to give 0.01 mol dm⁻³.
- Repeat this process of doubling the volume with distilled water to obtain further intermediate concentrations of 0.005 and 0.0025 mol dm⁻³.
- Use 5 cm³ of distilled water as the 0 mol dm⁻³ control.
0.04, 0.02, 0.01, 0.005, 0.0025 mol dm⁻³ (with 0 mol dm⁻³ control); serial dilution by halving each time using 5 cm³ + 5 cm³ water.
Background Concept
A serial dilution is a stepwise dilution in which the same dilution factor is applied repeatedly. Each new tube contains a fixed fraction (commonly a half) of the previous concentration. The advantage over making each concentration independently is that only one stock is needed, fewer calculations are required and pipetting errors do not accumulate as badly. To halve the concentration, equal volumes of solution and diluent (distilled water) are mixed.
Understanding the Question
The student has a 0.04 mol dm⁻³ stock of copper(II) sulfate and needs to prepare a range of concentrations to test the hypothesis (which expects a trend across concentrations). The mark scheme asks for two things: (1) at least five stated concentrations with units and (2) a description of the serial dilution method for at least two of the intermediate concentrations.
Approach
Choose a halving series, decide on the volume of each transfer (5 cm³ + 5 cm³ = 10 cm³ is convenient), state every concentration in mol dm⁻³, and describe the procedure for at least the first two intermediate dilutions.
Step-by-Step Reasoning
- Stock: 0.04 mol dm⁻³.
- Transfer 5 cm³ of stock + 5 cm³ water → 0.02 mol dm⁻³ (first intermediate).
- Transfer 5 cm³ of 0.02 mol dm⁻³ + 5 cm³ water → 0.01 mol dm⁻³ (second intermediate).
- Continue: 0.005 mol dm⁻³, 0.0025 mol dm⁻³.
- 0 mol dm⁻³ = distilled water (control).
- This is a serial dilution because each step uses the previous tube to make the next one.
Key Takeaways
- Serial dilution = repeated same-factor dilution; do not make each concentration independently from the stock.
- Always state concentrations with units.
- Five or more concentrations across the range are needed to identify a clear trend.
Common Mistakes
- Stating the concentrations without units (the mark scheme requires units).
- Listing fewer than five different concentrations.
- Describing only how to make the first dilution, not the serial (chain) procedure.
- Using 'amount' rather than 'volume' of water/solution.
Things to Be Careful About
The two marks are awarded independently: (1) for the list (with units) and (2) for the method. A common error is to describe a single dilution, which only scores the first mark.
The student used the apparatus shown in Fig. 1.2 to collect the data needed to test the effect of different concentrations of copper(II) sulfate on the production of oxygen in the presence of catalase.
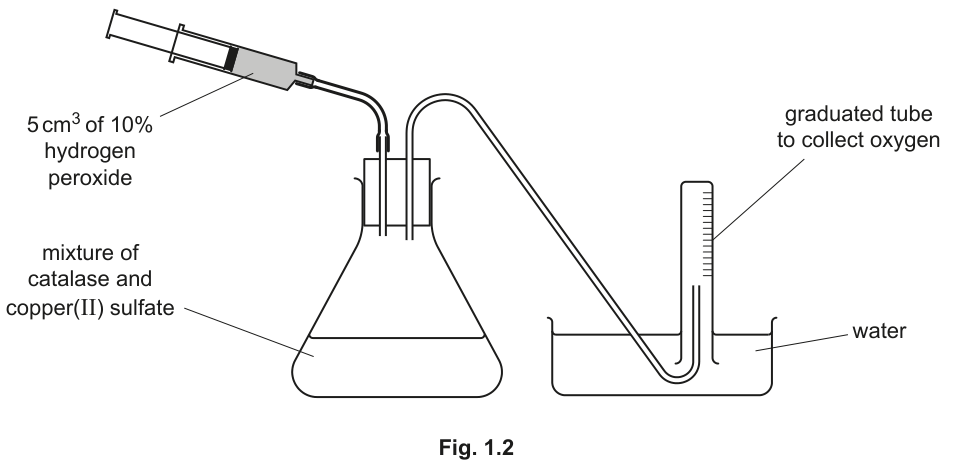
Describe a method the student could use to collect the data needed to test the effect of different concentrations of copper(II) sulfate on the production of oxygen in the presence of catalase.
The description of your method should be set out in a logical way and be detailed enough for another person to follow.
You should not repeat the details from (b)(i) describing how to dilute the copper(II) sulfate solution or how to set up the apparatus shown in Fig. 1.2.
Answer
- Use a pipette to add a fixed stated volume of catalase (e.g. 1 cm³) to the conical flask.
- Use a pipette to add a fixed stated volume of one concentration of copper(II) sulfate (e.g. 5 cm³) to the same flask. (Use a different concentration for each repeat of the experiment.)
- Add a buffer to the flask to maintain a constant pH.
- Place the flask in a water bath at a stated constant temperature (e.g. 30 °C) and leave it to equilibrate.
- Use the syringe to add a fixed stated volume of 10% hydrogen peroxide (e.g. 5 cm³) into the flask to start the reaction and immediately start a stopclock.
- Measure the volume of oxygen collected in the graduated tube over a fixed time (e.g. 60 s) or record the time taken to collect a fixed volume of oxygen.
- Repeat steps 1–6 with each of the other concentrations of copper(II) sulfate.
- Repeat the whole investigation at least three times for each concentration and calculate the mean volume of oxygen produced.
- Carry out a control in which the copper(II) sulfate is replaced with the same volume of distilled water.
- Safety: hydrogen peroxide is an irritant/oxidising agent and copper(II) sulfate is irritant/toxic — wear safety goggles and gloves; do not pour copper(II) sulfate down the sink.
See working — controlled method with fixed volumes, constant temperature (water bath) and pH (buffer), gas collection in fixed time, ≥3 replicates and mean, distilled-water control, and PPE for H2O2 and CuSO4.
Background Concept
A reliable enzyme-rate experiment must control everything that could affect the rate except the independent variable. For catalase, the rate is affected by temperature, pH, substrate (H2O2) concentration, enzyme concentration, and the presence of inhibitors. The rate of oxygen release can be measured either as the volume of O2 in a fixed time or as the time taken to collect a fixed volume of O2. Repeats allow anomalies to be spotted and a mean to be calculated; a control with no inhibitor confirms that any change is due to the inhibitor.
Understanding the Question
The student has a choice of concentrations prepared in (b)(i), a stock of catalase, 10% hydrogen peroxide, and the apparatus in Fig. 1.2 (a conical flask connected to an inverted graduated tube over water for gas collection). The student must describe, in a logical order, how to use this set-up to obtain a volume of oxygen at each inhibitor concentration. The description should be detailed enough for another person to follow, must not repeat (b)(i) (the dilution method) and must not describe how to assemble Fig. 1.2.
Approach
Work in a logical order — what goes into the flask first, how the flask is kept at constant conditions, what starts the reaction, what is measured, and what is repeated. While doing this, deliberately mention the variables to standardise (with how), the measurement technique, the control, replication, and safety. Each of these is a possible marking point.
Step-by-Step Reasoning
- Volume of catalase: must be the same in every experiment; state a volume (e.g. 1 cm³). If "amount" is used it can be penalised once, so use "volume".
- Volume of inhibitor solution: same total volume in every flask so that any change in oxygen volume is due to concentration, not to volume; e.g. 5 cm³ of each concentration.
- Temperature: enzyme rates are temperature-sensitive. Use a water bath at a stated temperature (e.g. 30 °C) so that all experiments are at the same temperature.
- pH: catalase, like most enzymes, is pH-sensitive. Add a buffer to keep pH constant.
- Substrate: same volume of 10% H2O2 added at the same point to start the reaction.
- Measurement: the easiest way is to record the volume of oxygen collected in a fixed time (e.g. 60 s) — this gives a rate. Reading the volume at the meniscus and recording in cm³ (or mm³) is required.
- Replicates: at least three readings per concentration; calculate a mean.
- Control: a flask set up with distilled water in place of copper(II) sulfate shows the maximum uninhibited rate and confirms the apparatus is working.
- Fresh solutions: each new replicate should use freshly mixed solutions, because catalase can denature and H2O2 decomposes on its own over time.
- Safety: H2O2 is irritant/oxidising; CuSO4 is irritant/toxic. PPE (gloves and goggles) and not pouring CuSO4 down the sink are the standard precautions.
Key Takeaways
- Standardise everything except the IV.
- "Volume" of catalyst/inhibitor; fixed time or fixed volume for the measurement.
- Mean of at least three replicates; include a no-inhibitor control.
- Always link a named hazard to a specific risk and a specific precaution.
Common Mistakes
- Forgetting to state a temperature for the water bath.
- Vague wording such as "keep conditions the same" without saying how.
- Using "amount" instead of "volume" — penalised once and ecf thereafter.
- Omitting the control or the safety points.
- Not stating a time (or volume) for the measurement.
Things to Be Careful About
The mark scheme allows any six of ten possible points. The most commonly missed are: stating a specific temperature (not just "water bath"), specifying the volume (not amount) of catalase and inhibitor, including a control with distilled water, and giving a complete hazard–risk–precaution chain.
The hypothesis the student tested was:
The higher the concentration of the inhibitor copper(II) sulfate, the lower the volume of oxygen produced in the presence of catalase.
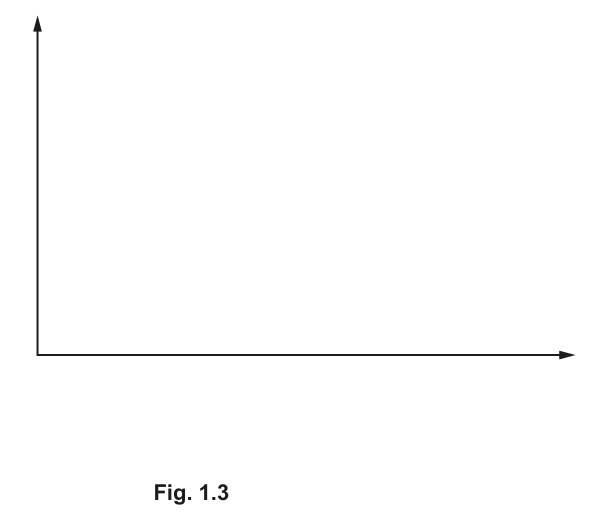
Complete Fig. 1.3 by:
- adding axes labels and units
- sketching a graph of the results you would expect if the hypothesis is correct.
Answer
- y-axis (vertical): volume of oxygen / cm³ (or mm³)
- x-axis (horizontal): concentration of copper(II) sulfate / mol dm⁻³
- Sketch: a straight (or gently curving) line sloping downwards from a high value on the y-axis (at 0 mol dm⁻³) to a low value on the x-axis (at the highest concentration), showing that as the inhibitor concentration increases, the volume of oxygen produced decreases.
y: volume of oxygen / cm³; x: concentration of copper(II) sulfate / mol dm⁻³; line slopes downward.
Background Concept
When presenting a relationship between two variables, the convention is to put the independent variable on the x-axis and the dependent variable on the y-axis. Every axis must be labelled with a quantity and a unit (e.g. / cm³, / mol dm⁻³). A sketch graph is enough when a hypothesis is being illustrated — points are not needed, only the line that conveys the predicted trend.
Understanding the Question
Fig. 1.3 provides blank axes. The candidate must (i) add axis labels in the correct orientation, (ii) add units, and (iii) sketch the line that the hypothesis predicts. The hypothesis says higher concentration → lower volume of oxygen, so the line must slope downward.
Approach
Put concentration of inhibitor on the x-axis (the IV) and volume of oxygen on the y-axis (the DV). Add units in the form quantity / unit. Draw a line from upper-left to lower-right.
Step-by-Step Reasoning
- Independent variable: concentration of copper(II) sulfate → x-axis.
- Dependent variable: volume of oxygen → y-axis.
- Units: / mol dm⁻³ for the x-axis; / cm³ or / mm³ for the y-axis (whichever the apparatus records — the graduated tube in Fig. 1.2 is in cm³).
- Trend: a downward line, starting at a high volume when [inhibitor] = 0 and decreasing as [inhibitor] increases. A straight line is acceptable; a gentle curve is also acceptable because the rate of change is unlikely to be exactly linear at high inhibitor concentrations.
Key Takeaways
- IV on x, DV on y.
- Always include units; format: quantity / unit.
- The shape of the line must follow the hypothesis.
Common Mistakes
- Swapping the axes (concentration on y, volume on x).
- Forgetting units — the second mark is for units alone.
- Drawing a line that goes up (positive trend) instead of down.
- Drawing data points (the question asks for a sketch line).
Things to Be Careful About
The mark scheme awards one mark for orientation + label, one for units, and one for the downward line. All three are required; missing any one of them costs a mark.
The student carried out a further investigation to find out if copper(II) sulfate was a competitive or non-competitive inhibitor.
- The student measured the oxygen produced in the presence and absence of copper(II) sulfate at different concentrations of hydrogen peroxide.
- The student processed the data to find the rate of oxygen production.
The student then plotted these rates on the graph shown in Fig. 1.4.
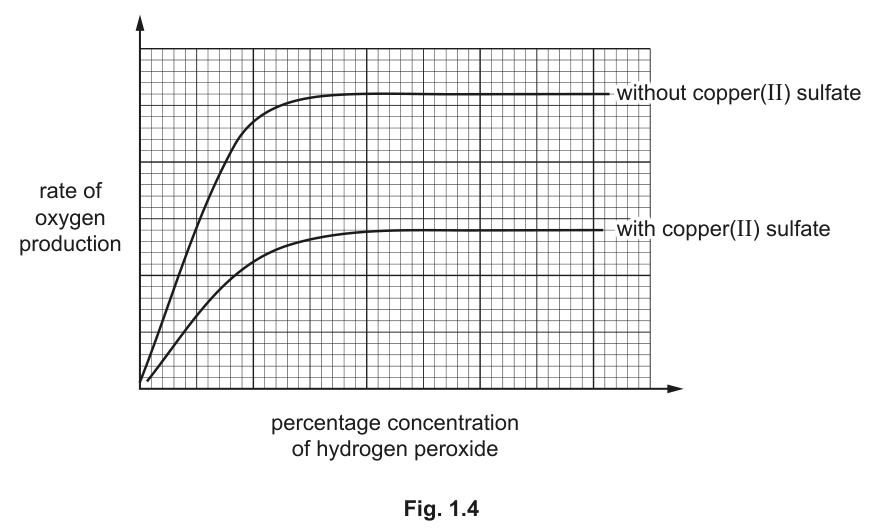
Draw on Fig. 1.4 to show how you could derive the value of catalase without copper(II) sulfate.
Answer
- Draw a horizontal line from the y-axis to the plateau of the upper curve (the without copper(II) sulfate curve). Label this line Vmax.
- Calculate the value of Vmax ÷ 2. Draw a second horizontal line at this height. Label this line ½Vmax.
- From the point where the ½Vmax line intersects the without copper(II) sulfate curve, drop a vertical line down to the x-axis. The point where this vertical line meets the x-axis is Km.
Three lines drawn: horizontal at Vmax, horizontal at ½Vmax, vertical from ½Vmax ∩ curve to x-axis labelled Km.
Background Concept
The Michaelis constant (Km) is defined as the substrate concentration at which the rate of the enzyme-catalysed reaction is half the maximum rate (½Vmax). It is a measure of the enzyme's affinity for its substrate: a low Km indicates high affinity (the enzyme reaches ½Vmax at a low substrate concentration) and a high Km indicates low affinity. On a Michaelis–Menten plot of rate (y) against substrate concentration (x), the standard graphical method to find Km is:
- Read the plateau height (= Vmax) and draw a horizontal line at that height.
- Calculate Vmax ÷ 2 and draw a horizontal line at ½Vmax.
- From the point where the ½Vmax line meets the curve, drop a vertical line to the x-axis. The x-value at the foot of this vertical line is Km.
Understanding the Question
Fig. 1.4 already shows two Michaelis–Menten curves: an upper one without copper(II) sulfate and a lower one with copper(II) sulfate. The student must add the construction lines needed to find the Km of catalase without the inhibitor — i.e. work on the upper curve.
Approach
Apply the three-step graphical procedure above to the upper curve. Be careful to draw the vertical line from the intersection of the ½Vmax line with the curve, not from the y-axis.
Step-by-Step Reasoning
- Step 1 — Vmax line: the upper curve plateaus at a high y-value. Draw a horizontal line from the y-axis across to that plateau and label the line Vmax.
- Step 2 — ½Vmax line: halve the y-value of Vmax. Draw a second horizontal line at this height and label it ½Vmax.
- Step 3 — vertical line to x-axis: where ½Vmax meets the upper curve, drop a vertical line down to the x-axis. Mark the foot of this vertical line on the x-axis and label it Km.
Key Takeaways
- Km is read off the x-axis at the substrate concentration that gives ½Vmax.
- Three lines: Vmax (horizontal), ½Vmax (horizontal), vertical from ½Vmax ∩ curve to x-axis.
- The labels Vmax, ½Vmax and Km must each be on the correct line.
Common Mistakes
- Drawing the vertical line from ½Vmax on the y-axis instead of from the intersection of ½Vmax with the curve.
- Drawing the construction on the wrong curve (the one with the inhibitor).
- Mis-labelling Vmax as ½Vmax or vice versa.
- Confusing Km with the substrate concentration at Vmax (it is the concentration at ½Vmax).
Things to Be Careful About
The mark scheme awards one mark for the three lines, one for Vmax or ½Vmax correctly labelled, and one for Km correctly labelled. Make sure each label is on the line it describes — examiners reject labels that float beside the wrong line.
The student concluded that copper(II) sulfate was a non-competitive inhibitor of catalase.
State the evidence in Fig. 1.4 that supports this conclusion.
Answer
- The Vmax (plateau) is lower in the presence of copper(II) sulfate than in its absence.
- The Km is the same (or very similar) with and without copper(II) sulfate.
Vmax is lower with the inhibitor; Km is the same. This is the kinetic signature of non-competitive inhibition.
Background Concept
Enzyme inhibitors fall into two main classes that are distinguished by their effect on the Michaelis–Menten kinetics:
- Competitive inhibitors bind to the active site and compete with substrate. They increase the apparent Km (the enzyme needs more substrate to reach ½Vmax) but the Vmax is unchanged — at high substrate concentrations the substrate outcompetes the inhibitor.
- Non-competitive inhibitors bind to a site other than the active site (an allosteric site). They reduce the Vmax (some enzyme molecules are permanently inactivated) but the Km is unchanged — the remaining active enzyme molecules bind substrate with the same affinity.
The classic diagnostic pair is therefore: lower Vmax + same Km = non-competitive; same Vmax + higher Km = competitive.
Understanding the Question
The student's experiment produced the two curves in Fig. 1.4 and the student has concluded that copper(II) sulfate is a non-competitive inhibitor. The question asks for the two pieces of evidence in Fig. 1.4 that support this conclusion. Both must be stated for full marks.
Approach
Compare the two curves in Fig. 1.4 for (i) the height of the plateau (Vmax) and (ii) the substrate concentration at ½Vmax (Km). State both findings explicitly.
Step-by-Step Reasoning
- Vmax comparison: the upper curve (without copper(II) sulfate) plateaus at a higher rate than the lower curve (with copper(II) sulfate). So Vmax is lower when the inhibitor is present.
- Km comparison: the substrate concentration at which each curve reaches ½Vmax is the same (or very nearly the same). So Km is unchanged.
- The pattern (lower Vmax, same Km) is the textbook signature of non-competitive inhibition. A competitive inhibitor would leave Vmax unchanged and push Km to the right; we do not see that here.
Key Takeaways
- Non-competitive inhibition: Vmax ↓, Km unchanged.
- Competitive inhibition: Vmax unchanged, Km ↑.
- Always state both pieces of evidence — one alone is not enough.
Common Mistakes
- Mentioning only the Vmax change and forgetting to state that Km is unchanged.
- Saying "Vmax is higher" (it is lower with the inhibitor).
- Saying "Km is lower" — Km is unchanged, not reduced.
- Mixing the two types of inhibition (calling the inhibitor competitive).
Things to Be Careful About
The mark scheme gives one mark for the Vmax observation and one for the Km observation; both must be correct to score both. Examiners also accept equivalent phrasings such as "the curve with copper(II) sulfate does not reach Vmax" for the first point.
The rest of this paper
1 more questions- Q2Planning · Analysis, Conclusions and Evaluation12M