Biology 9700/51 — May/June 2021
Cambridge A-Level · Planning, Analysis and Evaluation · worked solutions for every part, with the mark scheme
Topics Analysis, Conclusions and Evaluation · Planning
The enzyme -galactosidase catalyses the breakdown of the compound ONPG (o-nitrophenyl 1-D-galactopyranoside) to the compound ONP (o-nitrophenyl), as shown in Fig. 1.1.
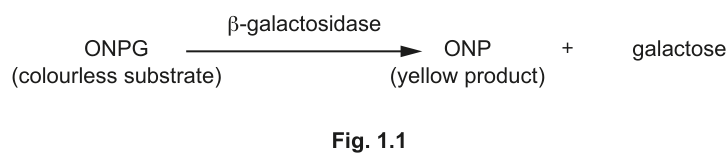
As ONP is produced, the colour of the reaction mixture changes to yellow. The intensity of the yellow colour produced is proportional to the concentration of ONP.
A colorimeter is used to measure the absorbance of the reaction mixture. Absorbance is a measure of the light absorbed by a coloured solution. In the reaction shown in Fig. 1.1, the more intense the yellow colour, the higher the absorbance.
A student was provided with a stock solution of the enzyme -galactosidase. The student diluted this by a factor of 20 using a buffer solution of pH 8. The student made a final volume of of dilute -galactosidase solution.
Describe how the student prepared the of diluted -galactosidase solution.
The student investigated the effect of substrate concentration on the enzyme-catalysed reaction shown in Fig. 1.1.
The student was provided with:
- the diluted -galactosidase solution prepared in step (a), which was kept cold until needed
- a stock solution of ONPG made up in a buffered solution of pH 8.0
- a buffer solution of pH 8.0.
The procedure used by the student is outlined in step 1 to step 3.
- The diluted -galactosidase solution was mixed with ONPG solution.
- After 2 minutes a colorimeter was used to measure the absorbance of this mixture.
- Steps 1 and 2 were repeated using different concentrations of ONPG solution.
Suggest why the student used a colorimeter to measure the absorbance rather than judging the intensity of the colour by eye.
Identify the independent variable and the dependent variable in this investigation.
independent variable = ______
dependent variable = ______
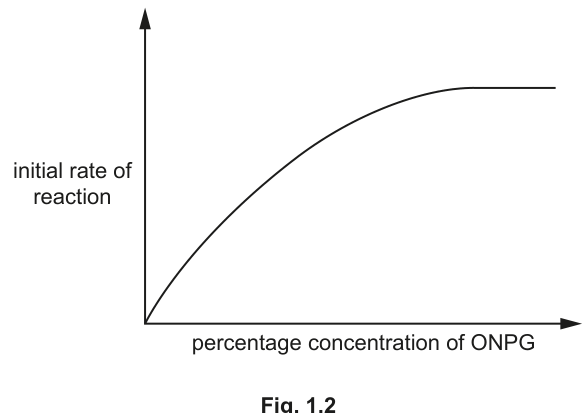
The student used the absorbance values at 2 minutes as the initial rates of reaction.
Fig. 1.2 shows the results.
The student decided to investigate the effect of inhibitors on the reaction shown in Fig. 1.1. The student planned to add an inhibitor, inhibitor X, to reaction mixtures containing different concentrations of ONPG solution.
Describe a method the student could use to collect the data needed to test the effect of inhibitor X in reaction mixtures containing different concentrations of ONPG solution.
The description of your method should be set out in a logical way and be detailed enough for another person to follow.
You should not repeat the details from (a) describing how to dilute the stock solution of -galactosidase.
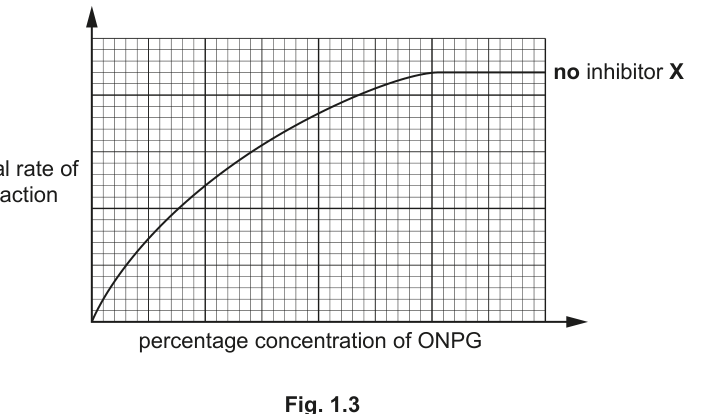
Fig. 1.3 shows the results when no inhibitor X was added.
The student suggested that inhibitor X was acting as a competitive inhibitor.
On Fig. 1.3, sketch the curve expected if inhibitor X was acting as a competitive inhibitor.
is the maximum initial rate of reaction of the enzyme.
The Michaelis-Menten constant, , is the substrate concentration at which the initial rate of reaction is half its maximum value, .
Draw on Fig. 1.3 the positions of and of the enzyme when no inhibitor X is present.
Use your graph to describe the effect of the addition of inhibitor X on the of this enzyme.
Acid reflux is a condition where some of the stomach contents are forced back up into the oesophagus (gullet). The main symptom is a burning pain in the oesophagus due to the acidic contents of the stomach. Acid reflux that happens more than twice a week is called gastroesophageal reflux disease (GERD).
Two main types of drug are used to treat GERD:
- proton pump inhibitors (PPIs)
- receptor antagonists (RAs).
Scientists carried out trials to investigate the effect of these drugs on the relief of acid reflux symptoms in people suffering with GERD.
- 200 people were randomly divided into two groups, A and B.
- People in group A were given the PPI medication.
- People in group B were given the RA medication.
- The trial lasted for 16 weeks.
- In weeks 4, 8, 12 and 16, the people were asked to score their symptoms, using the scale shown in Table 1.1.
Table 1.1
| scale | symptom |
|---|---|
| 1 | none |
| 2 | minimal |
| 3 | mild |
| 4 | moderate |
| 5 | moderately severe |
| 6 | severe |
| 7 | very severe |
- Mean values for each of the treatments A and B were calculated for weeks 4, 8, 12 and 16.
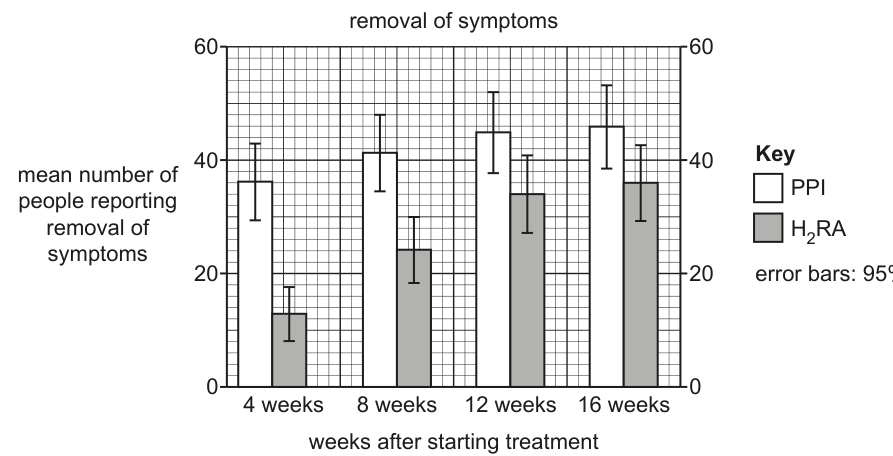
- People with a score of 1 were classified as showing removal of symptoms.
- People with a score of 2 or 3 were classed as showing improvement of symptoms.
The results of these trials are shown in Fig. 1.4 and Fig. 1.5.
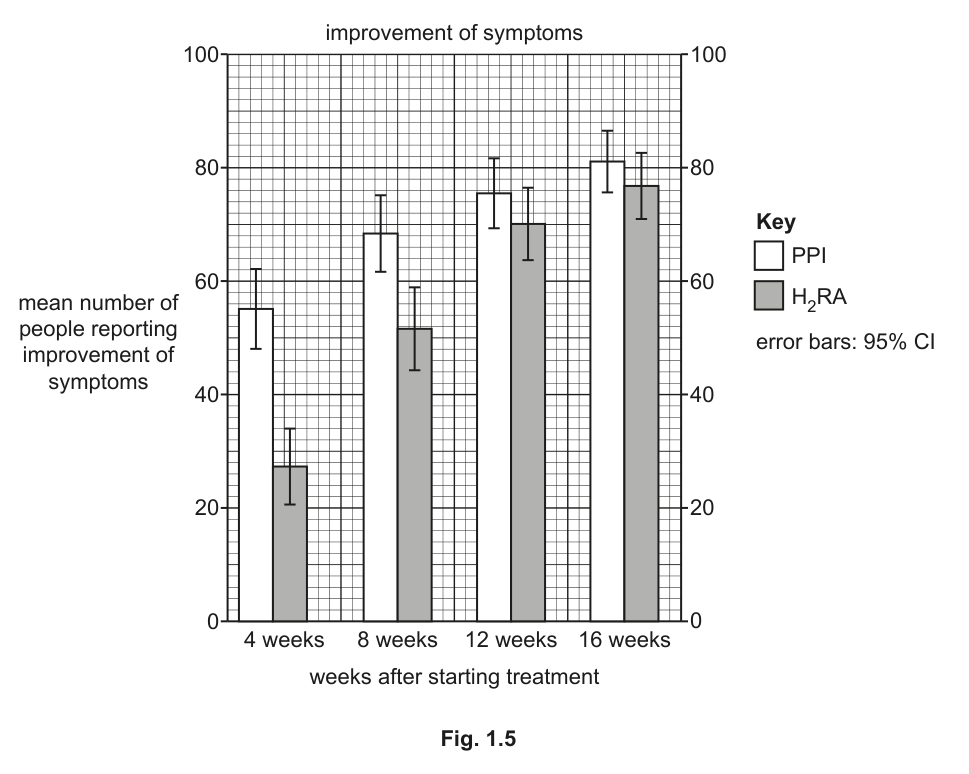
The scientists analysed the data and concluded that PPIs should be used to treat acid reflux rather than RAs.
With reference to the data in Fig. 1.4 and Fig. 1.5, discuss the conclusion that PPIs should be used to treat acid reflux.
The rest of this paper
1 more questions- Q2Analysis, Conclusions and Evaluation9M