Biology 9700/52 — February/March 2021
Cambridge A-Level · Planning, Analysis and Evaluation · worked solutions for every part, with the mark scheme
Topics Analysis, Conclusions and Evaluation · Planning
Students at a college often took a shortcut between the library and the tennis courts across an area of open land. The area of open land was covered by a large number of plants of a variety of different species. Walking over this area many times damaged the plants by trampling. As a result, a shortcut path formed across the area of open land between the library and tennis courts. This path was approximately one metre wide.
Fig. 1.1 shows a map of the area.
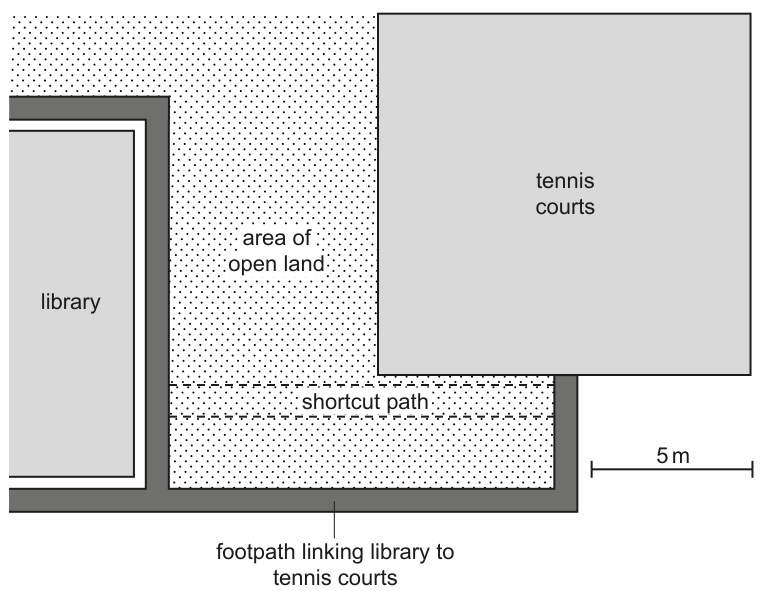
Some students decided to investigate the effect of trampling on the biodiversity of plant species growing in the area of open land.
State the data the students need to collect to assess the biodiversity of plant species.
State the independent variable in this investigation.
Describe a method the students could use to compare the biodiversity of plant species growing in the area of untrampled open land with the biodiversity of plant species growing on the shortcut path.
Your method should be set out in a logical order and be detailed enough to let another person follow it.
The students compared the drainage of water through soil from the shortcut path with the drainage of water through soil from the untrampled area of open land.
The students obtained soil samples by pushing tube-shaped cutters vertically down into the soil to a depth of . Each tube-shaped cutter had a diameter of . When removed, a cylinder of soil in length remained in each cutter.
Fig. 1.2 shows one of the tube-shaped cutters.
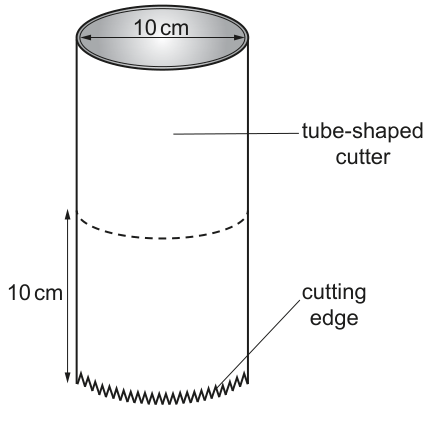
Soil samples were collected at random from the shortcut path and from the untrampled area of open land.
The students collected ten soil samples from each of the two areas.
Drainage was measured by pouring the same volume of water into the top of each of the tubes containing soil. The time taken for of water to drain through each tube was recorded.
Table 1.1 shows the results that the students recorded.
Table 1.1
| sample number | time for of water to drain through the soil / s | |
|---|---|---|
| shortcut path | untrampled area | |
| 1 | 125 | 75 |
| 2 | 148 | 82 |
| 3 | 192 | 69 |
| 4 | 130 | 70 |
| 5 | 185 | 80 |
| 6 | 177 | 90 |
| 7 | 202 | 72 |
| 8 | 120 | 58 |
| 9 | 132 | 76 |
| 10 | 152 | 66 |
| mean standard deviation |
From the results shown in Table 1.1, the students concluded that:
Trampling compresses the soil, reducing the size of air spaces. This means that water drains through the soil more slowly.
State one way that the results in Table 1.1 support the conclusion and one way that the results in Table 1.1 do not support the conclusion.
The students calculated the standard error () and 95% confidence intervals (95% CI) for the drainage data shown in Table 1.1. The formulae that the students used were:
Table 1.2 shows the calculated values for and 95% CI for the data from the shortcut path.
Table 1.2
| shortcut path | untrampled area | |
|---|---|---|
| standard error () / s | 9.6 | |
| 95% confidence intervals (95% CI) / s | 137.1 to 175.5 |
Complete Table 1.2 to show the calculated values for and 95% CI for the data from the untrampled area of open land.
Calculating 95% confidence intervals (95% CI) provides additional information for interpreting the results of investigations.
State the additional information about the data shown in Table 1.1 that can be gained from the calculated values of 95% CI.
In a further investigation, the students studied one species of plant growing in the area of open land. They noticed that some plants of this species had larger leaves than other plants of this species. They thought that the surface area of the leaves might be affected by the drainage of the soil.
The students collected 20 plants of this species at random. At each place where a plant had been collected, the students collected a deep soil sample using a tube-shaped cutter, as shown in Fig. 1.2.
For each plant, the students determined the surface area of the largest leaf.
Outline how the surface area of a leaf can be determined.
For each soil sample, the students measured the time taken for of water to drain through the soil sample, as described in (c).
The students calculated the Spearman’s rank correlation coefficient () for their data on leaf surface area and the time taken for of water to drain through the soil sample.
The students calculated the value as .
State the relationship between leaf surface area and the time taken for of water to drain through the soil sample that is suggested by an value that is less than zero.
Table 1.3 shows part of a table showing critical values of at different probabilities (). These critical values are used for testing the null hypothesis that there is no correlation between two sets of data.
Table 1.3
| number of pairs of items in the sample () | probability () | |||||
|---|---|---|---|---|---|---|
| 0.5 | 0.1 | 0.05 | 0.01 | 0.005 | 0.001 | |
| 8 | 0.310 | 0.643 | 0.738 | 0.881 | 0.905 | 0.976 |
| 9 | 0.267 | 0.600 | 0.700 | 0.833 | 0.867 | 0.933 |
| 10 | 0.248 | 0.564 | 0.648 | 0.794 | 0.830 | 0.903 |
| 11 | 0.236 | 0.536 | 0.618 | 0.755 | 0.800 | 0.873 |
| 12 | 0.217 | 0.503 | 0.587 | 0.727 | 0.769 | 0.846 |
| 18 | 0.170 | 0.401 | 0.472 | 0.600 | 0.643 | 0.728 |
| 19 | 0.165 | 0.391 | 0.460 | 0.584 | 0.628 | 0.712 |
| 20 | 0.161 | 0.380 | 0.447 | 0.570 | 0.612 | 0.696 |
| 21 | 0.156 | 0.370 | 0.435 | 0.556 | 0.599 | 0.681 |
| 22 | 0.152 | 0.361 | 0.425 | 0.544 | 0.586 | 0.667 |
To use Table 1.3, negative values must first be converted to positive values.
Using the positive value of 0.455, state and explain what can be concluded from Table 1.3 about the relationship between leaf surface area and the time taken for of water to drain through the soil sample.
The rest of this paper
1 more questions- Q2Planning · Analysis, Conclusions and Evaluation8M