Biology 9700/52 — October/November 2020
Cambridge A-Level · Planning, Analysis and Evaluation · worked solutions for every part, with the mark scheme
Topics Analysis, Conclusions and Evaluation · Planning
Some students observed a flowering plant and noticed that the flower was supported by a long stalk.
To investigate how the stalk supported the flower, the students first cut transverse sections of the stalk. The students then used a light microscope to observe the transverse sections of the stalk.
Fig. 1.1 shows a plan diagram of a transverse section of the stalk.
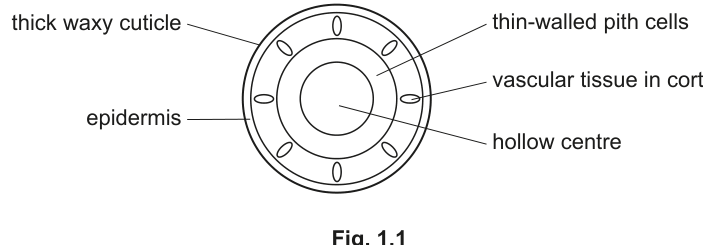
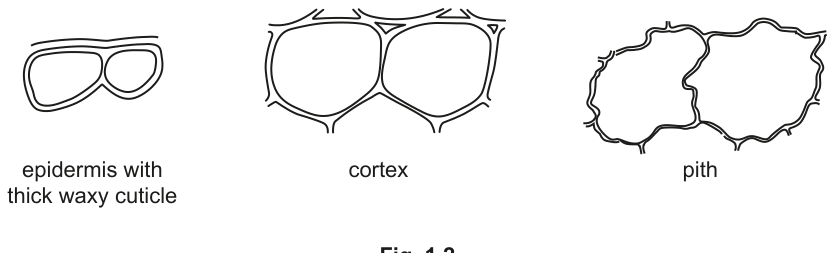
Fig. 1.2 shows the appearance of two cells from each of the layers.
The students cut out a piece of stalk that was long and then split this lengthways into 4 strips, as shown in Fig. 1.3.
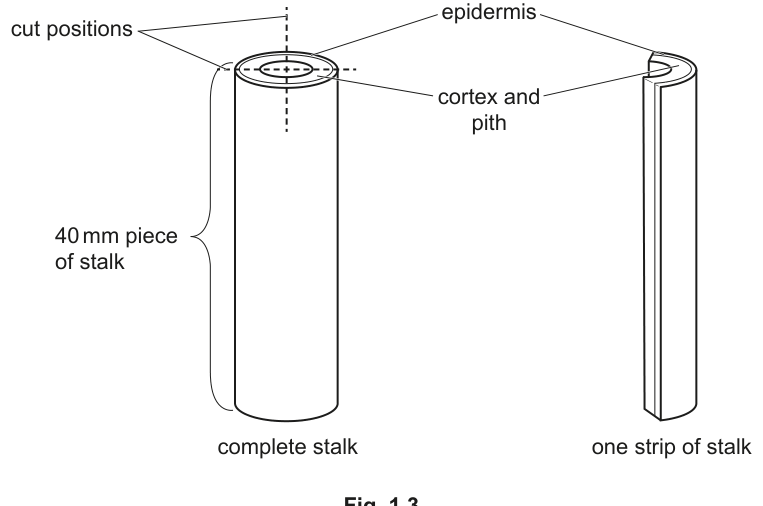
The students observed that the strips immediately curved lengthways so that the epidermis was on the inside of the curve.
All the strips were put into a Petri dish containing water and left for a period of time.
After soaking in water, the strips curved even further.
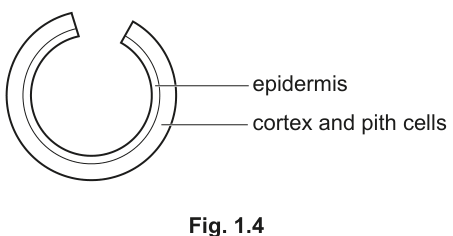
Fig. 1.4 shows the appearance of a strip after being soaked in water, viewed from one end.
State what conclusions can be made about the role of the stalk cells in supporting the flower.
In another investigation to find the water potential of the tissues in the flower stalk the students decided to:
- put strips in different concentrations of sucrose solution
- observe the direction and degree of curvature of the strips
- calculate the angle of curvature of the strips from photographs, using a mathematical procedure that they found on the internet.
The students were provided with a sucrose solution. They decided to use this to make a range of sucrose solutions. They made of each solution.
Suggest a suitable range of solutions the students should use and describe how these solutions could be made by proportional dilution of the sucrose solution.
State the independent variable and the dependent variable in this investigation.
independent variable ______
dependent variable ______
Using the different sucrose solutions from (b)(i), describe a method the students could use to collect the data needed to estimate the water potential of the tissues in the flower stalk.
Do not include details of how to make the sucrose solutions.
Your method should be set out in a logical order and be detailed enough to let another person follow it.
Fig. 1.5 shows the appearance of some strips of flower stalk after being immersed in high concentrations of sucrose solution and in low concentrations of sucrose solution.
The students measured the curvature of the epidermis of the strips.
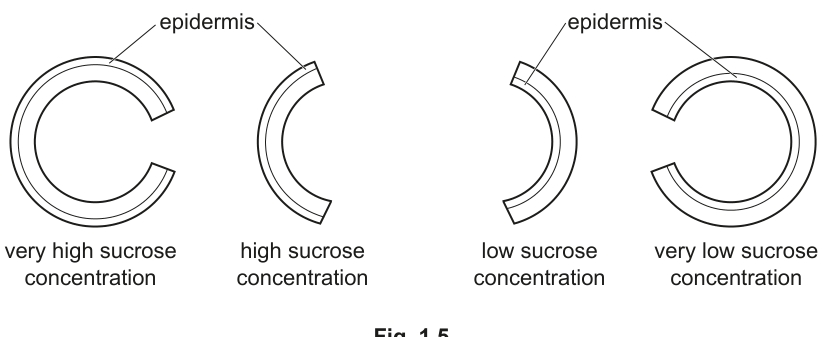
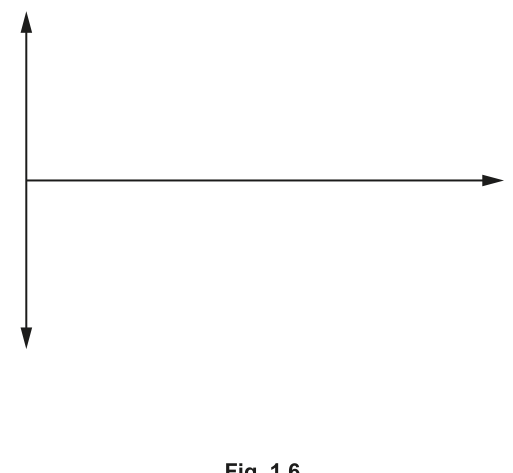
Sketch a graph on Fig. 1.6 of the expected results of immersing strips of the flower stalks in sucrose solutions of different concentration.
Include axes labels and units.
Indicate how this graph could be used to estimate the sucrose concentration equivalent to the water potential of the tissues in the flower stalk.
Predict the appearance of the strip in a sucrose solution that has the same water potential as the cells of the strip.
The rest of this paper
1 more questions- Q2Planning · Analysis, Conclusions and Evaluation11M