Biology 9700/43 — October/November 2020
Cambridge A-Level · A Level Structured Questions · worked solutions for every part, with the mark scheme
Topics Genetic Technology · Inheritance · Selection and Evolution · Classification, Biodiversity and Conservation · Control and Coordination · (outdated) Crop Plants · +3 more
Fig. 1.1 is a transverse section through a leaf from the maize plant, Zea mays.
Maize is a C4 plant.
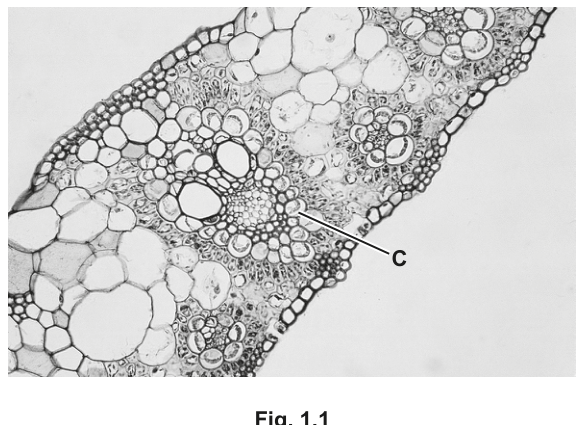
Fig. 1.1
On Fig. 1.1, use label lines and letters to show:
A – a cell in the epidermal layer
B – a cell that contains PEP carboxylase.
Answer
- A — label line drawn to a cell in the upper or lower epidermis.
- B — label line drawn to a mesophyll cell (PEP carboxylase is located in the cytoplasm of mesophyll cells in plants).
A → epidermal cell; B → mesophyll cell
Background Concept
In a plant leaf, the vascular bundle (xylem and phloem) is surrounded by a ring of large bundle sheath cells. This ring arrangement is called Kranz anatomy (German for 'wreath'). Around the bundle sheath, mesophyll cells are arranged in a more loosely packed layer, and the whole structure is enclosed by upper and lower epidermis. photosynthesis uses two cell types to fix : PEP carboxylase in the mesophyll cell cytoplasm fixes into oxaloacetate (a 4-carbon compound), which is transported to the bundle sheath where rubisco runs the Calvin cycle. The two cell types therefore carry out complementary halves of carbon fixation.
Understanding the Question
You are looking at a transverse section of a maize (Zea mays) leaf — a plant. You need to add two label lines: A to a cell in the epidermal layer, and B to a cell that contains PEP carboxylase. The key piece of knowledge is that PEP carboxylase is in the cytoplasm of mesophyll cells, not in the bundle sheath.
Approach
Identify the cell types visible in the micrograph from the outside in: epidermis (outermost single layer of cells at the top and bottom of the section), mesophyll (loosely arranged cells just inside the epidermis), bundle sheath (ring of large cells immediately around the vascular bundle). Then add label A to any epidermal cell and label B to any mesophyll cell.
Step-by-Step Reasoning
- PEP carboxylase is the initial -fixing enzyme in photosynthesis and is found in the cytoplasm of mesophyll cells.
- Bundle sheath cells, in contrast, contain rubisco and run the Calvin cycle — they do not contain PEP carboxylase.
- The epidermis is the outermost single layer of cells (often with a thickened cuticle on its outer face) and is the obvious target for label A.
- Therefore: A points to an epidermal cell, and B points to a mesophyll cell.
Key Takeaways
- In a leaf, PEP carboxylase is in mesophyll cells; rubisco is in bundle sheath cells.
- The anatomical division of labour between these two cell types is what allows plants to concentrate around rubisco and minimise photorespiration.
- Kranz anatomy is the visible ring of bundle sheath cells around each vascular bundle.
Common Mistakes
- Pointing label B at a bundle sheath cell — this would be wrong because bundle sheath cells contain rubisco, not PEP carboxylase.
- Confusing the epidermis with the bundle sheath — they are very different layers (epidermis is the outer single cell layer; bundle sheath is the ring of large cells around the vein).
- Pointing the label at a sub-epidermal cell rather than a true epidermal cell.
Things to Be Careful About
- Make sure label A ends clearly in a single cell of the outermost layer.
- The label line should not cross other features of the micrograph unnecessarily.
Identify the cell type labelled C in Fig. 1.1.
C = ______
Answer
C = bundle sheath (cell)
bundle sheath (cell)
Background Concept
In a leaf, the vascular bundle (xylem and phloem) is tightly wrapped by a ring of large, often thick-walled cells called bundle sheath cells. This ring is the defining feature of Kranz anatomy ('wreath anatomy'). The bundle sheath cells contain many chloroplasts and are the site of the Calvin cycle in plants.
Understanding the Question
The cell labelled C in Fig. 1.1 is one of the large cells immediately surrounding the vascular bundle. Identifying it correctly is a direct test of recognising Kranz anatomy in a maize leaf.
Approach
Look at the position of the labelled cell: it sits inside the ring of mesophyll cells and directly against the xylem and phloem of the vascular bundle. This is precisely the position occupied by a bundle sheath cell.
Step-by-Step Reasoning
- The vascular bundle is the cluster of xylem and phloem vessels in the centre of the section.
- The cells immediately surrounding the vascular bundle form a continuous ring — this is the bundle sheath.
- The cell labelled C is one of these ring-forming cells.
- Therefore C is a bundle sheath cell.
Key Takeaways
- The bundle sheath is the ring of cells immediately around the vascular bundle.
- Kranz anatomy = bundle sheath ring + surrounding mesophyll, characteristic of plants.
Common Mistakes
- Calling C a 'mesophyll cell' — the mesophyll is outside the bundle sheath ring, not inside it.
- Calling C a 'vascular cell' or 'xylem cell' — the labelled cell is around the vascular tissue, not part of it.
- Calling C a 'parenchyma cell' — too vague; the specific term is bundle sheath cell.
Things to Be Careful About
- The label C in the figure clearly points to a cell in the ring around the vein, so the answer is unambiguous as long as the candidate knows what a bundle sheath cell is.
Explain how the leaf anatomy shown in Fig. 1.1 adapts the C4 plant to maintain a high rate of photosynthesis at high temperatures.
Answer
Any four of:
- Mesophyll cells form a ring around the bundle sheath cells (Kranz anatomy).
- The bundle sheath cells are not in direct contact with the air spaces in the leaf, so cannot reach them.
- therefore cannot bind to RuBP / rubisco in the bundle sheath cells.
- This decreases / stops photorespiration.
- is highly concentrated in the bundle sheath cells, so rubisco acts as a carboxylase and not an oxygenase.
- AVP (e.g. PEP carboxylase has a high affinity for and works efficiently at high temperatures where rubisco's affinity for falls).
See working
Background Concept
At high temperatures, rubisco (the enzyme that normally fixes in the Calvin cycle) increasingly binds instead of . This is the oxygenase reaction, which produces 2-phosphoglycolate instead of glycerate-3-phosphate (GP), and the plant must recycle 2-phosphoglycolate at a metabolic cost — this wasteful process is photorespiration. plants minimise photorespiration by spatially separating the two stages of carbon fixation: PEP carboxylase in mesophyll cytoplasm fixes into oxaloacetate (a 4-carbon compound), which is shuttled to the bundle sheath where it releases . The bundle sheath thus contains a much higher concentration of than ordinary air, which favours rubisco's carboxylation reaction over its oxygenation reaction.
Understanding the Question
The question asks you to explain how the Kranz anatomy visible in Fig. 1.1 helps a plant keep photosynthesising fast at high temperatures. The link you need to make is: leaf structure → high / low in the bundle sheath → rubisco works in carboxylase mode → photorespiration is reduced → high rate of photosynthesis at high T.
Approach
Work through the causal chain: mesophyll ring around bundle sheath → bundle sheath not in direct contact with air → concentrated in bundle sheath / kept out → rubisco binds not → no photorespiration → high rate of photosynthesis maintained at high temperatures.
Step-by-Step Reasoning
- The mesophyll cells form a tight ring around the bundle sheath. This is the visible Kranz anatomy in Fig. 1.1.
- Because the bundle sheath is enclosed by mesophyll, the air spaces inside the leaf do not directly bathe the bundle sheath. So does not easily reach the bundle sheath cells (and produced by the bundle sheath chloroplasts cannot easily diffuse away).
- With little around rubisco, the oxygenase reaction is suppressed — cannot bind to RuBP at the active site of rubisco.
- As a result, photorespiration is reduced or stopped.
- Additionally, the pump (PEP carboxylase in mesophyll cytoplasm) delivers into the bundle sheath at high concentration, so rubisco sees much more than and the carboxylation reaction is strongly favoured. PEP carboxylase also has a much higher affinity for than rubisco, so it still works efficiently at the higher temperatures where rubisco's affinity for falls.
- Without photorespiration siphoning off fixed carbon, the plant can maintain a high net rate of photosynthesis even at temperatures where plants suffer.
Key Takeaways
- Kranz anatomy in leaves creates a high-, low- microenvironment around the bundle sheath chloroplasts.
- This suppresses the oxygenase activity of rubisco and therefore photorespiration.
- The result is a high net rate of photosynthesis at high temperatures, where plants lose carbon to photorespiration.
Common Mistakes
- Stating only that ' plants don't photorespire' without linking this to the anatomy shown in the figure.
- Saying ' cannot reach the bundle sheath' — this is the opposite of the truth; is pumped INTO the bundle sheath; it is that is excluded.
- Failing to mention the role of PEP carboxylase in concentrating .
- Not mentioning photorespiration by name — the question specifically asks about how the plant maintains a HIGH RATE at high T, which is the photorespiration argument.
Things to Be Careful About
- The question specifically asks how the ANATOMY adapts the plant, so at least one of the answer points should refer to the mesophyll ring around the bundle sheath (don't just talk about biochemistry).
- Mark scheme point 1 is 'decrease / stop, photorespiration' — be explicit that photorespiration is reduced, not just generally 'inefficient photosynthesis'.
Fig. 1.2 shows the results of an experiment comparing the rate of carbon dioxide uptake in a C3 plant (Chenopodium album) and a C4 plant (Amaranthus retroflexus) in high and low carbon dioxide () conditions.
The rate of uptake is used to measure the rate of photosynthesis.
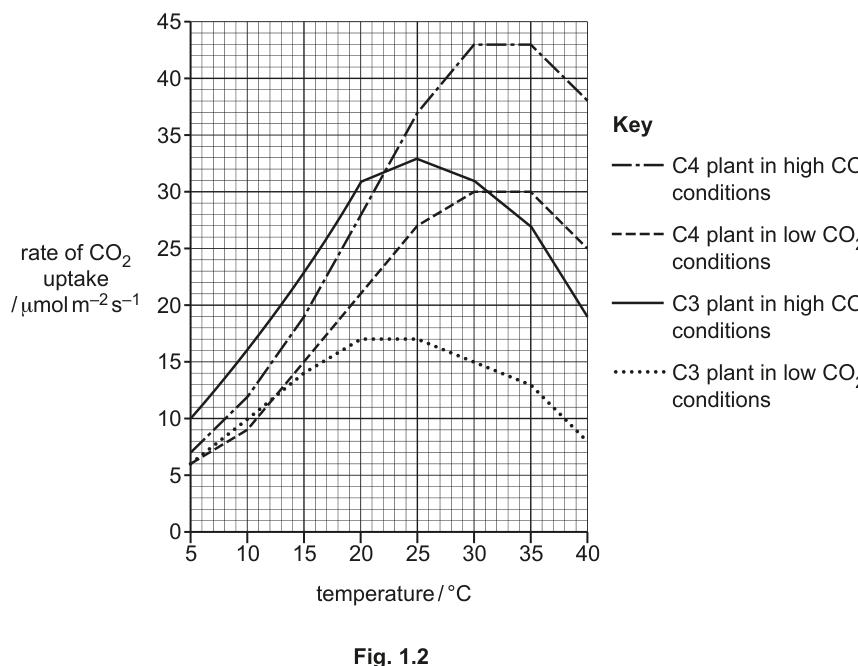
Fig. 1.2
Using Fig. 1.2, compare the rates of photosynthesis in high conditions in the C3 and C4 plants.
Answer
Any four of:
- In both plants the rate of uptake increases as temperature rises from 5 °C up to about 25 °C.
- At low temperatures (below about 22 °C) the plant has the higher rate.
- At high temperatures (above about 22 °C) the plant has the higher rate.
- The plant's optimum temperature is about 25 °C, while the plant's optimum is 30–35 °C.
- The plant has a lower maximum rate (peak ≈ 33 µmol m⁻² s⁻¹) than the plant (peak ≈ 45 µmol m⁻² s⁻¹).
- has a lower optimum temperature than .
- Data quote — e.g. at 25 °C the rate (~33 µmol m⁻² s⁻¹) exceeds the rate (~30 µmol m⁻² s⁻¹); at 35 °C the rate (~45) far exceeds the rate (~25).
See working
Background Concept
Photosynthesis is affected by several limiting factors including temperature, light intensity and concentration. As temperature rises, the rate of the light-independent reactions (Calvin cycle) increases because the enzymes involved (notably rubisco) work faster — up to an optimum, beyond which the enzymes begin to denature. plants are particularly sensitive to high temperatures because rubisco's affinity for falls relative to as temperature rises, so photorespiration increases sharply. plants, with their -concentrating mechanism, are buffered against this and so can maintain high rates of photosynthesis at much higher temperatures than plants.
Understanding the Question
You are asked to compare the (Chenopodium album) and (Amaranthus retroflexus) curves in HIGH only. Two of the curves in Fig. 1.2 represent these conditions (the two labelled 'high conditions'). You need to pick out specific features — where each curve rises, peaks and falls, the maximum rates, and the temperatures at which one curve overtakes the other.
Approach
Read both curves carefully across the temperature axis. Note (a) the shape of each curve (rise then fall), (b) the temperature of the peak (optimum), (c) the height of the peak (maximum rate) and (d) the relative positions of the two curves at low vs high temperatures.
Step-by-Step Reasoning
- At 5 °C the rate is about 10 µmol m⁻² s⁻¹ and the rate is about 6 µmol m⁻² s⁻¹ — already has the higher rate at low temperature.
- Both curves rise as temperature increases. The curve rises steeply and reaches its peak at 25 °C (~33 µmol m⁻² s⁻¹); the curve rises more slowly initially and continues rising past 25 °C, reaching its peak at 30–35 °C (~45 µmol m⁻² s⁻¹).
- The two curves cross at around 22 °C — below this, > ; above this, > .
- Above the optimum, the curve falls sharply (down to ~20 µmol m⁻² s⁻¹ at 40 °C) while the curve falls only slightly (down to ~38 µmol m⁻² s⁻¹ at 40 °C).
- Summary of comparisons:
- Optimum temperature: ≈ 25 °C vs = 30–35 °C ( has a lower optimum).
- Maximum rate: ≈ 33 vs ≈ 45 µmol m⁻² s⁻¹ ( has a lower maximum).
- At low T (< 22 °C): > .
- At high T (> 22 °C): > .
Key Takeaways
- plants outperform plants at low temperatures.
- plants outperform plants at high temperatures.
- plants have both a higher optimum temperature and a higher maximum rate in high conditions.
- This difference reflects the plant's resistance to photorespiration, which becomes severe in plants at high temperature.
Common Mistakes
- Comparing the plant in high with the plant in low (or vice versa) — the question restricts the comparison to HIGH only.
- Saying ' is always lower' — this is wrong below 22 °C.
- Failing to give a data quote — at least one of the four marking points should include numerical support.
- Just describing one curve rather than comparing — every point should refer to both plants.
Things to Be Careful About
- The question asks for COMPARISON — every marking point should say something about both plants, not just describe one.
- A correct answer usually has 2–3 points about the plant (its shape, optimum, maximum) and 2–3 points about the plant, plus a data quote.
Using Fig. 1.2, compare the rates of photosynthesis in low and high conditions in the C4 plant between and and suggest an explanation for this difference.
Answer
Comparison:
- Between 30 °C and 35 °C the plant's rate of uptake is higher / faster in high than in low (e.g. ~45 vs ~30 µmol m⁻² s⁻¹); both curves reach their maximum rate in this temperature range.
Explanation:
- is the limiting factor in the low conditions, so increasing increases the rate.
See working
Background Concept
A limiting factor is the variable that, at a given moment, is restricting the rate of a process. For photosynthesis, the three classic limiting factors are light intensity, concentration and temperature. If is in short supply, raising the temperature further will not increase the rate of photosynthesis because the dark reactions cannot proceed without more substrate. Conversely, if is abundant, the dark reactions run as fast as the temperature-controlled enzymes allow.
Understanding the Question
You are asked to compare the plant in low and high specifically between 30 °C and 35 °C, and then explain the difference. The two relevant curves are the dashed line ( in low ) and the dash-dot line ( in high ).
Approach
Read the values for the two curves in the 30–35 °C window, note the difference, and then identify which of the two variables ( in this case) is the factor holding the rate back in the lower curve.
Step-by-Step Reasoning
- Between 30 °C and 35 °C the plant in high reaches its maximum of ~45 µmol m⁻² s⁻¹ (the curve plateaus at the top).
- The plant in low also reaches its maximum in this range but at a much lower value of ~30 µmol m⁻² s⁻¹.
- So in the high- condition the rate is higher (≈ 45 vs ≈ 30 µmol m⁻² s⁻¹).
- The two curves both peak in this temperature range, which means temperature is not the limiting factor at 30–35 °C — temperature has been 'saturated' in the sense that it is no longer the bottleneck.
- The only variable that has been deliberately changed between the two curves is , so must be the limiting factor in the low- condition. Increasing from low to high therefore increases the rate.
Key Takeaways
- When two curves for the same plant differ only in , is the limiting factor.
- The peak of both curves at 30–35 °C tells you that temperature is no longer the limiting factor in that range — it is the combination of light and that controls the maximum rate.
Common Mistakes
- Saying 'temperature is the limiting factor' — the curves peak in the 30–35 °C range, so temperature is not the limiting factor there; the rates are at their maximum.
- Giving the explanation without the comparison (or vice versa) — both are needed for the two marks.
- Saying the rate is 'slower because the plant is not getting enough light' — light intensity is not the variable being changed in the experiment.
- Saying 'because plants need ' — too vague; the specific point is that is the limiting factor.
Things to Be Careful About
- A data quote helps: 'in high the rate is ~45 µmol m⁻² s⁻¹ compared with ~30 µmol m⁻² s⁻¹ in low ' is a strong answer.
- Keep the comparison to the 30–35 °C range; do not stray into other temperature ranges.
The rest of this paper
9 more questions- Q2Selection and Evolution · Inheritance · Genetic Technology14M
- Q3Selection and Evolution · Classification, Biodiversity and Conservation · Genetic Technology8M
- Q4Inheritance · Genetic Technology11M
- Q5Inheritance10M
- Q6Control and Coordination12M
- Q7Energy and Respiration8M
- Q8Classification, Biodiversity and Conservation9M
- Q9Genetic Technology15M
- Q10Control and Coordination · Homeostasis15M