Biology 9700/53 — October/November 2019
Cambridge A-Level · Planning, Analysis and Evaluation · worked solutions for every part, with the mark scheme
Topics Analysis, Conclusions and Evaluation · Planning
A group of students investigated the growth of different varieties of yeast.
The students learned that the rate of respiration in a yeast culture is proportional to the biomass of the culture. Respiration rate can be used as a measure of the growth of a yeast culture.
Respiration rates can be measured using the redox indicator TTC.
- During respiration, hydrogen ions are removed from glucose to reduce hydrogen carriers such as NAD and FAD.
- A redox indicator can be used as a hydrogen carrier in experimental conditions instead of NAD or FAD.
- The colour change of the redox indicator can be measured using a colorimeter.
The students carried out a preliminary experiment using a redox indicator to monitor the growth of a yeast culture over time.
The yeast was grown in a liquid culture in a conical flask, as shown in Fig. 1.1.
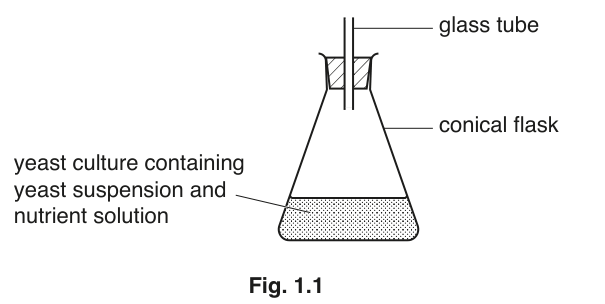
- Different masses of yeast were added to a fixed volume of distilled water to give different concentrations of yeast in suspension.
- Each yeast suspension was added to a separate flask of nutrient solution containing glucose.
- A redox indicator was added to each flask and the flasks were incubated at a constant temperature for a fixed period of time.
- The colour of each suspension was monitored over the incubation period using a colorimeter.
- A colorimeter passes a beam of light through a coloured filter into a solution and measures the light absorbance of that solution.
- A standard solution is used to set the colorimeter scale to zero (0) before taking any measurements.
State the independent variable and the dependent variable in this investigation.
independent = ______
dependent = ______
Identify two variables that the students have standardised in their investigation.
Suggest a suitable control for this investigation.
Samples were taken from the flask at intervals and the absorbance was measured in the colorimeter.
As the yeast respires, the redox indicator TTC changes from colourless to pink.
Sketch a graph on Fig. 1.2 to show the expected change in absorbance over time during the incubation of yeast. Label the axes.
Three different varieties of yeast, commonly used in food manufacture, are compressed yeast, active dry yeast and instant yeast.
The students decided to compare the growth rates of the three different varieties of yeast by measuring their respiration rate. They decided to use TTC as the redox indicator.
Describe a method that students could use to compare the respiration rates of the three varieties of yeast.
Your method should be set out in a logical order and be detailed enough to let another person follow it.
The students found that compressed yeast gave the highest rate of respiration.
The students then carried out two further experiments to find the best conditions for growth of compressed yeast.
In both experiments absorbance was measured in arbitrary units (a.u.). The higher the absorbance the greater the respiration rate. Respiration is proportional to the growth rate of the yeast.
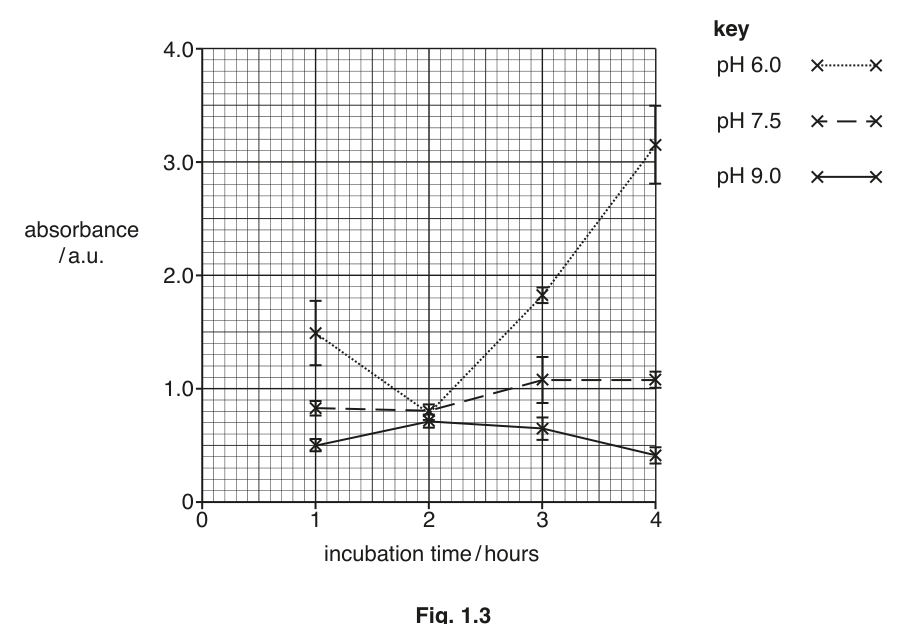
In the first experiment they investigated the effect of changing pH and incubation time at a constant temperature of .
The results of the first experiment are shown in Fig. 1.3.
In the second experiment the students investigated the effect of changing pH and temperature at a constant incubation time of 4 hours.
The results of the second experiment are shown in Table 1.1.
Table 1.1
| temperature / | pH 6.0 absorbance / a.u. | pH 6.0 | pH 7.5 absorbance / a.u. | pH 7.5 | pH 9.0 absorbance / a.u. | pH 9.0 |
|---|---|---|---|---|---|---|
| 22 | 2.28 | 1.10 | 1.40 | |||
| 30 | 3.16 | 0.50 | 0.94 | |||
| 40 | 1.10 | 0.40 | 0.54 | |||
| 50 | 0.48 | 0.40 | 0.28 |
State what the standard error () shows.
The graph in Fig. 1.3 shows the 95% confidence intervals for the data.
95% confidence interval =
State what this indicates about the data.
After completing these two experiments the students concluded that the growth rate of yeast is highest when incubated at and pH 6.0 for 4 hours.
State two ways in which the data support this conclusion.
The rest of this paper
1 more questions- Q2Analysis, Conclusions and Evaluation12M