Biology 9700/51 — October/November 2019
Cambridge A-Level · Planning, Analysis and Evaluation · worked solutions for every part, with the mark scheme
Topics Planning · Analysis, Conclusions and Evaluation
Chlorella is a photosynthetic, single-celled protoctist that lives in ponds.
A group of students decided to investigate the effect of temperature on respiration in Chlorella.
The students were provided with:
- test-tubes
- metal foil
- flat-bottomed tubes with lids
- glass beakers
- hot water supply
- thermometers
- timer
- pH probe and meter
- hydrogencarbonate indicator solution in a closed container
- a pump connected to an oxygen supply
- a pump connected to a carbon dioxide supply
- a suspension of Chlorella with a known cell density.
Carbon dioxide is an acidic gas so it causes the pH of the hydrogencarbonate indicator solution to change. The indicator solution changes colour as pH changes.
Fig. 1.1 shows the range of colours seen in hydrogencarbonate indicator exposed to different carbon dioxide concentrations.
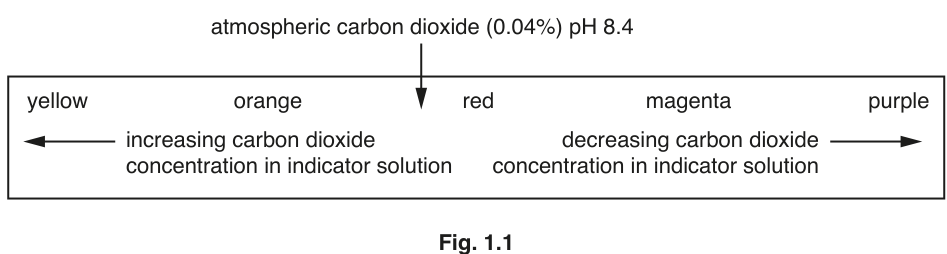
The students made a series of colour standards from yellow to purple by bubbling different volumes of carbon dioxide gas into the indicator solution. The pH was measured with a pH meter for each colour and the solutions were sealed in flat-bottomed tubes labelled with their pH.
The students used the indicator solution to investigate the effect of temperature on carbon dioxide production during respiration in Chlorella.
Suggest a hypothesis that the students could test in this investigation.
State the independent variable and the dependent variable in this investigation.
independent variable = ______
dependent variable = ______
Describe how the students could use the apparatus provided to investigate the effect of temperature on carbon dioxide production during respiration in Chlorella.
Your method should be set out in a logical order and be detailed enough to let another person follow it.
Details of making the colour standards should not be included in your method.
State how the students could calculate the rate of respiration from their results.
Sketch a graph on Fig. 1.2 to show the expected result of the effect of temperature on the rate of respiration of Chlorella.
Include suitable axes labels and units on your graph.

The students carried out a second investigation to determine the effect of cell density on the carbon dioxide production of suspensions of Chlorella. All the suspensions were kept at a constant temperature. The students used a probe to measure the production of carbon dioxide in the suspensions of Chlorella.
The results are shown in Table 1.1.
Table 1.1
| cell density in suspension / arbitrary units | carbon dioxide concentration after | rate of carbon dioxide production / |
|---|---|---|
| 10 | 2.0 | 0.13 |
| 20 | 2.4 | 0.16 |
| 30 | 3.0 | 0.20 |
| 40 | 4.7 | |
| 50 | 7.4 | 0.49 |
Complete Table 1.1 by calculating the rate of carbon dioxide production for the cell density of 40 arbitrary units.
The students used Pearson’s linear correlation to test the hypothesis:
As cell density increases the rate of carbon dioxide production increases.
Suggest a null hypothesis for this test.
The Pearson’s linear correlation coefficient () was calculated as 0.85.
State what the calculated value, , indicates about the results.
The students concluded that the results showed that their hypothesis is correct.
Explain why this conclusion may not be valid.
The rest of this paper
1 more questions- Q2Planning · Analysis, Conclusions and Evaluation10M