Biology 9700/51 — May/June 2019
Cambridge A-Level · Planning, Analysis and Evaluation · worked solutions for every part, with the mark scheme
Topics Planning · Analysis, Conclusions and Evaluation
A group of six students carried out an experiment to determine their reaction times using a ruler.
Fig. 1.1 shows the basic procedure used for the experiment.
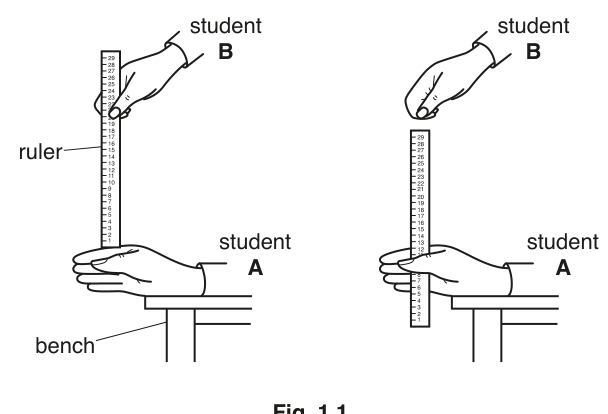
The students worked in pairs.
• Student A rested their hand on a bench.
• Student B then dropped a ruler from a set height.
• Student A had to catch the ruler as quickly as possible.
• The distance the ruler had dropped was measured and recorded.
• The students calculated their reaction times.
The formula for calculating reaction time in seconds is shown in Fig. 1.2.
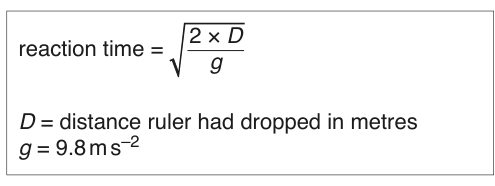
Table 1.1 shows the results for the six students.
Table 1.1
| student | distance ruler had dropped/m | reaction time/ s |
|---|---|---|
| 1 | 0.17 | 0.19 |
| 2 | 0.10 | 0.14 |
| 3 | 0.16 | 0.18 |
| 4 | 0.08 | |
| 5 | 0.16 | 0.18 |
| 6 | 0.35 | 0.27 |
Use the formula in Fig. 1.2 to complete Table 1.1.
Predict what would happen to the reaction time if the ruler was held higher than the original set height.
There was some background noise in the classroom when the students carried out their experiment. The students thought that this noise might have affected their reaction times. They decided to modify their original experiment to find out if the presence or absence of background noise affects reaction time.
Identify the dependent variable in this investigation.
Using the procedure shown in Fig. 1.1, describe a method that the students could use to find out if the presence or absence of background noise affects reaction time.
Your method should be set out in a logical order and be detailed enough for another person to follow.
Fig. 1.3 shows some results for a reaction time test that the students found on the internet.
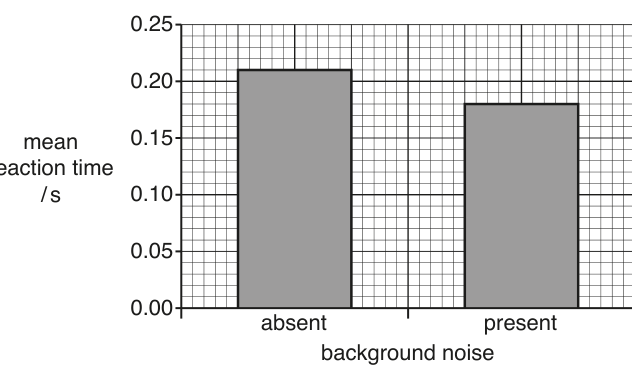
State why a bar chart is a suitable way to show the data.
Suggest one conclusion the students could have made based on these results.
The students decided to carry out a -test to find out if the difference in reaction time was significant.
State why a -test is suitable for these data.
State a null hypothesis for this test.
Table 1.2 shows some probability values of .
Table 1.2
| degrees of freedom | 10 | 12 | 14 | 16 | 18 | 20 | 22 | 24 | 26 | 28 | 30 | 40 | 50 | 60 |
|---|---|---|---|---|---|---|---|---|---|---|---|---|---|---|
| probability 0.05 | 2.23 | 2.18 | 2.14 | 2.12 | 2.10 | 2.09 | 2.07 | 2.06 | 2.06 | 2.05 | 2.04 | 2.02 | 2.01 | 2.00 |
The students used 16 degrees of freedom and calculated .
State and explain what the value of indicates about the difference in mean reaction times shown in Fig. 1.3.
Another student, when carrying out the ruler experiment shown in Fig. 1.1, noticed that the more repetitions carried out, the faster the reaction time became.
The student decided to carry out a different experiment to investigate the effect of repetition on the accuracy of carrying out a task.
Five students, V, W, X, Y and Z were tested.
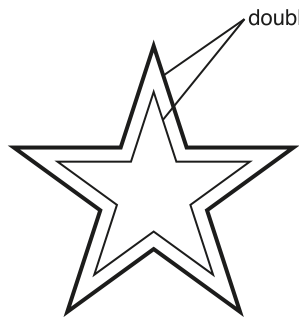
• Each student was given a picture of a star, as shown in Fig. 1.4.
• Each student sat at a desk so that the star was only visible in a mirror, as shown in Fig. 1.5.
• Each student was asked to draw between the double lines of the star when looking at it only in the mirror. Fig. 1.6 shows a star diagram completed by a student.
• The students recorded the number of times their lines went outside the double line of the star.
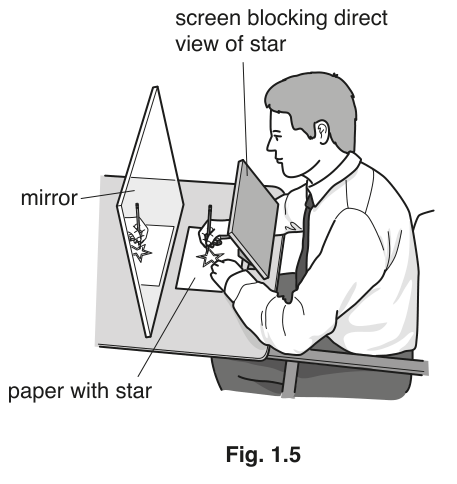
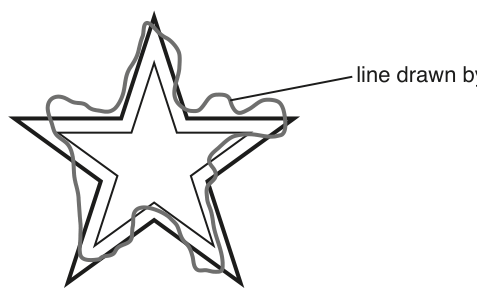
Each student repeated the task nine times on the same day. The results are shown in Table 1.3.
Table 1.3
| student | number of times the students' lines went outside the double lines of the star | ||||||||
|---|---|---|---|---|---|---|---|---|---|
| 1 | 2 | 3 | 4 | 5 | 6 | 7 | 8 | 9 | |
| V | 48 | 48 | 46 | 44 | 42 | 40 | 41 | 41 | 41 |
| W | 45 | 42 | 43 | 40 | 38 | 35 | 36 | 35 | 35 |
| X | 38 | 37 | 34 | 32 | 31 | 30 | 28 | 28 | 28 |
| Y | 31 | 30 | 31 | 29 | 44 | 28 | 26 | 25 | 25 |
| Z | 41 | 40 | 38 | 37 | 35 | 35 | 33 | 33 | 32 |
Identify the independent variable in this experiment.
Suggest the hypothesis that was tested in this experiment.
A person walked into the room and started talking to one of the students who was carrying out the test.
Circle the result in Table 1.3 that was affected by this.
One of the students had previously carried out a similar task.
Identify this student and give a reason for your answer.
student ______
reason ______
State two conclusions based on the data in Table 1.3.
The rest of this paper
1 more questions- Q2Analysis, Conclusions and Evaluation · Planning9M