Biology 9700/53 — October/November 2018
Cambridge A-Level · Planning, Analysis and Evaluation · worked solutions for every part, with the mark scheme
Topics Planning · Analysis, Conclusions and Evaluation
Transpiration in plants can be investigated using a potometer, which measures water uptake by plants. Fig. 1.1 shows a potometer that was used by a student.
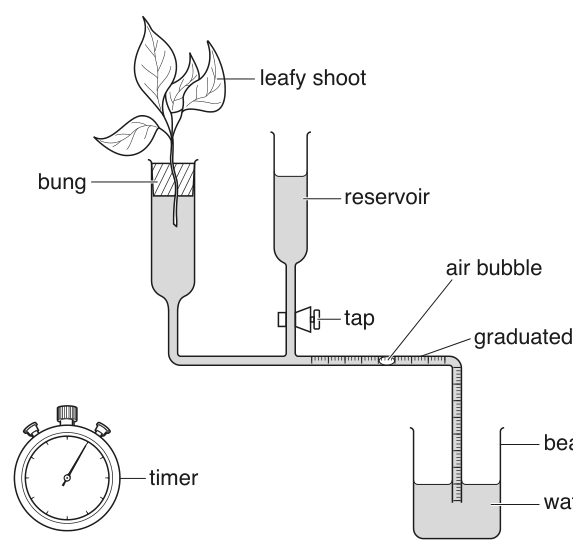
As water is lost by the leaves through transpiration, the air bubble moves along the graduated tube.
The student used this apparatus to investigate the effect of light intensity on the rate of transpiration in plants.
State the independent variable and the dependent variable in this investigation.
independent = ______
dependent = ______
List three variables that should be controlled in this investigation and describe how the student could standardise two of these variables.
Describe how the student could set up and use the potometer shown in Fig. 1.1 to investigate the rate of transpiration at different light intensities.
Your method should be set out in a logical way and be detailed enough to let another person follow it.
The student carried out further experiments, using the same apparatus, to investigate the effect of two different environmental carbon dioxide concentrations on the rate of transpiration. These experiments were carried out at a high light intensity and at a low light intensity.
The leafy shoots used in the experiments were taken from the same plant and each shoot had five leaves.
The student calculated the percentage reduction in the transpiration rate from to of carbon dioxide at low light intensities.
The results are shown in Table 1.1.
Table 1.1
| concentration of carbon dioxide / | light intensity | transpiration rate / | percentage reduction in transpiration rate from to of carbon dioxide |
|---|---|---|---|
| 50 | low | 1.28 | |
| 730 | low | 0.81 | 36.7 |
| 50 | high | 3.03 | |
| 730 | high | 2.12 |
Complete Table 1.1 by calculating the percentage reduction in transpiration rate from to of carbon dioxide at the high light intensity.
Show your working.
The student concluded that, as carbon dioxide concentration increased, the transpiration rate in plants decreased at all light intensities.
Explain why this conclusion may not be valid.
The rest of this paper
1 more questions- Q2Planning · Analysis, Conclusions and Evaluation15M