Biology 9700/52 — October/November 2018
Cambridge A-Level · Planning, Analysis and Evaluation · worked solutions for every part, with the mark scheme
Topics Planning · Analysis, Conclusions and Evaluation
Fig. 1.1 shows apparatus that can be used to measure the loss of water vapour from leaves.
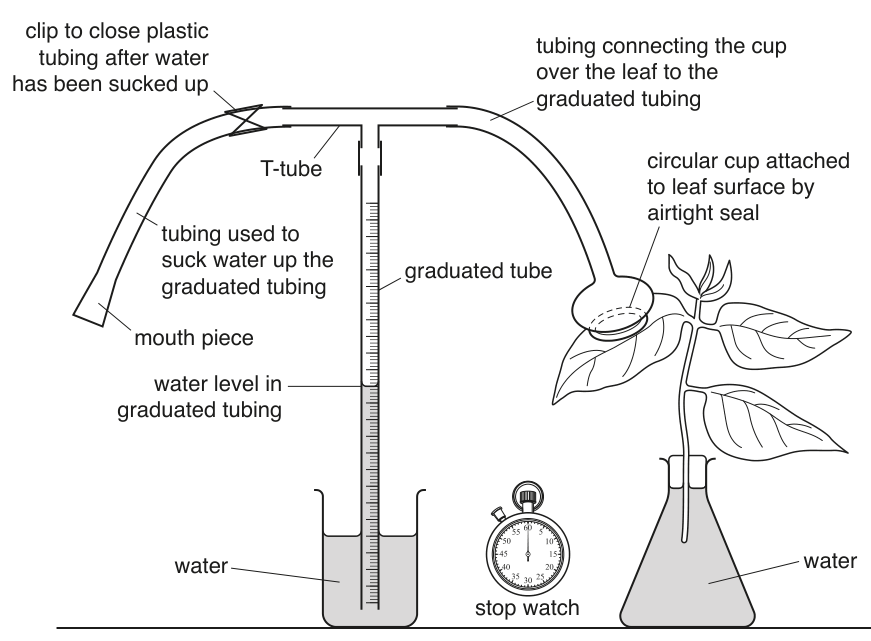
Fig. 1.1
The water vapour given out by the area of leaf under the cup increases the pressure inside the tubing, causing the water level in the graduated tube to go down.
Some students used the apparatus in Fig. 1.1 to test the hypothesis:
The loss of water vapour from the lower surface of the leaves of a plant is greater per unit time than the loss of water vapour from the upper surface of the leaves of the same plant.
State the independent variable and the dependent variable in this investigation.
independent variable = ______
dependent variable = ______
Describe a method by which the students could use the apparatus shown in Fig. 1.1 to measure loss of water vapour in order to test the hypothesis.
Your method should be set out in a logical order and be detailed enough to let another person follow it.
The hypothesis that the students tested was:
The loss of water vapour from the lower surface of the leaves of a plant is greater per unit time than the loss of water vapour from the upper surface of the leaves of the same plant.
The students decided that, to make a valid comparison, they needed to work out the water loss per unit time per unit area of leaf.
Describe how the students obtained the measurement needed to work out the results as per unit area of leaf.
Describe how the students could use this measurement and their results for the loss of water vapour to find out if their results support the hypothesis.
Sketch a bar chart on Fig. 1.2 to show the results if the hypothesis was supported.
You should include the axis labels and the units.
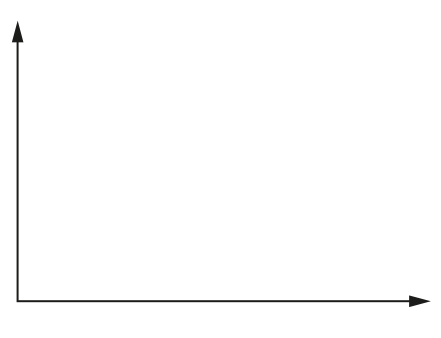
Fig. 1.2
The apparatus shown in Fig. 1.1 was used in another series of experiments to measure water vapour loss from the same leaf in different experimental conditions for the same period of time.
Table 1.1 shows the results.
Table 1.1
| experimental condition | distance moved by water column / cm per unit time | ||||
|---|---|---|---|---|---|
| trial 1 | trial 2 | trial 3 | trial 4 | trial 5 | |
| high light intensity | 7.3 | 7.5 | 7.8 | 6.2 | 7.0 |
| no light | 0.0 | 0.0 | 1.5 | 0.2 | 0.0 |
| high temperature | 4.4 | 2.8 | 3.2 | 4.8 | 3.1 |
| strong air current | 1.5 | 2.4 | 1.1 | 0.9 | 1.0 |
On Table 1.1, draw circles around two of the values that may be anomalous.
The aperture of stomata affects the loss of water vapour.
State one conclusion that can be made about the effect of experimental conditions on the aperture of stomata in this plant.
The rest of this paper
1 more questions- Q2—11M