Biology 9700/51 — October/November 2018
Cambridge A-Level · Planning, Analysis and Evaluation · worked solutions for every part, with the mark scheme
Topics Planning · Analysis, Conclusions and Evaluation
Transpiration in plants can be investigated using a potometer, which measures water uptake by plants. Fig. 1.1 shows a potometer that was used by a student.
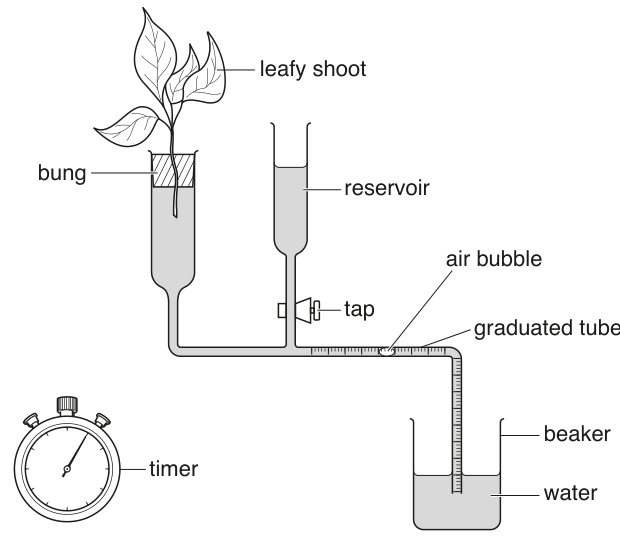
As water is lost by the leaves through transpiration, the air bubble moves along the graduated tube.
The student used this apparatus to investigate the effect of light intensity on the rate of transpiration in plants.
State the independent variable and the dependent variable in this investigation.
independent = ______
dependent = ______
Answer
- Independent variable: light intensity.
- Dependent variable: distance moved by the bubble in a set time (or time taken for the bubble to move a set distance).
independent = light intensity; dependent = distance moved by the bubble in a set time (or time for the bubble to move a set distance)
Background Concept
An experiment tests how changing one factor (the independent variable) affects another (the dependent variable). The independent variable is what the experimenter deliberately changes; the dependent variable is what is measured as the response. All other variables are kept constant (controlled) so any change in the dependent variable can be attributed to the independent variable.
In this investigation, the student uses a potometer — an apparatus that measures water uptake by a leafy shoot. As the leaves transpire, water is pulled up the xylem from the tube, drawing the air bubble along the graduated capillary. Because water uptake is closely matched by water loss through transpiration (assuming the cells remain turgid), the bubble's movement is used as a proxy for the transpiration rate.
Understanding the Question
The student wants to investigate the effect of light intensity on transpiration rate. Part (i) simply asks for the two variables that define this investigation: the one being deliberately changed (the independent variable) and the one being measured (the dependent variable).
Approach
Identify the factor the experimenter is manipulating — this is given in the question stem as light intensity. Then identify the measured response — this must come from the apparatus shown in Fig. 1.1. The bubble moving along the graduated tube is the only measurement the potometer directly provides.
Step-by-Step Reasoning
- Independent variable: light intensity. This is what the student varies (e.g. by changing the lamp's distance from the shoot). The stem explicitly states that light intensity is the factor being investigated.
- Dependent variable: distance moved by the bubble in a set time, or time taken for the bubble to move a set distance. The potometer does not measure transpiration directly — it tracks the bubble, which moves as water is drawn up the xylem. Translating bubble movement into a rate (distance / time) gives the transpiration rate.
Key Takeaways
- The independent variable is the cause; the dependent variable is the effect being measured.
- For a potometer, the bubble's movement is the measurable output that represents water uptake (and so transpiration).
Common Mistakes
- Naming 'amount of water lost' as the dependent variable. The potometer does not directly measure water loss; it measures bubble movement.
- Confusing the two: students sometimes swap them.
- Naming 'water uptake' rather than the bubble's movement per unit time.
Things to Be Careful About
- Either form of the dependent variable is acceptable ('distance moved in a set time' or 'time taken for a set distance').
- Light intensity must be specified, not just 'light' — the property being varied is the intensity.
List three variables that should be controlled in this investigation and describe how the student could standardise two of these variables.
Answer
Three controlled variables (any three from): temperature, humidity, air movement, background light, wavelength of light, plant species / number of leaves, CO₂ concentration, time of measurement.
How to standardise two of them:
- Temperature: place a heat shield (e.g. a glass tank of water) between the lamp and the shoot, OR use a cold light source / LED lamp, OR work in a temperature-controlled room.
- Air movement: keep windows and doors closed and keep fans switched off throughout the investigation.
(Equivalent credit-worthy methods for any other two variables are also acceptable.)
Three variables: e.g. temperature, humidity, air movement. Standardise e.g. temperature by a heat shield or cold light source; air movement by closing windows / doors and switching off fans.
Background Concept
Transpiration — the loss of water vapour from a plant's leaves — is affected by many environmental factors: light intensity, temperature, humidity, air movement, carbon dioxide concentration, and water availability. It is also affected by plant-specific factors: species, number of leaves, leaf area, age of the shoot.
To investigate the effect of one variable (light intensity) reliably, all other variables that could affect transpiration must be kept the same across every trial. Otherwise, a change in the bubble's movement could be due to a confound (e.g. a change in temperature from the lamp) rather than the light intensity itself.
Understanding the Question
The student must (a) name three variables that should be controlled, and (b) describe how to standardise two of them. The first part tests whether the student knows the major factors affecting transpiration; the second tests whether they know practical ways to control them in a school or college laboratory.
Approach
First, list three variables from the major factors affecting transpiration. Then describe practical methods for two of these — what would actually be done in the lab (e.g. heat shield, cold light source, sealed environment).
Step-by-Step Reasoning
Three controlled variables (any three from the list):
- Temperature — heat from a lamp raises the temperature around the plant, which itself speeds transpiration. Need to keep this constant.
- Background / ambient light — any other light source would change the effective intensity reaching the shoot. Keep this constant.
- Air movement / wind — moving air removes water vapour from around the leaves, steepening the concentration gradient and increasing transpiration. Keep this constant.
- Wavelength / colour of light — a different bulb (e.g. tungsten vs. fluorescent) emits a different spectrum. Use the same bulb throughout.
- Plant / shoot — the number, area and species of leaves all affect transpiration. Use the same shoot (or shoots of equivalent area) throughout.
- Humidity — water vapour in the air reduces the diffusion gradient. Keep ambient humidity constant.
- CO₂ — stomatal opening can respond to CO₂. Keep CO₂ levels constant.
- Time of measurement — measure over the same time interval for fair comparison.
Two methods of standardisation (any two):
- Temperature: use a heat shield (a glass tank of water) between the lamp and the shoot, OR use a cold light source (LED) which emits little infrared, OR carry out the experiment in a temperature-controlled room.
- Background light: close the blinds and switch off other lights, OR carry out the experiment in a darkened room with only the experimental lamp.
- Air flow: close windows and doors, switch off any fans or air conditioning.
- Wavelength: use the same lamp throughout.
- Plant / shoot: use the same plant, or shoots with the same number of leaves / similar leaf area.
- Humidity: carry out the experiment in a sealed chamber, or note the humidity and keep it constant.
- CO₂: keep windows and doors closed in a stable environment.
- Time: use the same time interval (e.g. 60 seconds) for every reading.
Key Takeaways
- Transpiration is multi-factorial; controlling variables is essential to test one factor cleanly.
- Standardisation means making the controlled variables identical across all trials.
- The student must specify HOW a variable is controlled, not just that it is.
Common Mistakes
- Listing 'amount of water' as a variable — the potometer actually requires water, so this is not something to 'control' in the same sense; the issue is keeping the plant hydrated.
- Stating vague methods like 'keep temperature the same' — the question asks how to standardise the variable, so a specific method is needed.
- Confusing controlled variables with the independent / dependent variables.
Things to Be Careful About
- The first mark is for any three correct variables; the next two marks require actual standardisation methods that would be done in practice.
- The mark scheme lists eight possible variables; any three from these are acceptable.
- 'Heat shield' and 'cold light source / LED' are common exam-credit answers for controlling temperature while using a lamp.
Describe how the student could set up and use the potometer shown in Fig. 1.1 to investigate the rate of transpiration at different light intensities.
Your method should be set out in a logical way and be detailed enough to let another person follow it.
Answer
- Cut the leafy shoot from the plant under water (e.g. in a bowl) to prevent air being drawn into the xylem. Insert the cut end of the stem into the bung under water so it stays wet.
- Assemble the potometer with all joints sealed using petroleum jelly (or silicone grease / silicone tape) so the apparatus is airtight.
- Fill the graduated tube with water. To introduce a single air bubble, dip the open end of the tube into the beaker of water and lift it out again so a bubble enters the tube.
- Place a lamp at a set distance from the shoot for the first trial. Vary the light intensity by changing the distance between the lamp and the shoot (light intensity is inversely proportional to the square of the distance). Use at least five different distances (e.g. 20, 40, 60, 80 and 100 cm) to give five different light intensities.
- Control at least one other variable that affects transpiration (e.g. close windows and doors and keep fans off to standardise air movement; use the same lamp throughout to standardise wavelength; use the same shoot throughout).
- Allow the apparatus to equilibrate for a few minutes at each new light intensity before starting to time the bubble, so the shoot adjusts to the new conditions.
- Reset the air bubble to the start of the graduated tube between readings using the reservoir and tap.
- Measure the distance moved by the bubble in a set time (e.g. 60 s), or the time taken for the bubble to move a set distance. Repeat each light intensity at least twice and calculate a mean; identify any anomalous results.
- Safety: cut the stem away from your hand using secateurs or sharp scissors; be aware that the lamp can become hot (low / medium risk investigation).
A logical method covering: cutting the shoot under water and inserting into the bung under water; sealing joints with petroleum jelly; introducing an air bubble; varying the distance between lamp and shoot for at least five light intensities; controlling at least one other variable; allowing equilibration; resetting the bubble between readings; measuring distance moved in a set time or time for a set distance; repeating each intensity and taking a mean; safety precautions.
Background Concept
A potometer measures water uptake, which closely matches transpiration in a turgid shoot (provided the plant cells remain fully hydrated, so xylem tension equals transpiration pull).
Key technical pitfalls a method must address:
- Air must not enter the cut xylem, or water uptake stops (embolism).
- All joints must be airtight, or the apparatus leaks and the bubble moves for the wrong reason.
- An air bubble of known starting position must be introduced for measurement.
- Light intensity must be varied in a controlled way (e.g. by changing the lamp's distance).
- Equilibration gives the plant time to adjust to the new conditions before measurements are taken (e.g. stomata opening or closing in response to a new light intensity).
- Repeats and means improve reliability.
Understanding the Question
Part (b) asks the student to write a method that another person could follow. Marks are awarded for any six points from a list of ten in the mark scheme. The method should be in a logical order — setting up the apparatus, varying light intensity, taking measurements, repeating, and safety.
Approach
The mark scheme gives ten potential points. A good answer picks six or seven, ideally in a logical order, and addresses all the key points: setting up (cutting under water, sealing joints); introducing the bubble; varying intensity (≥ 5 values); controlling variables; equilibrating; resetting the bubble; measuring; repeating; safety.
Step-by-Step Reasoning
- Cut the shoot under water. When a stem is cut in air, the xylem vessels can suck in air, forming embolisms that block water flow. Submerging the cut prevents this. Insert the cut end into the bung under water to keep it wet.
- Seal all joints with petroleum jelly (or silicone grease / silicone tape). Any air leak will cause the bubble to drift in the wrong direction or move unreliably.
- Introduce a single air bubble by submerging the open end of the graduated tube in a beaker of water, then lifting it out. Water flows out as the bubble enters the tube.
- Vary light intensity by changing the distance between the lamp and the shoot. Light intensity follows an inverse-square law, so different distances give different intensities. Use at least five distances (e.g. 20, 40, 60, 80, 100 cm).
- Control one variable (e.g. close windows and doors, use the same bulb throughout) so only light intensity changes.
- Equilibrate the apparatus: leave it for a few minutes at each new light intensity before starting to time the bubble. This allows the shoot to adjust (e.g. stomata to open / close) and the bubble movement to stabilise.
- Reset the bubble to the start of the graduated tube between readings using the reservoir / tap.
- Measure the distance moved by the bubble in a set time (e.g. 1 minute), or the time taken for the bubble to move a set distance.
- Repeat each light intensity at least twice and calculate a mean. Identify and exclude anomalous results.
- Safety: cut the stem away from your hand using secateurs or sharp scissors; be aware that lamps can get hot (low / medium risk).
Key Takeaways
- A good potometer method addresses the technical pitfalls (air in xylem, leaks) as well as the experimental design (variables, repeats).
- Logical order makes the method reproducible by another person.
- Equilibration and repeats are essential for reliable data.
Common Mistakes
- Cutting the shoot in air — this introduces embolisms and ruins the experiment.
- Failing to seal joints — leaks cause false readings.
- Forgetting to equilibrate — the first readings are often unreliable.
- Varying more than one variable at a time (e.g. changing the bulb as well as the distance).
- No repeats — one reading per condition is unreliable.
- Varying light intensity by changing both distance AND bulb wattage.
Things to Be Careful About
- The mark scheme allows any six of the ten points; you don't need all ten.
- 'Cold light source' or 'LED light' avoids heating the plant, which would otherwise change temperature (a confound).
- The method must be in a logical order so it can be followed.
The student carried out further experiments, using the same apparatus, to investigate the effect of two different environmental carbon dioxide concentrations on the rate of transpiration. These experiments were carried out at a high light intensity and at a low light intensity.
The leafy shoots used in the experiments were taken from the same plant and each shoot had five leaves.
The student calculated the percentage reduction in the transpiration rate from to of carbon dioxide at low light intensities.
The results are shown in Table 1.1.
Table 1.1
| concentration of carbon dioxide / | light intensity | transpiration rate / | percentage reduction in transpiration rate from to of carbon dioxide |
|---|---|---|---|
| 50 | low | 1.28 | 36.7 |
| 730 | low | 0.81 | |
| 50 | high | 3.03 | |
| 730 | high | 2.12 |
Complete Table 1.1 by calculating the percentage reduction in transpiration rate from to of carbon dioxide at the high light intensity.
Show your working.
Working
% reduction = ((original rate − new rate) / original rate) × 100
At high light intensity:
= (0.91 / 3.03) × 100
= 30.0% (to 3 s.f.)
Answer
30.0%
30.0%
Background Concept
Percentage change is calculated relative to a baseline (original) value:
% change = ((new value − original value) / original value) × 100
If the new value is less than the original, the result is a percentage reduction. In this context, 'original' is the value at 50 ppm and 'new' is the value at 730 ppm.
- At low light: ((1.28 − 0.81) / 1.28) × 100 = 36.7% (already given in the table)
- At high light: ((3.03 − 2.12) / 3.03) × 100 = ?
Understanding the Question
The student must complete the missing entry in Table 1.1 — the percentage reduction from 50 ppm to 730 ppm at high light intensity. The data given are: at 50 ppm the rate is 3.03 g dm⁻³ hr⁻¹; at 730 ppm the rate is 2.12 g dm⁻³ hr⁻¹.
Approach
Use the standard percentage change formula, with 50 ppm as the baseline (original) value. The answer is the percentage by which the rate at 730 ppm is less than at 50 ppm.
Step-by-Step Reasoning
% reduction = ((original − new) / original) × 100
= ((3.03 − 2.12) / 3.03) × 100
= (0.91 / 3.03) × 100
= 30.033... %
≈ 30.0% (to 3 significant figures, consistent with the data)
Key Takeaways
- Percentage change uses the original / baseline value as the denominator.
- Quote the answer to a sensible number of significant figures (matching the data — here 3 s.f. to match the given 36.7%).
Common Mistakes
- Dividing by the new value (2.12) instead of the original (3.03).
- Confusing 'reduction' with the absolute difference (0.91 g dm⁻³ hr⁻¹) rather than the percentage.
- Rounding to too few or too many significant figures.
Things to Be Careful About
- Use the original value (50 ppm row) as the denominator; this gives the percentage reduction relative to the baseline.
- The expected answer is 30.0% (to 3 s.f., matching the given value of 36.7% which is also given to 3 s.f.).
The student concluded that, as carbon dioxide concentration increased, the transpiration rate in plants decreased at all light intensities.
Explain why this conclusion may not be valid.
Answer
Any two from:
- Only two concentrations of CO₂ (50 ppm and 730 ppm) were tested, which is not enough to support the claim that transpiration 'decreases' as CO₂ rises across the full range.
- Only two light intensities (low and high) were tested, which is not enough to support the claim that the effect occurs 'at all light intensities'.
- Only one species / type of plant was tested, so the conclusion may not apply to other plants.
- The experiment was not replicated (no repeats were carried out), so the readings may simply reflect random variation.
- No statistical analysis was performed, so it cannot be shown that the differences observed are significant.
- Laboratory conditions may not be replicated in the field, so the conclusion may not apply in real environments.
- Other variables that affect transpiration (e.g. humidity, temperature) were not controlled, so any change could be due to a confound.
Any two of: only two CO₂ concentrations tested; only two light intensities tested; only one plant species tested; no replication; no statistical analysis; laboratory conditions may not reflect the field; other uncontrolled variables.
Background Concept
A conclusion from an experiment is only as strong as the data supporting it. Validity depends on:
- Sufficient range of values tested (covering the breadth of the claim)
- Replication (multiple trials) to distinguish real effects from random variation
- A representative sample (more than one organism / species) for generalisation
- Statistical testing to assess whether differences are significant
- Control of confounding variables (so the measured effect is due to the named cause)
- Ecological validity (does the lab situation reflect the real world?)
Understanding the Question
The student concluded that increasing CO₂ decreases transpiration at all light intensities. The data in Table 1.1 only have two CO₂ concentrations (50 and 730 ppm) and two light intensities (low and high). The student must identify why this limited data do not support the broad conclusion.
Approach
Examine the data and identify the limitations: too few concentrations tested, no repeats, one species, etc. Two clear limitations from the mark scheme earn full marks.
Step-by-Step Reasoning
Two valid criticisms from:
- Only two concentrations of CO₂ (50 and 730 ppm) were tested. To claim that transpiration 'decreases' with increasing CO₂, the trend should be tested at multiple intermediate concentrations to confirm it is a real pattern.
- Only one light intensity was used at each condition (low or high), and only two light intensities in total. To claim the effect occurs 'at all light intensities', more intensities should be tested.
- Only one species / type of plant was tested; the result may not generalise.
- The experiment was not replicated (no repeats), so the readings may reflect random variation rather than a real effect.
- No statistical analysis was performed, so we cannot tell whether the differences observed are significant.
- Laboratory conditions may not match the field, so the conclusion may not apply outside the lab.
- Other variables (e.g. humidity, temperature) were not explicitly controlled; any of these could be affecting the results.
Key Takeaways
- A conclusion must be supported by data that covers the full range claimed.
- Replication and statistical testing are needed to distinguish real effects from noise.
- Generalising from one species to all plants, or from one lab to all environments, requires broader evidence.
Common Mistakes
- Saying 'the experiment is not accurate' — the issue is validity, not accuracy.
- Saying 'the data show the trend' — actually the data are too limited to show a trend.
- Saying 'human error' — this is too vague and not what the mark scheme credits.
- Confusing accuracy (how close a reading is to the true value) with precision / reliability (how close repeated readings are to each other).
Things to Be Careful About
- The student is asked for two limitations; choose two strong ones rather than one weak one.
- The conclusion makes a general claim ('at all light intensities'); the data must be sufficient to support that breadth of claim.
- Reject vague answers — 'not enough data' is too general; the mark scheme credits specific limitations (range of variables, replication, statistical analysis, species, field vs. lab, other variables).
The rest of this paper
1 more questions- Q2Planning · Analysis, Conclusions and Evaluation15M