Biology 9700/53 — May/June 2018
Cambridge A-Level · Planning, Analysis and Evaluation · worked solutions for every part, with the mark scheme
Topics Planning · Analysis, Conclusions and Evaluation
Sodium hydrogencarbonate indicator solution contains sodium hydrogencarbonate.
Some students found out on the internet that this indicator solution changes colour with pH. The students also discovered that this indicator is used to determine the concentration of carbon dioxide in a solution.
The students decided to use this indicator to measure the rate of photosynthesis in algal balls. Algal balls are unicellular algae that are immobilised in alginate. The students assumed that the rate of carbon dioxide uptake was proportional to the rate of photosynthesis.
Fig. 1.1 shows the apparatus that the students used.
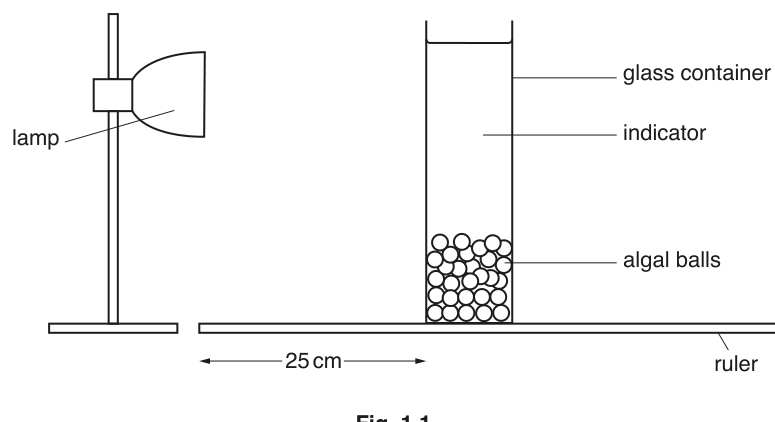
A laboratory technician prepared a series of test-tubes containing hydrogencarbonate indicator solution from pH 7.6 to pH 9.2. The colour of the indicator solution in each test-tube is described in Table 1.1.
Table 1.1
| increasing in indicator solution | decreasing in indicator solution | |||||||
| pH 7.6 | pH 7.7 | pH 8.0 | pH 8.2 | pH 8.4 | pH 8.6 | pH 8.8 | pH 9.0 | pH 9.2 |
| light yellow | dark yellow | light orange | dark orange | red | light magenta | dark magenta | light purple | dark purple |
Suggest what was added to each of the test-tubes to maintain the pH.
Answer
A (named) buffer solution.
(named) buffer
Background Concept
A buffer is a solution that resists changes in pH when small amounts of acid or alkali are added, or when it is diluted. Buffers are made from a weak acid and its conjugate base (or a weak base and its conjugate acid). In this question the technician needs nine test-tubes each held at a precise pH between 7.6 and 9.2, so a buffering system is required — otherwise CO₂ dissolved from the air, or CO₂ lost to the air, would drift the pH of the indicator and ruin the colour standards.
Understanding the Question
The students will compare the colour of the indicator in their experiment tubes against a colour standard. If the colour standards drift in pH, the calibration is no longer valid and any colour matching will be unreliable. The technician must therefore add something that holds the pH at each required value.
Approach
Recall that pH is held constant using a buffer. The technical term to write is simply "buffer" (or a named buffer, e.g. a hydrogencarbonate/carbonate buffer for the pH 7.6–9.2 range).
Step-by-Step Reasoning
- The pH range 7.6–9.2 is alkaline, so an alkaline buffer is appropriate (e.g. a sodium hydrogencarbonate / sodium carbonate buffer).
- The mark scheme accepts a generic answer of "(named) buffer" — it does not require a specific named buffer.
- A common wrong answer here is to say "indicator" — but the indicator is already present and it changes colour, rather than holding pH.
Key Takeaways
When a series of standards must be held at a defined pH, a buffer is the reagent added. This is a routine step in preparing colour standards for pH indicator work.
Common Mistakes
- Writing "indicator" — the indicator reports pH; it does not control pH.
- Writing "distilled water" — water has no buffering capacity.
Things to Be Careful About
The mark scheme requires the word "buffer" (or a named buffer) — vague answers such as "something to keep the pH the same" do not earn the mark.
Unicellular algae can be immobilised using a technique that is similar to that used to immobilise enzymes.
Outline the method that the students would have used to immobilise the algae.
Answer
- Mix the algae with sodium alginate (a thick, viscous solution).
- Drop the alginate–algae mixture, using a syringe or pipette, into a solution of calcium chloride.
- The drops solidify on contact to form calcium alginate beads (algal balls) which trap the algae inside; the beads are then rinsed ready for use.
See working
Background Concept
Immobilisation means trapping cells (or enzymes) in a matrix so that they cannot escape into the surrounding solution, while still allowing substrates and products to diffuse in and out. Alginate is a polysaccharide extracted from seaweed; it is harmless, cheap and sets into a gel when its sodium ions are exchanged for calcium ions. The resulting calcium alginate gel is porous enough to allow small molecules (CO₂, H₂O, O₂, hydrogencarbonate ions, H⁺) to diffuse freely, but the much larger algal cells cannot escape. Because the same technique is used industrially to immobilise enzymes, the same procedure works for whole cells.
Understanding the Question
The students need uniform, easy-to-handle "algal balls". Free algae would be hard to recover from the indicator solution and would make turbidity measurements impossible. Immobilised beads, on the other hand, sink to the bottom of the tube, can be tipped out, washed and reused, and do not leak cells into the indicator.
Approach
Apply the standard alginate-immobilisation method in the correct sequence: mix → drop → set → wash.
Step-by-Step Reasoning
- Step 1 — mix: the algal suspension is added to a solution of sodium alginate and stirred gently so the algae are evenly distributed throughout the viscous mixture.
- Step 2 — drop: the mixture is drawn into a syringe (or pipette) and squeezed out one drop at a time into a beaker of calcium chloride solution. Each drop forms a near-spherical bead on entering the calcium chloride.
- Step 3 — set: calcium ions cross-link the alginate polymers, turning each drop into a firm calcium alginate bead. The algae are physically trapped within the gel. The beads are left in the calcium chloride for a few minutes to harden fully, then rinsed with distilled water to remove excess chloride.
Key Takeaways
Three marks are available, one for each of: mixing with sodium alginate; adding to calcium chloride; the method of dropping (syringe or pipette). The order matters — you must put the algae INTO the alginate FIRST, then drop the mixture INTO the calcium chloride. A common error is to reverse the order.
Common Mistakes
- Reversing the order: adding sodium alginate to calcium chloride makes a useless solid lump, not beads.
- Saying "add calcium chloride to the algae" — the algae are already in the alginate, not in the calcium chloride.
- Omitting the syringe/pipette — without a controlled drop, the beads will be irregular in size and the surface area exposed to the indicator will be uncontrolled.
Things to Be Careful About
Mark scheme guidance: credit is given for "ref. to method of dropping mixture (to form beads)" — explicitly stating the use of a syringe or pipette is the cleanest way to earn this mark.
The students used the apparatus shown in Fig. 1.1 and the colours described in Table 1.1 to investigate the effect of light intensity on the rate of photosynthesis.
The students proposed the following hypothesis:
As light intensity increases the rate of photosynthesis increases.
Identify the independent variable and the dependent variable in this investigation.
independent variable = ______
dependent variable = ______
Answer
Independent variable = light intensity (or distance of the container from the lamp)
Dependent variable = colour of the indicator (or pH)
independent variable: light intensity (or distance of container from lamp); dependent variable: colour of indicator (or pH)
Background Concept
The independent variable is what the experimenter deliberately changes between trials. The dependent variable is what is measured to record the response. The relationship is summarised as: "As the independent variable is changed, the dependent variable is measured." All other factors that could influence the result must be kept constant (controlled variables).
Understanding the Question
The students are testing the hypothesis "as light intensity increases the rate of photosynthesis increases". They are using a lamp whose distance from the container can be changed, and they are reading the colour of the hydrogencarbonate indicator as a proxy for CO₂ uptake (and hence for photosynthetic rate).
Approach
The variable the experimenter changes is the independent variable. The variable the experimenter measures (or reads off a colour standard) is the dependent variable.
Step-by-Step Reasoning
- Independent: the students move the lamp (or the container) to different distances. Distance is being changed, so the directly-changed physical quantity is distance — but the biological quantity of interest is light intensity, which depends on distance. The mark scheme accepts either, since the two are linked by .
- Dependent: the rate of photosynthesis is being measured indirectly via the colour of the indicator. Comparing the experimental tube's colour to Table 1.1 yields a pH, so the colour itself (or the pH read off the standard) is the dependent variable.
Key Takeaways
- Independent variable: light intensity / distance.
- Dependent variable: colour / pH.
- "Rate of photosynthesis" is the biological quantity the students are ultimately interested in, but it is not measured directly; it is inferred from colour/pH.
Common Mistakes
- Writing "rate of photosynthesis" as the dependent variable. The rate is INFERRED from the colour, but the actual measurement is the colour or pH.
- Reversing the two variables.
Things to Be Careful About
The mark scheme allows either form (light intensity OR distance) for the independent variable. Always state the variable the experimenter directly manipulates, but recognise that for this apparatus the physical manipulation is the distance and the biological variable is the light intensity.
Describe a method the students could use to collect the data needed to test their hypothesis.
Your method should be set out in a logical way and be detailed enough to let another person follow it.
You should not repeat any details from (b) about how to prepare immobilised algal balls.
Answer
- Set up the apparatus as in Fig. 1.1. Vary the light intensity by placing the lamp at five different distances from the container, e.g. 10, 25, 50, 100 and 200 cm.
- Cover the container with metal foil (or work in a dark room with only the lamp as the light source) so that no other light reaches the indicator.
- Standardise the volume and concentration of hydrogencarbonate indicator solution and use the same number (or mass) of algal balls in each container.
- Switch on the lamp and leave the apparatus for a fixed time (e.g. 10 minutes). Then record the colour of the indicator using Table 1.1 to read off the pH.
- Repeat each distance at least twice and calculate a mean pH. Also set up a control containing the indicator and glass beads (or dead algae) in place of living algal balls. Safety: hydrogencarbonate indicator is an irritant — wear gloves and goggles.
See working
Background Concept
A good experimental method must (i) vary the independent variable across a sensible range, (ii) keep all other variables constant, (iii) include a control to show that any change is due to the treatment, (iv) be replicated so that anomalies can be identified and a mean calculated, and (v) identify a relevant hazard and how to deal with it.
Understanding the Question
The students want to test whether photosynthetic rate rises with light intensity. Their indicator responds to pH (and therefore to CO₂): if photosynthesis exceeds respiration, CO₂ falls, pH rises, the colour moves up the table towards purple. They have a single container and a lamp whose distance from the container can be changed.
Approach
Pick five points from the nine possible marking points, choosing the most decisive features of a strong method.
Step-by-Step Reasoning
- Vary the light intensity: move the lamp, or move the container, to different distances from each other. The mark scheme also accepts using neutral density filters, different wattage bulbs, or a dimmer switch.
- Range of values: state five specific distances, all in the range 10–200 cm. Five values are needed to draw a meaningful graph of rate vs. intensity.
- Exclude other light: wrap the tube/container in metal foil, or work in a dark room with the lamp as the only source. Without this, ambient daylight would swamp the variable the students are trying to change.
- Standardise: use the same volume of indicator and the same number (or mass, or volume) of algal balls at every distance. Without this, the rate per algal ball cannot be compared.
- Fixed time: expose each container for the same length of time. Comparing final colour readings only makes sense if the time is identical.
- Control: set up an identical tube but with no photosynthesis occurring — replace the living algal balls with glass beads, or with algal balls that have been killed (e.g. by boiling). The control should show little or no colour change, confirming that the change seen in the live-algae tube is due to photosynthesis.
- Replication: do each distance at least twice; calculate a mean. This is essential because judging the colour change is subjective and any single reading is unreliable.
- Safety: hydrogencarbonate indicator is an irritant; wear gloves and goggles. (Other accepted hazards include allergy to alginate/algae.)
Key Takeaways
- Five mark-scheme points are needed: a method to vary the IV, five distances in 10–200 cm, control of light, a fixed recording time, and three further points from {control, standardised indicator, standardised algal balls, replication/mean, safety}.
- A clean method lists the variables (varied, measured, controlled) explicitly and gives numerical details (distances, time) so that another student could repeat the work exactly.
Common Mistakes
- Saying "amount" instead of "volume" or "concentration" for the indicator — the mark scheme specifically rejects "amount" here.
- Recording the time taken to reach a particular colour instead of recording the colour after a fixed time — both are accepted by the mark scheme, but only one needs to be described.
- Forgetting the control, or setting up a control that does not test what the experiment claims (e.g. a tube with indicator but no algal balls AND no beads — this does not show whether the beads themselves are inert).
- Skipping replication, or doing a single replicate at each distance.
Things to Be Careful About
The mark scheme offers 9 possible points but only 5 are needed. Choose the strongest, most specific 5: the cleanest answers in the order above are usually the most reliable for credit.
The students were concerned that the lamp may have increased the temperature of the solution in the container. Suggest how they could have attempted to control this variable.
Answer
Place a heat filter (e.g. a clear glass tank of water, or a sheet of double-glazed glass) between the lamp and the container. (An LED "cold light" source is an acceptable alternative.)
place a heat filter (e.g. a glass tank of water) between the lamp and the container
Background Concept
A tungsten-filament lamp emits substantial infrared radiation alongside visible light. If the lamp is close to the container, this infrared warms the indicator solution. Temperature affects the rate of photosynthesis (and the rate of CO₂ dissolution), so any warming would be a confounding variable. A heat filter absorbs the infrared but transmits visible light, decoupling the two effects.
Understanding the Question
The students want to know what practical step would stop the lamp from warming the solution, so that the only thing varying between trials is the visible light intensity.
Approach
Recall that "heat filter" is the standard CIE term. The simplest practical filter is a flat-sided glass tank of water (water absorbs infrared strongly) or a sheet of heat-absorbing glass placed between lamp and container.
Step-by-Step Reasoning
- The lamp emits visible light AND infrared. The visible light is the experimental variable; the infrared is an unwanted confounder.
- Place a clear heat filter in the path of the light. Water in a glass tank is the cheapest effective filter; a sheet of double- or triple-glazed glass works similarly.
- Modern LED or halogen-cold-light sources emit very little infrared and are accepted by the mark scheme as an alternative.
Key Takeaways
- A heat filter is the standard way to control temperature when using a filament lamp as a light source in photosynthesis investigations.
- A water-filled glass tank is a cheap, accessible heat filter.
Common Mistakes
- Suggesting "move the lamp further away" — this changes the light intensity (the IV), defeating the purpose of the experiment.
- Suggesting "use a lower-wattage bulb" — this also changes the light intensity.
- Saying "place a thermometer in the solution" — that monitors temperature but does not control it.
Things to Be Careful About
The mark scheme specifically accepts "description of heat filter e.g. container of water / double glazed glass sheet" or "cold light source e.g. LED lights". Vague answers such as "use a filter" do not earn the mark — name what the filter is.
The light intensity () can be calculated using the formula shown in Fig. 1.2.
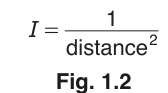
Use the formula in Fig. 1.2 to calculate the light intensity for the experiment shown in Fig. 1.1.
= ______
Working
Answer
Background Concept
The formula is the inverse-square law: light intensity is proportional to from a point source. Doubling the distance from the lamp quarters the light intensity. The formula is a simplification — in reality it is the constant of proportionality that is left implicit in this exam formula.
Understanding the Question
Fig. 1.1 shows the distance between the lamp and the container as 25 cm. The student is asked to substitute this distance into the formula and write down the light intensity in Fig. 1.2.
Approach
Read the distance from Fig. 1.1, square it, and take the reciprocal. The mark scheme accepts the result in either decimal (0.0016) or standard form (), so either is fine.
Step-by-Step Reasoning
- Distance from Fig. 1.1: cm.
- Square the distance: (cm²).
- Take the reciprocal: .
- In standard form: .
The formula does not specify units, but the magnitude assumes the distance has been substituted in centimetres. If the distance had been converted to metres ( m) before substitution, the answer would have been , so the implicit unit is cm⁻².
Key Takeaways
- Read every numerical value directly off the figure — do not invent one.
- Show every step of the substitution, not just the final answer, so that an error in arithmetic still gets process credit if the method is right.
- Standard form is usually expected for very small or very large numbers.
Common Mistakes
- Squaring incorrectly: writing instead of .
- Converting the distance to metres and giving (which would be correct only if the formula's constant is one with m² as the unit, but the mark scheme here expects ).
- Forgetting to give the answer in standard form.
Things to Be Careful About
The mark scheme accepts 0.0016, , or 0.002 (rounded to one significant figure). Aim for two or three significant figures, as here, to avoid the rounding penalty.
The students decided that using a pH probe would give them more accurate data. They decided to measure the pH change for one value of light intensity.
Fig. 1.3 shows their results.
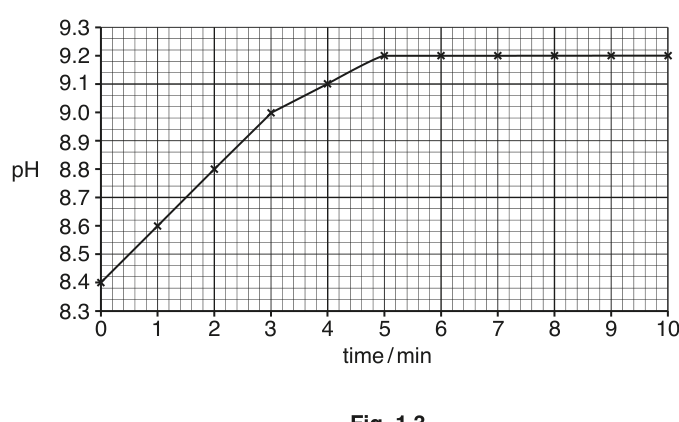
State why the use of a pH probe provides more accurate data.
Answer
Judging the colour of the indicator by eye is subjective and different people perceive colours differently. A pH probe gives a numerical (quantitative) result that is more sensitive and not dependent on the observer.
judging colour is subjective / pH probe gives a quantitative (numerical) result
Background Concept
Every measurement has an associated uncertainty. Subjective comparisons (matching a colour by eye) carry a large human uncertainty: two observers can legitimately place the same solution at different points on the colour standard. A pH probe converts the same chemical property into a voltage that the instrument displays as a number; this is an objective measurement whose uncertainty is set by the probe's calibration, not by the observer's eyes.
Understanding the Question
The original method relied on matching a colour to a printed scale (Table 1.1). The students want to know why a pH probe would give better data.
Approach
Identify what is wrong with the original colour-comparison method and how a probe fixes it.
Step-by-Step Reasoning
- Subjectivity of colour matching: the eye cannot reliably discriminate between adjacent colours on the scale (e.g. between dark orange and red, or between light magenta and dark magenta). Two students comparing the same tube could legitimately record different pH values.
- Probe advantages: a pH probe gives a numerical reading (e.g. 8.7) to one or two decimal places, is not influenced by the observer, and detects smaller differences in pH than the eye can resolve between adjacent colour steps. The mark scheme also accepts "more sensitive" or "gives a quantitative result".
Key Takeaways
Subjective measurements are less accurate and less reproducible than objective ones. A pH probe is more accurate because it removes human judgement and resolves smaller pH differences.
Common Mistakes
- Saying "more accurate" without explaining why. The mark scheme requires either the subjectivity of colour, the difference between observers, or the higher sensitivity of the probe.
- Confusing accuracy with precision. The probe is also more precise, but the mark-scheme answers focus on the subjectivity and the quantitative nature of the reading.
Things to Be Careful About
The mark scheme accepts any of: judging colour is subjective; different people see colours differently; pH probe is more sensitive; pH probe gives a numerical/quantitative result. Give the one that flows most naturally in your sentence.
The data shown in Fig. 1.3 were for a high light intensity.
On Fig. 1.3, sketch the curve that you would expect for a low light intensity.
Answer
Sketch a new curve on Fig. 1.3 that starts at pH 8.4 at time 0 but rises more gradually than the original. The new curve should lie to the right of (below) the original curve across the whole 0–10 minute range. The plateau, if reached within 10 minutes, will be reached later than the 5-minute plateau of the high-light curve.
see diagram — curve to the right of the original, from 0 to 10 minutes
Background Concept
The pH rises because photosynthesis removes CO₂ from the indicator. The rate of pH rise is therefore a measure of the rate of photosynthesis. A lower light intensity gives a lower rate of photosynthesis (within the light-limiting range), so pH rises more slowly, and the plateau (where photosynthesis equals the rate at which CO₂ is supplied from the air / hydrogencarbonate equilibrium) is reached later, if at all within the 10 minutes shown.
Understanding the Question
The students already have a curve for a high light intensity. They want to know what to draw for a low light intensity. The student must add a curve to the printed Fig. 1.3, not just describe it in words.
Approach
Reduce the gradient of the curve. Keep the same starting pH. Keep the curve to the right of the original across the entire 0–10 min range.
Step-by-Step Reasoning
- The starting pH is the same (8.4) because the indicator is freshly mixed.
- The rate of pH rise is lower, so the slope is shallower.
- The new curve must lie to the right of (or below) the original at every time point from 0 to 10 minutes.
- The plateau, if reached, is reached later than 5 minutes; it may not be reached within the 10-minute window at all.
- The mark scheme requires the curve to be drawn from 0 to 10 minutes — do not stop the new curve early.
Key Takeaways
- Lower IV → shallower gradient on a rate graph.
- The plateau represents the system reaching a steady state (rate of CO₂ uptake = rate of CO₂ supply from buffer equilibrium). At lower light intensity this steady state is reached later, if at all.
- When sketching on a printed figure, the curve must be drawn across the full axis range, not truncated.
Common Mistakes
- Drawing a curve that starts at a different pH — the start pH is determined by the indicator mix, not by light intensity.
- Drawing the new curve steeper than the original, or to the left of it.
- Stopping the curve before 10 minutes.
- Drawing a curve that plateaus at the same time as the original — the plateau must be later, because the steady state is reached later.
Things to Be Careful About
The mark scheme specifies two features: the curve must be to the right of the original AND it must span the full 0–10 minute range. Either of these missing loses the mark.
State why carbon dioxide is not a limiting factor in this investigation.
Answer
The hydrogencarbonate indicator solution contains dissolved hydrogencarbonate ions, which supply CO₂ to the algae continuously. Therefore CO₂ is not a limiting factor.
indicator solution provides hydrogencarbonate ions / CO₂
Background Concept
A limiting factor is the resource in shortest supply that caps the rate of a process. In photosynthesis the classic limiting factors are light intensity, CO₂ concentration and temperature. In this experiment the indicator solution is essentially a concentrated hydrogencarbonate buffer; it holds a large reservoir of dissolved inorganic carbon (as HCO₃⁻) that can be drawn upon by the algae throughout the experiment.
Understanding the Question
The students used only one light intensity and recorded pH over time. They must justify that the resulting rate is not limited by CO₂ availability, otherwise the rate measured is not the maximum possible rate at that light intensity.
Approach
Identify the chemical role of the indicator solution: it is a hydrogencarbonate buffer, and the equilibrium
continuously replenishes CO₂ as the algae use it. So CO₂ is plentiful, and the only thing changing the rate is the light intensity.
Step-by-Step Reasoning
- The indicator solution is made from sodium hydrogencarbonate, which dissociates to give hydrogencarbonate ions (HCO₃⁻).
- The hydrogencarbonate ions are in equilibrium with dissolved CO₂.
- As algal photosynthesis removes CO₂, more CO₂ is released from the hydrogencarbonate reservoir, so the CO₂ concentration is effectively held high.
- Because CO₂ is supplied in excess, it is not the factor limiting the rate of photosynthesis in this investigation.
Key Takeaways
- A buffer can act as a reservoir of the very ion it buffers, providing a continuous supply of substrate to a reaction that consumes the substrate.
- "Not limiting" means the resource is present in excess relative to the demand.
Common Mistakes
- Saying "CO₂ is provided by the air" — this is true but not what the indicator is doing; the question is specifically about the indicator solution.
- Saying "the algae make their own CO₂" — the algae use CO₂, not make it (in this context).
- Vague answers such as "there is enough CO₂" without saying where it comes from.
Things to Be Careful About
The mark scheme requires the link to the indicator / hydrogencarbonate. The point is that the indicator itself is the source of CO₂, not the atmosphere.
Certain weed killers work by reducing the rate of photosynthesis.
The students modified their method to investigate the effect of three different weed killers on algae at the same light intensity.
The investigation was replicated a number of times and the pH was recorded after 30 minutes. The students calculated the mean pH for each treatment, as shown in Table 1.2.
The students carried out -tests to compare the mean pH for each of the treatments that used weed killers with the treatment that used no weed killer (treatment 1). The students calculated the value of for each of the tests.
Table 1.2 shows the results from their investigation.
Table 1.2
| treatment | contents | mean pH after 30 minutes | value |
|---|---|---|---|
| 1 | algal balls, indicator and distilled water | 9.2 | |
| 2 | algal balls, indicator and weed killer A | 8.5 | < 0.001 |
| 3 | algal balls, indicator and weed killer B | 9.0 | > 0.05 |
| 4 | algal balls, indicator and weed killer C | 8.7 | < 0.05 |
Suggest a null hypothesis for comparing the effect of treatment 2 with treatment 1.
Answer
There is no significant difference between the mean pH for treatment 1 (algal balls with no weed killer) and the mean pH for treatment 2 (algal balls with weed killer A).
no significant difference between the (mean) pH for treatment 1 and treatment 2
Background Concept
A null hypothesis () is the default assumption that there is no effect — no difference between the groups being compared. The alternative hypothesis () states that there is a real difference. A statistical test (here, the t-test) calculates the probability of obtaining the observed data, or more extreme data, IF the null hypothesis is true. If that probability (the p-value) is very small, we reject in favour of .
Understanding the Question
The students are comparing treatment 2 (weed killer A) with treatment 1 (no weed killer). The question asks for the null hypothesis that will be tested by their t-test.
Approach
The null hypothesis must (i) state a comparison between the two treatments, (ii) use the word "no difference" or "no significant difference", and (iii) refer to the specific measured quantity (mean pH). A common alternative is to write the hypothesis about the populations from which the samples are drawn, but in CIE mark-scheme terms either form is credited.
Step-by-Step Reasoning
- Identify the two samples: treatment 1 (control, distilled water) and treatment 2 (weed killer A).
- Identify the measured variable: mean pH after 30 minutes.
- State the hypothesis: there is no significant difference between the (mean) pH for treatment 1 and the (mean) pH for treatment 2.
Key Takeaways
- A null hypothesis always says "no significant difference" or "no significant effect".
- It must specify the two groups being compared and the variable being measured.
Common Mistakes
- Stating the alternative hypothesis (e.g. "weed killer A reduces the pH") instead of the null.
- Omitting the word "significant" — without it, the null hypothesis would be trivially false because two random samples rarely have IDENTICAL means.
- Omitting "mean" — the test compares sample means, not individual pH values.
- Reversing the two treatments.
Things to Be Careful About
The mark scheme specifically says "no significant difference". The word "significant" is the load-bearing word; a null hypothesis of "no difference" does not earn the mark.
The -tests were used to compare the means.
State one feature of data that allows use of the -test.
Answer
Any one of:
- the data are continuous (pH is a continuous variable);
- the data are normally distributed;
- the standard deviations of the two samples are approximately equal;
- each sample size is less than 30.
continuous data / data is normally distributed / standard deviations are similar / sample sizes < 30
Background Concept
The (Student's) t-test compares two sample means and asks: "If the two samples were drawn from populations with the same true mean, how likely would we be to obtain two sample means at least as far apart as the ones observed?" The test makes a number of assumptions about the data, and the test is only strictly valid when those assumptions hold.
Understanding the Question
The students have used a t-test. The question asks the student to identify ONE feature of the data that permits the use of a t-test.
Approach
Recall the four classical assumptions of the t-test:
- The data are continuous (not categorical or rank).
- The data are approximately normally distributed in each population.
- The two populations have approximately equal standard deviations (variance).
- The two samples are independent of each other and the sample sizes are reasonably small (typically each — beyond this, a z-test would be more appropriate).
The mark scheme accepts any one of these, EXCEPT "compare the means" (which the mark scheme specifically ignores, as it is what the t-test does, not a property of the data).
Step-by-Step Reasoning
- The pH readings are continuous (between 8.5 and 9.2), so condition 1 is met.
- The replicates at each treatment are likely to be approximately normally distributed around their mean.
- The mark scheme explicitly REJECTS "compare the means" as a feature of the data, because that is the purpose of the t-test, not a property of the data.
Key Takeaways
- The t-test is for comparing two means of continuous, approximately normal data.
- For larger sample sizes ( each), a z-test is generally used; the t-test is preferred for small samples.
- A vague answer such as "compare the means" is not a feature of the data — it is the aim of the test.
Common Mistakes
- Writing "compare the means" — explicitly ignored by the mark scheme.
- Writing "the data are qualitative" — pH is quantitative.
- Writing "there are two treatments" — the number of groups is not an assumption of the t-test; it is what defines which test to use.
Things to Be Careful About
The mark scheme lists four possible answers, of which one is needed. State any one of them clearly.
When calculating the effect of weed killer A on the rate of photosynthesis, 15 degrees of freedom was chosen. The students carried out 7 replicates of treatment 1.
State how many replicates were carried out for treatment 2.
Working
Answer
10
Background Concept
For a two-sample (independent) t-test, the degrees of freedom is
where and are the sample sizes of the two groups being compared. The df controls the shape of the t-distribution used as the reference distribution. Knowing df and the sample size of one group lets you calculate the other.
Understanding the Question
The students carried out 7 replicates of treatment 1 and 15 degrees of freedom in their t-test. How many replicates did treatment 2 have?
Approach
Apply the formula and solve for .
Step-by-Step Reasoning
- (given).
- (replicates of treatment 1).
- .
- .
- So treatment 2 had 10 replicates.
Key Takeaways
- df is not the same as sample size: for a t-test, , so the total sample size is here.
- The treatment with more replicates has more weight in the comparison — here, treatment 2 with 10 replicates contributes more to the t-statistic than treatment 1 with 7.
Common Mistakes
- Writing (forgetting the "− 2").
- Confusing df with total sample size and giving (which would be the answer if you wrongly used ).
- Subtracting instead of adding: (nonsense).
Things to Be Careful About
Show the rearrangement of the formula explicitly; the mark scheme accepts the answer of 10 but credit is also given for correct working.
The students concluded that the weed killers had a significant effect on the rate of photosynthesis.
Explain to what extent the values in Table 1.2 support their conclusion.
Answer
- The conclusion is supported for weed killers A and C, but not for weed killer B.
- For A (p < 0.001) and C (p < 0.05), the p-values are below the 0.05 significance threshold, so the difference from the no-weed-killer control is statistically significant. The weed killers do reduce the rate of photosynthesis significantly.
- For B (p > 0.05), the p-value is above the 0.05 threshold, so the difference from the control is not statistically significant — any observed difference could be due to chance.
- Weed killer A has a stronger effect than weed killer C, because its p-value (< 0.001) is smaller than that of C (< 0.05), giving stronger evidence against the null hypothesis.
Conclusion supported for A and C (p < 0.05) but not for B (p > 0.05); A has a greater effect than C
Background Concept
A p-value is the probability of obtaining data at least as extreme as the observed data, assuming the null hypothesis is true. By convention, a p-value below 0.05 is taken to mean that the result is "statistically significant" — the data are unlikely to have arisen by chance if there were truly no effect. The smaller the p-value, the stronger the evidence against the null hypothesis.
In this experiment:
- for each comparison: there is no significant difference between treatment 1 (no weed killer) and the weed-killer treatment.
- A small p-value → reject → the weed killer does affect photosynthesis.
- A large p-value (> 0.05) → fail to reject → the weed killer does not significantly affect photosynthesis.
Understanding the Question
The students concluded that the weed killers HAD a significant effect on the rate of photosynthesis. The question asks to what extent the p-values in Table 1.2 actually support that conclusion. Some p-values support it, one does not, and one effect is stronger than another.
Approach
Compare each p-value with the 0.05 threshold. Identify which are below 0.05 (significant) and which are above (not significant). Note the relative magnitudes where two are below the threshold.
Step-by-Step Reasoning
- Weed killer A: p < 0.001. This is well below 0.05; the result is highly significant. There is a real difference between treatments 1 and 2.
- Weed killer B: p > 0.05. This is above 0.05; the result is not significant. Any apparent difference between treatments 1 and 3 could plausibly be due to chance variation. The data do not support the claim that B affects photosynthesis.
- Weed killer C: p < 0.05. This is below 0.05; the result is significant. There is a real difference between treatments 1 and 4.
- Comparing A and C: both are significant, but A's p-value is smaller (< 0.001 vs < 0.05). The smaller p-value indicates stronger evidence against , so the effect of A is greater than the effect of C.
Key Takeaways
- A single p-value threshold (0.05) is used to decide significance; results above it are not significant, results below it are.
- Smaller p-values indicate stronger evidence against the null, so they can be used to rank the strength of different effects.
- A conclusion that is true "on average" can still be wrong for specific treatments — the data must be interpreted treatment by treatment.
Common Mistakes
- Saying "all three p-values are significant" — B's p-value (> 0.05) is NOT significant. The mark scheme explicitly splits the answer between yes (A and C) and no (B).
- Saying "all three p-values are not significant" — A's and C's p-values are below 0.05.
- Comparing the p-values to the WRONG threshold (e.g. 0.01 or 0.10) — the conventional CIE threshold is 0.05.
- Failing to compare the effects of A and C.
- Confusing "smaller p-value" with "weaker effect" — it is the opposite: smaller p-value means stronger evidence that the effect is real, and (assuming the direction of effect is consistent) a larger absolute effect size.
Things to Be Careful About
The mark scheme awards 1 mark for the yes/no split, plus two further marks from the three supporting statements (significance criterion for A/C, ranking of A above C, non-significance of B). Cover at least the split and one supporting statement, ideally all three.
The rest of this paper
1 more questions- Q2Analysis, Conclusions and Evaluation · Planning8M