Biology 9700/52 — May/June 2018
Cambridge A-Level · Planning, Analysis and Evaluation · worked solutions for every part, with the mark scheme
Topics Analysis, Conclusions and Evaluation · Planning
During the light dependent stage of photosynthesis, hydrogen ions and electrons are released by the photoactivation of chlorophyll and the photolysis of water. These are added to the carrier molecule, NADP, changing it from an oxidised state to a reduced state, as shown in Fig. 1.1.

DCPIP is a blue dye which becomes colourless when reduced by hydrogen ions and electrons, as shown in Fig. 1.2.
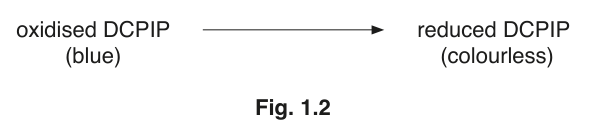
A student used DCPIP to determine if the reactions in the light dependent stage had occurred in a suspension of chloroplasts.
- The suspension of chloroplasts was prepared by grinding, filtering and centrifuging a sample of leaves with ice-cold extraction medium.
- Four tubes covered in foil were set up containing the mixtures shown in Table 1.1.
Table 1.1
| tube | contents |
|---|---|
| 1 | chloroplast suspension and DCPIP |
| 2 | chloroplast suspension and distilled water |
| 3 | DCPIP and extraction medium |
| 4 | chloroplast suspension and DCPIP |
- The tubes were illuminated through a thin glass tank filled with water as shown in Fig. 1.3.
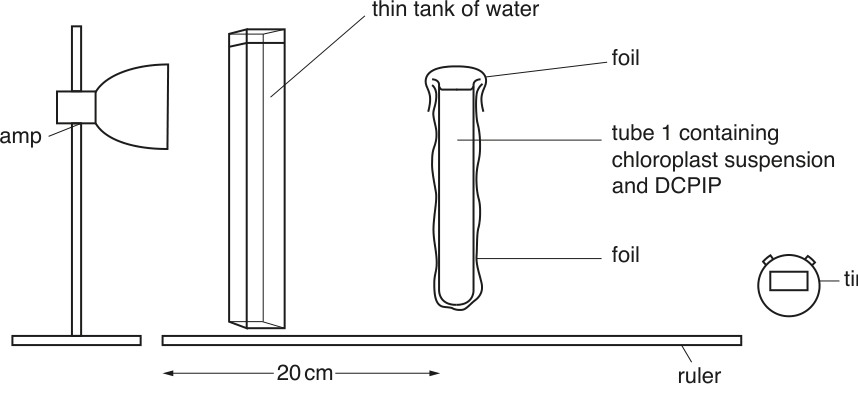
- The foil was removed from tubes 1, 2 and 3, but left on tube 4.
- A timer was started immediately.
- After 10 minutes the colour in each tube was observed and recorded.
Table 1.2 shows the student’s results.
Table 1.2
| tube | contents | foil | colour after 10 minutes |
|---|---|---|---|
| 1 | chloroplast suspension and DCPIP | removed | green |
| 2 | chloroplast suspension and distilled water | removed | green |
| 3 | DCPIP and extraction medium | removed | blue |
| 4 | chloroplast suspension and DCPIP | left in place | blue |
State why the results in Table 1.2 are qualitative.
Answer
The results in Table 1.2 only describe the colour observed in each tube; they are not numerical measurements.
The colour is described but not measured numerically.
Background Concept
Qualitative data describe or categorise an observation (e.g. colour, presence/absence, type), while quantitative data give a numerical value obtained by measurement. Recording whether a tube looks "green" or "blue" only describes a property; it does not give a number that can be compared objectively or processed statistically. To make colour change quantitative, a colorimeter is used to give an absorption value.
Understanding the Question
Table 1.2 records the colour seen in each tube after 10 minutes. We are asked why these particular results are qualitative, i.e. why they are not quantitative.
Approach
Recall the distinction: quantitative data have units and a numerical value; qualitative data do not. Look at exactly what the student wrote down.
Step-by-Step Reasoning
The student wrote "green" for tubes 1 and 2 and "blue" for tubes 3 and 4. These are descriptive words, not numbers with units. They tell us what was seen, but not how much. To make the data quantitative, the student would need to use a colorimeter to record an absorption value (as they do later in part (f)).
Key Takeaways
- Qualitative results are descriptions or categories; quantitative results are numerical measurements.
- Colour change observed by eye is qualitative; absorption measured by a colorimeter is quantitative.
Common Mistakes
Stating that the data are inaccurate or imprecise — being qualitative is not the same as being inaccurate; it simply means the data are categorical rather than numerical.
Things to Be Careful About
Do not confuse "qualitative" with "subjective" or "wrong". The observation can be exactly correct and still be qualitative.
Explain why tubes 2, 3 and 4 were included.
Answer
- They act as controls, allowing the effect in tube 1 to be compared with tubes in which one factor is missing.
- They show that all three factors — chloroplast suspension, DCPIP and light — are required for the colour change: tube 2 shows DCPIP is needed; tube 3 shows chloroplast suspension is needed; tube 4 shows light is needed.
Controls showing that DCPIP, chloroplasts and light are all needed for the colour change.
Background Concept
A control is a tube (or experiment) that differs from the test by only one variable, so that any difference in the outcome can be attributed to that variable. In this investigation tube 1 contains chloroplasts + DCPIP and is illuminated; tubes 2, 3 and 4 each vary one factor from tube 1.
Understanding the Question
We are asked why the experimenter set up tubes 2, 3 and 4 in addition to the main tube 1. Each of these tubes is missing one component (or has one factor changed), so they act as controls.
Approach
Identify what each control tube has that tube 1 does not (or vice versa) and what that lets us conclude.
Step-by-Step Reasoning
- Tube 2 (chloroplasts + distilled water, illuminated): no DCPIP. The colour stays green because of the chloroplasts themselves, but DCPIP does not change — so DCPIP must be present for the blue → colourless/green change to be observed.
- Tube 3 (DCPIP + extraction medium, illuminated): no chloroplasts. The DCPIP stays blue, showing that the chloroplast suspension is required.
- Tube 4 (chloroplasts + DCPIP, foil-covered): no light. The DCPIP stays blue, showing that light is required for the light-dependent reaction (and therefore for the reduction of DCPIP).
Together, tubes 2, 3 and 4 demonstrate that all three factors — chloroplasts, DCPIP and light — must be present for the reaction (and hence the colour change) to occur. They act as controls against which tube 1 is compared.
Key Takeaways
- Controls isolate the effect of one variable at a time.
- Tube 2 controls for the absence of DCPIP; tube 3 for the absence of chloroplasts; tube 4 for the absence of light.
Common Mistakes
- Stating that the controls "show what happens without the reaction" without naming the specific factor each one tests.
- Saying the controls are "for comparison" without explaining what they show.
Things to Be Careful About
Tube 2 is green after 10 minutes (not blue). This is because the chloroplast suspension itself is green; it has not changed. Do not describe it as decolourised or as the same colour as tube 1 without explanation.
State the function of the thin tank of water.
Answer
The thin tank of water absorbs heat (infra-red radiation) from the lamp, preventing the tubes from heating up and so preventing temperature from affecting the reaction.
To absorb heat from the lamp so the tubes do not get hot.
Background Concept
Lamps emit both visible light and infra-red (heat) radiation. Biological reactions are sensitive to temperature, so any heat reaching the sample would alter the rate of the light-dependent reaction independently of light intensity. A water tank placed between the lamp and the sample absorbs the infra-red radiation while allowing visible light to pass through.
Understanding the Question
The lamp is positioned some distance from the tubes. Without anything between them, the tubes would receive both light and heat from the lamp. A thin glass tank of water is placed in the path. We need to state its function.
Approach
Recognise that the lamp produces heat as well as light and that a layer of water absorbs the heat without significantly reducing the light reaching the tubes.
Step-by-Step Reasoning
The tank is positioned between the lamp and the test tube (see Fig. 1.3). Water is a good absorber of infra-red radiation but transmits visible light, so the heat from the lamp is absorbed by the water and the light passes through. This keeps the tubes at a constant (room) temperature so that temperature does not become a confounding variable when comparing tubes.
Key Takeaways
- Water absorbs heat but transmits light — it acts as a heat filter.
- The water tank controls temperature as an unwanted variable.
Common Mistakes
- Saying it "filters the light" — it does not; visible light passes through.
- Saying it "cools the tubes" — it prevents them heating up in the first place.
Things to Be Careful About
The tank is a heat filter, not a light filter. Its function is to remove the heat component of the lamp's output.
The student then modified the investigation to test the hypothesis:
As light intensity increases the rate of the light dependent stage of photosynthesis will increase.
Identify the independent variable and the dependent variable in this investigation.
independent ______
dependent ______
Answer
- Independent variable: light intensity (varied by changing the distance of the lamp from the tube).
- Dependent variable: time taken for the DCPIP to decolourise (or for the mixture to turn green).
Independent: light intensity (or distance of the lamp from the tube). Dependent: time taken for the DCPIP to decolourise.
Background Concept
The independent variable is what the experimenter deliberately changes. The dependent variable is what is measured to see the effect of that change. Variables that could affect the result but are kept constant are control variables.
Understanding the Question
The student is going to test the hypothesis: "As light intensity increases, the rate of the light-dependent stage of photosynthesis will increase." We must identify what will be changed (the independent variable) and what will be measured (the dependent variable).
Approach
Read the hypothesis: the rate of the light-dependent reaction is the outcome; light intensity is the factor being changed. Decide how each can be measured in this set-up.
Step-by-Step Reasoning
- Light intensity is the factor being changed. In this apparatus, light intensity is varied by moving the lamp closer to or further from the tube. The formula relates the two, but the experimenter simply changes the distance.
- Rate of the light-dependent reaction is the outcome. The student will measure how long it takes for the DCPIP to be reduced (i.e. for the blue colour to disappear / the mixture to turn green). Time is therefore the dependent variable, since rate = when the amount of DCPIP is constant.
Key Takeaways
- The variable that the experimenter deliberately changes is independent.
- The variable measured to record the effect is dependent.
- "Time to decolourise" is a valid dependent variable when the amount of DCPIP is constant, because rate is inversely related to that time.
Common Mistakes
- Stating "rate of photosynthesis" as the dependent variable — the student cannot measure rate directly; they measure the time for the colour change, and infer rate from it.
- Confusing distance and light intensity — the experimenter moves the lamp, but the variable being changed is light intensity, with distance as a means to vary it.
Things to Be Careful About
Either "light intensity" or "distance of the lamp from the tube" is accepted as the independent variable; they are linked by the formula in Fig. 1.4.
Using the apparatus shown in Fig. 1.3, describe a method the student could use to collect the data needed to test their hypothesis.
Your method should be set out in a logical way and be detailed enough to let another person follow it.
Method
- Set up the apparatus as shown in Fig. 1.3, with the lamp, thin water tank and a foil-covered test tube containing the chloroplast suspension + DCPIP mixture.
- Place the lamp at each of five different distances from the test tube within the range 10–200 cm (e.g. 20, 40, 60, 80 and 100 cm) to vary the light intensity. Keep the water tank at the same distance from the tube/light source at every trial.
- For each distance, use the same volume of chloroplast suspension (e.g. ) and the same volume and concentration of DCPIP (e.g. ) in the test tube.
- Remove the foil, place the tube in front of the water tank, and start the timer immediately.
- Stop the timer as soon as the DCPIP decolourises (i.e. the mixture matches the green colour of a control tube containing chloroplast suspension + distilled water — tube 2 from the original investigation — used as a colour comparator). Record the time taken.
- Repeat the whole procedure at each distance at least twice and calculate a mean time for each distance (or identify and discard any anomalies before averaging).
- Calculate the light intensity at each distance using , then plot a graph of rate () against light intensity.
Safety
The lamp becomes hot during use — do not touch the bulb or its housing; allow it to cool before handling.
Vary lamp–tube distance over five values in 10–200 cm, time how long DCPIP takes to decolourise (using tube 2 as a colour comparator), standardise volumes and the water-tank position, repeat and average, then calculate at each distance.
Background Concept
To test the effect of light intensity on the rate of the light-dependent reaction, the experimenter varies the light falling on a constant chloroplast + DCPIP mixture and records the time taken for the DCPIP to be reduced. Because the light intensity from a point source falls off as (the inverse-square law), moving the lamp is the standard way of changing intensity. To make the test fair, every other factor that could affect the reaction (volumes, concentrations, temperature, water-tank position) must be kept constant.
Understanding the Question
The student is going to use the apparatus in Fig. 1.3 to test: "As light intensity increases, the rate of the light-dependent stage of photosynthesis will increase." We need a method detailed enough for another person to follow, in a logical order, that will generate the data required to test the hypothesis.
Approach
- Decide how to vary the independent variable (light intensity) — by moving the lamp.
- Decide what to measure (time for DCPIP to decolourise) and how to judge the end-point (compare with a tube of chloroplasts without DCPIP, which stays green).
- List the variables to keep constant and how to control them.
- Plan replication and a mean, and the safety precautions.
Step-by-Step Reasoning
- Varying the intensity. Because , moving the lamp changes the intensity. The mark scheme requires at least five distances in the range 10–200 cm, so plan e.g. 20, 40, 60, 80 and 100 cm.
- The measurement. The reaction is followed by the colour change of DCPIP (blue → colourless/green). The time from exposure to full decolourisation is recorded; rate is then (constant amount of DCPIP). To judge the end-point reliably, the student should use a colour comparator — a separate tube containing the chloroplast suspension plus distilled water (i.e. tube 2 from the original investigation), which is the colour the decolourised mixture will become. Match the test tube to this comparator by eye.
- Controls (standardised variables). The same volume of chloroplast suspension, the same volume of DCPIP, and the same concentration of DCPIP must be used at every distance. The water tank must stay at the same distance from the tube/light source at every trial, otherwise it is filtering a different fraction of the beam.
- Reliability. Repeat each distance at least twice and calculate a mean. Anomalous readings can be identified and discarded before averaging.
- End-point timing. Start the timer the moment the tube is exposed to light. Stop the timer the moment the colour matches the comparator. Recording the time taken (rather than the colour at a fixed time) makes the rate calculation straightforward.
- Safety. The lamp becomes hot during use. Do not touch the bulb or its housing; allow it to cool before handling. The chloroplast suspension is harmless but care should be taken to avoid spillages on the bench.
Key Takeaways
- A good plan names the independent variable, how it is varied, the dependent variable and how it is measured, the variables that must be standardised, replication, and a safety point.
- Use a colour comparator to judge an end-point reliably by eye.
- Vary the lamp–tube distance over at least five values across a wide range.
Common Mistakes
- Stating only one or two distances — the mark scheme requires at least five in the range 10–200 cm.
- Forgetting to use a comparator (e.g. tube 2) to decide when to stop timing.
- Varying the concentration of DCPIP between trials — that would change the dependent variable's scale.
- Failing to start the timer the moment the tube is illuminated.
- Omitting a safety point.
Things to Be Careful About
- "Time for the DCPIP to decolourise" is the measurement; "rate of the light-dependent reaction" is what is inferred from it.
- The water tank must be at the same distance from the tube (or lamp) at every trial.
- Distances must be in the range 10–200 cm; placing the lamp right next to the tube (a few cm) may overheat the sample, while very large distances give very low intensities and ambiguous end-points.
Light intensity () can be calculated using the formula shown in Fig. 1.4.
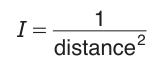
Use the formula shown in Fig. 1.4 to calculate the light intensity for the investigation shown in Fig. 1.3.
= ______
Working
distance =
Answer
(with distance in cm)
Background Concept
The light intensity at a point a given distance from a point source is given by the inverse-square law:
Fig. 1.4 expresses this as , with the answer in whatever unit matches the unit of distance used.
Understanding the Question
Fig. 1.3 shows the lamp from the test tube. We must substitute this distance into the formula to find the light intensity used in the original investigation.
Approach
Substitute distance = into . The mark scheme's accepted answer shows the distance should be left in cm, not converted to metres.
Step-by-Step Reasoning
If the distance were converted to metres (), the answer would be , but the mark scheme accepts , so the distance is left in cm.
Key Takeaways
- Light intensity from a point source falls as .
- The units of the answer are determined by the unit of the distance used; here cm gives an answer in the form .
Common Mistakes
- Converting to metres and quoting — that answer is not accepted here because the mark scheme expects the answer from in cm.
- Forgetting to square the distance.
Things to Be Careful About
The formula in Fig. 1.4 has no units, so the answer inherits the units implied by the distance. Match the form of the answer to the mark scheme's accepted form.
The student prepared two tubes with the same contents as tube 1 (Table 1.1) from their original investigation. One tube was exposed to high light intensity and the other tube was exposed to low light intensity.
A colorimeter was used to measure the absorption values of samples taken from these tubes, at one minute intervals, over a period of 12 minutes.
Fig. 1.5 shows the absorption results at high light intensity.
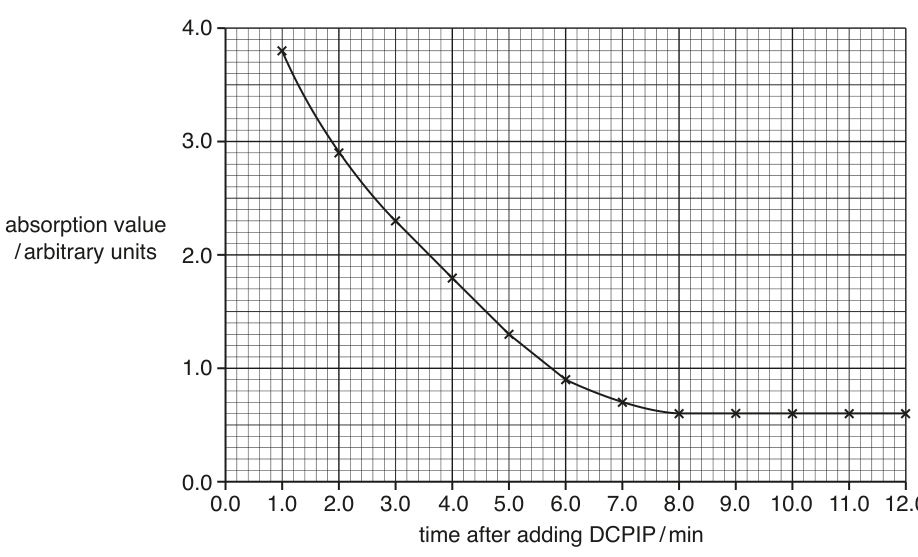
The student concluded that the reaction reached completion at 8 minutes. State why the data in the graph do not support this conclusion.
Answer
There are no data points between 7 and 8 minutes, so the graph does not show precisely when the reaction reached completion — the curve could have levelled off any time in that interval.
No data between 7 and 8 min, so the precise time of completion cannot be confirmed.
Background Concept
A conclusion about when a reaction finishes can only be supported by data that show the reaction is still proceeding (absorption still falling) just before the supposed end-point, and that the reading has stopped changing just after. With data every minute, an end-point can only be pinned to the nearest whole minute.
Understanding the Question
The student concluded that the reaction in Fig. 1.5 was complete at 8 minutes because the curve appears to plateau from 8 min onwards. We are asked why the data on the graph do not actually support that precise conclusion.
Approach
Look at the spacing of the data points. The student took readings every minute, so the only readings are at 1, 2, 3, … 7, 8, 9, 10, 11, 12 min. There is no reading between 7 and 8 min.
Step-by-Step Reasoning
Because no absorption value is recorded between 7 and 8 minutes, the student cannot tell whether the reaction was still going at, say, 7 min 30 s and only just completed by 8 min, or whether it had already finished by 7 min 30 s. The data only allow the conclusion that the reaction had completed by 8 min, not that it completed at 8 min.
Key Takeaways
- A conclusion about timing must be backed up by data at the right resolution.
- "Completed at 8 min" and "completed by 8 min" are different claims.
Common Mistakes
- Saying the data "don't show a plateau" — they do; the issue is the spacing of the points, not the existence of a plateau.
- Saying the data are inaccurate.
Things to Be Careful About
A reading taken every minute can only pin an end-point to the nearest minute, so 8 min is the resolution limit of the data.
Draw a tangent on Fig. 1.5 and use it to calculate the rate of change at 6 minutes.
rate of change at 6 minutes = ______ arbitrary units
Working
Draw a tangent to the curve at — the tangent should just touch the curve at the point and have the same slope as the curve there.
Reading off two convenient points on the tangent, e.g. and :
Answer
Rate of change at 6 min arbitrary units (any value with magnitude in the range to is accepted).
arbitrary units
Background Concept
The rate of change of one variable with respect to another at a particular point on a curve is given by the gradient of the tangent at that point. The tangent is a straight line that just touches the curve at the point of interest and has the same slope as the curve at that point. A large triangle (i.e. one that uses well-separated points on the tangent) gives a more accurate estimate of the gradient than a small one.
Understanding the Question
The student needs to find the instantaneous rate at which absorption is changing at the 6-minute mark on the curve. The curve is decreasing through , so the rate will be negative. The mark scheme accepts values in the range to in magnitude.
Approach
- Place a ruler on the curve so that it just touches the curve at and has the same gradient there — i.e. it follows the curve's direction at that point without cutting it.
- Choose two well-separated points on the tangent (well clear of the curve's bends).
- Read off their coordinates and use .
Step-by-Step Reasoning
A typical tangent at on this curve passes through approximately and :
The negative sign indicates the absorption is still decreasing. The mark scheme's accepted range is – in magnitude, so a value of about is appropriate. Different reasonable tangents will give slightly different values in this range.
Key Takeaways
- The rate of change at a point is the gradient of the tangent at that point.
- A large triangle gives a more accurate gradient than a small one.
- The mark scheme accepts a magnitude in –, so the answer is not unique.
Common Mistakes
- Drawing the tangent at the wrong time (e.g. at 4 min or 8 min).
- Using two points on the curve instead of on the tangent — that gives the average gradient over an interval, not the instantaneous rate.
- Quoting the units of the answer as just "arbitrary units" rather than "arbitrary units per minute".
Things to Be Careful About
The units of rate are arbitrary units per minute. The mark scheme's "0.2 to 0.4" is the magnitude; including the negative sign is correct because the curve is decreasing.
On Fig. 1.5, sketch the curve that you would expect for the tube at low light intensity.
Answer
Draw a similar decreasing curve to the right of the original — the absorption falls more slowly, reaches the same final plateau () later, and the curve spans the full 1–12 min range. The plateau is at the same final absorption because the same total amount of DCPIP is being reduced.
Curve to the right of the original (slower decrease, reaches plateau later), drawn across 1–12 min.
Background Concept
A lower light intensity means fewer photons reach the chloroplasts, so the rate of the light-dependent reaction is lower, and DCPIP is reduced more slowly. The same total amount of DCPIP is present in the tube, so the final absorption value reached (when all the DCPIP is reduced) is the same as in the high-intensity tube — only the time taken to reach it changes.
Understanding the Question
We need to sketch on Fig. 1.5 the curve the student would expect for a tube exposed to a low light intensity. The original curve was drawn at high light intensity.
Approach
Predict how the rate changes (lower → slower decrease) and how the end-point changes (same total DCPIP → same final absorption, but reached later).
Step-by-Step Reasoning
- Slower decrease: the curve drops less steeply than the high-intensity curve.
- Same final value: both tubes contain the same amount of DCPIP, so both must end at the same absorption ().
- Reached later: the low-intensity curve will reach the plateau at a time min.
- The curve must therefore be to the right of the original at every time before the plateau, and it should be drawn across the whole 1–12 min range of the x-axis.
Key Takeaways
- A change in an independent variable that slows the reaction produces a curve that descends more slowly but reaches the same end-point.
- The final value is set by the amount of substrate (DCPIP), not by the rate.
Common Mistakes
- Drawing the curve to the left of the original — this would imply a higher rate, the opposite of what low light intensity gives.
- Drawing the curve plateauing at a higher absorption — that would imply less DCPIP was reduced.
- Drawing only part of the curve (e.g. not extending it across the full 1–12 min range).
Things to Be Careful About
The mark scheme requires the curve to be to the right of the original and to span the full 1–12 min range.
The student then investigated the effect that three different weed killers had on the light dependent reaction.
- Four tubes covered in foil were set up containing the mixtures shown in Table 1.3.
- The volume of each component in the mixtures was standardised.
Table 1.3
| tube | contents |
|---|---|
| 1 | chloroplast suspension, DCPIP and distilled water |
| 2 | chloroplast suspension, DCPIP and weed killer X |
| 3 | chloroplast suspension, DCPIP and weed killer Y |
| 4 | chloroplast suspension, DCPIP and weed killer Z |
- The foil was removed and the tubes were illuminated as in the original investigation shown in Fig. 1.3.
- After 10 minutes the student used a colorimeter to measure the absorption value of the contents of each tube.
- The investigation was repeated a number of times and means were calculated.
- -tests were used to compare the results for the tubes.
The results of all the -tests are shown in Table 1.4.
Table 1.4
| contents of tube | no weed killer added | weed killer X | weed killer Y |
| no weed killer added | |||
| weed killer X | not significant | ||
| weed killer Y | significant | significant | |
| weed killer Z | significant | not significant | not significant |
Suggest a null hypothesis for the -test used for tubes 1 and 2.
Answer
There is no significant difference between the mean absorption values for tube 1 (no weed killer) and tube 2 (weed killer X).
There is no significant difference between the mean absorption values for tubes 1 and 2.
Background Concept
A null hypothesis () is the statistical statement that there is no significant difference (or no significant effect/association) between the populations from which the samples are drawn. It is the hypothesis that the t-test evaluates directly; the alternative hypothesis () is the opposite — that a significant difference does exist. If the calculated exceeds the critical value at , is rejected.
Understanding the Question
The student is going to use a t-test to compare tubes 1 and 2 from Table 1.3 — i.e. chloroplasts + DCPIP with no weed killer (tube 1) and chloroplasts + DCPIP with weed killer X (tube 2). We must state the null hypothesis for that comparison.
Approach
State, in words, that the means of the two populations from which the samples are drawn are equal, naming the two tubes.
Step-by-Step Reasoning
The t-test is comparing the mean absorption values of the contents of tube 1 and tube 2. The null hypothesis is therefore that these two means are not significantly different — i.e. that any observed difference between the sample means is due to chance variation between replicates, not to the weed killer.
Key Takeaways
- A null hypothesis is always a statement of "no significant effect" or "no significant difference".
- It must refer to the specific quantities being compared.
Common Mistakes
- Phrasing the null hypothesis as a research hypothesis ("weed killer X changes the rate") — the research hypothesis is the alternative, not the null.
- Omitting the word "significant" — without it, the null is trivially false because the means are unlikely to be exactly equal.
Things to Be Careful About
The null hypothesis always contains "no significant difference" (or equivalent), and refers to the populations, not just the samples.
The -tests were used to compare the means. State one feature of data that allows use of the -test.
Answer
Any one of:
- The data are continuous (absorption values measured on a continuous scale).
- The data are normally distributed (or the sample size is large enough for the central limit theorem to apply).
- The standard deviations of the two samples are approximately equal.
- The sample sizes are small () — i.e. the t-test is appropriate because the sample size does not justify the z-test.
Continuous data / normally distributed / similar standard deviations / sample size < 30 (any one).
Background Concept
The t-test makes assumptions about the data:
- The data are continuous (so a mean is meaningful).
- The data are normally distributed in each population (or the sample is large enough for the central limit theorem to make the sampling distribution of the mean approximately normal — the t-test is robust to mild departures when sample sizes are similar).
- The two populations have similar standard deviations (homogeneity of variance).
- The samples are small (typically ) — the t-test is the correct test for small samples; for large samples the z-test would be used instead, but the two converge.
- The samples are independent.
The CIE mark scheme accepts any one of: continuous; normally distributed; similar standard deviations; sample size less than 30.
Understanding the Question
The student is going to use a t-test on the absorption data from Table 1.3. We are asked to state one feature of the data that allows the t-test to be used.
Approach
Pick one of the assumptions above that is met by these data.
Step-by-Step Reasoning
- Continuous data: absorption values from a colorimeter are measured on a continuous scale, so a mean is appropriate.
- Normally distributed: the population of absorption values for each tube is assumed to be approximately normal — reasonable for replicated colorimeter readings.
- Similar standard deviations: the variation between replicates of one tube should be similar to the variation between replicates of another.
- Small sample size: the mark scheme for part (iii) shows per tube, which is less than 30, so the t-test is preferred over the z-test.
Any one of these is sufficient.
Key Takeaways
- The t-test is the appropriate test for comparing two means from small, continuous, approximately normal samples with similar variances.
- For larger samples the z-test is used; the two converge as grows.
Common Mistakes
- Listing several assumptions and getting them confused.
- Stating an assumption that is not a feature of the data (e.g. "the samples are random") without justification.
Things to Be Careful About
Any one of the four features is accepted; pick the one you can justify most clearly.
The student calculated that there were 22 degrees of freedom in each of these -tests. An equal number of replicates for each tube was carried out.
State the number of replicates of each tube that were carried out.
Working
For a two-sample (unpaired) t-test, the degrees of freedom are:
With equal sample sizes () and :
Answer
12 replicates of each tube.
12
Background Concept
For a two-sample (unpaired) t-test the degrees of freedom are , where and are the sample sizes of the two groups being compared. Each observation "uses up" one degree of freedom for the mean; one further degree of freedom is used for the difference between the two means; the remaining observations are free to vary.
Understanding the Question
Each t-test in Table 1.4 has 22 degrees of freedom, and the two tubes being compared in each test had an equal number of replicates. We need to find the number of replicates per tube.
Approach
Set and use to solve for .
Step-by-Step Reasoning
So 12 replicates were carried out for each tube.
Key Takeaways
- for a two-sample t-test.
- If , then .
Common Mistakes
- Using (which is the formula for a one-sample t-test, not a two-sample one).
- Using (forgetting to subtract 2).
- Halving 22 to get 11 (the formula is , not ).
Things to Be Careful About
The t-test here compares two tubes, so the two-sample formula applies.
The critical value for at in this investigation was 2.07.
State what the results in Table 1.4 tell you about the student’s calculated value of when comparing the effect between weed killers X and Y.
Answer
The calculated value for weed killer X vs weed killer Y is greater than 2.07 (the critical value), so the difference between their mean absorption values is statistically significant.
Calculated (the critical value).
Background Concept
A t-test is significant at when the calculated value exceeds the critical value. The critical value is read from a t-table at the given degrees of freedom and the chosen probability level; here the critical value is given as 2.07. If calculated , the null hypothesis (no significant difference) is rejected.
Understanding the Question
Table 1.4 shows the result of the t-test comparing weed killer X with weed killer Y is significant. We must state what this tells us about the calculated value.
Approach
A "significant" result at means the calculated value exceeded the critical value for that probability level.
Step-by-Step Reasoning
The critical value for at with 22 df is 2.07. Because the result in Table 1.4 for X vs Y is "significant", the student's calculated for that comparison must have been greater than 2.07. This means the difference between the mean absorption values for tubes 2 and 3 is unlikely to be due to chance variation between replicates — i.e. weed killer X and weed killer Y have significantly different effects on the light-dependent reaction.
Key Takeaways
- "Significant" in a t-test summary means calculated > critical value.
- The exact calculated is not given; only the significance is reported.
Common Mistakes
- Stating that calculated is equal to 2.07 — the table does not give the exact value, only that it exceeds the critical value.
- Confusing "significant" with "large"; the word has a specific statistical meaning here.
Things to Be Careful About
The wording in the mark scheme: "greater than 2.07" or "2.07 is less than the calculated value". Either is acceptable; do not give the calculated value as 2.07 itself.
The rest of this paper
1 more questions- Q2Planning · Analysis, Conclusions and Evaluation8M