Biology 9700/52 — February/March 2018
Cambridge A-Level · Planning, Analysis and Evaluation · worked solutions for every part, with the mark scheme
Topics Analysis, Conclusions and Evaluation · Planning
Biological washing liquids are solutions that contain enzymes to help remove stains caused by biological molecules. One of these enzymes is lipase.
These washing liquids are concentrated solutions and need to be diluted with water to reach their ‘working’ concentrations.
A group of students was asked to find the ‘working’ concentration of the enzyme lipase for two different biological washing liquids, A and B.
The recommended dilutions for washing fabrics using these biological washing liquids are:
A – of washing liquid in water
B – of washing liquid in water.
The students found a website that lists the concentration of lipase in different biological washing liquids before they are diluted. These concentrations vary between and .
The students used the information from the website and the recommended dilutions to calculate the concentrations of lipase that could be present in ‘working’ concentrations of washing liquid.
The students calculated the maximum possible concentration of lipase in washing liquid A when diluted, as shown below.
The maximum possible concentration of lipase in washing liquid A before dilution is:
Therefore, the maximum possible concentration of lipase in diluted washing liquid A is:
Complete the calculation below to show the minimum possible concentration of lipase in diluted washing liquid B.
The minimum possible concentration of lipase in washing liquid B before dilution is:
______
Therefore, the minimum possible concentration of lipase in diluted washing liquid B is:
The students simulated fat-stained fabric by cutting pieces of cotton fabric and soaking them in cooking oil. The fabric pieces were then allowed to dry.
The students diluted both washing liquids according to the recommended dilutions, added a piece of fat-stained cotton fabric to each and measured the activity of lipase using a pH probe and stop-clock. The students recorded the time taken for the pH to decrease from 7.9 to 6.5. The pH decreases because fatty acids are produced from the hydrolysis of fats by lipase.
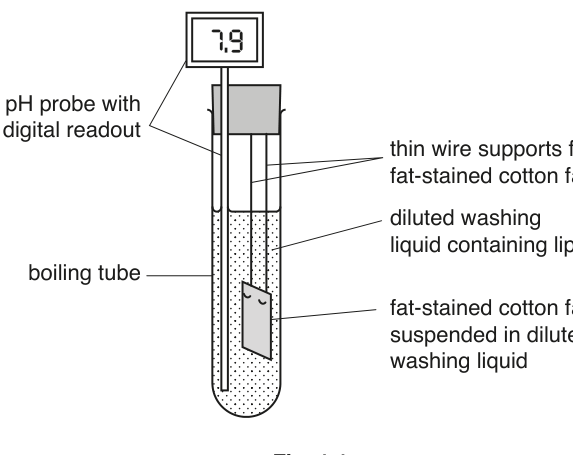
Fig. 1.1 shows the apparatus the students used.
Table 1.1 shows the results of two trials using each of the diluted washing liquids at the recommended temperature of . This is lower than the optimum temperature of lipase, which is .
Table 1.1
| trial | time for pH to decrease from 7.9 to 6.5 / min | |
|---|---|---|
| diluted washing liquid A | diluted washing liquid B | |
| 1 | 14 | 30 |
| 2 | 17 | 35 |
To find the ‘working’ concentrations of lipase in diluted washing liquids A and B, the students decided to make a range of lipase concentrations from to . They were provided with a stock solution of lipase with a concentration of .
Describe how the students could dilute the stock solution to make solutions of lipase with a range of concentrations from to . of each solution is required.
The students used the apparatus shown in Fig. 1.1 to investigate the effect of lipase concentration on the activity of lipase. They used the different concentrations of lipase that they had decided to prepare.
Identify the independent and dependent variables in this investigation.
independent variable = ______
dependent variable = ______
Describe a method the students could use to find the effect of the different concentrations of lipase on the activity of lipase, using the apparatus shown in Fig. 1.1.
Your method should be set out in a logical order and be detailed enough for another person to follow. It should not repeat the details from (b) of how to dilute the stock lipase solution.
The students used the results of their investigation to calculate the activity of lipase as the rate of release of fatty acids from fats. They then plotted a graph of their results.
State how the rate of release of fatty acids from fats is calculated from the students’ results.
Complete Fig. 1.2 to show the effect of lipase concentration on the rate of release of fatty acids from fats, by drawing the expected shape of the curve and labelling the axes, including units.
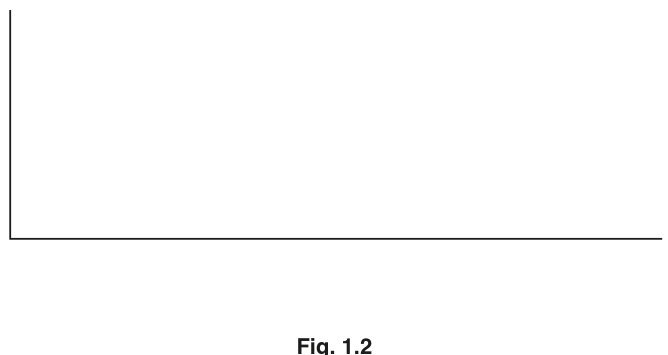
Describe how the students would use this graph to find the ‘working’ concentrations of lipase in diluted washing liquids A and B.
The students’ results suggested that diluted washing liquid A had a higher concentration of lipase than diluted washing liquid B.
Suggest one reason why this conclusion may not be valid.
The rest of this paper
1 more questions- Q2Planning · Analysis, Conclusions and Evaluation10M