Biology 9700/52 — October/November 2017
Cambridge A-Level · Planning, Analysis and Evaluation · worked solutions for every part, with the mark scheme
Topics Planning · Analysis, Conclusions and Evaluation
The enzyme lactase hydrolyses the disaccharide lactose to glucose and galactose. This enzyme is produced in the small intestine of mammals and by some fungi and bacteria.
Fig. 1.1 shows this reaction.

The Michaelis-Menten constant, , shows the affinity of an enzyme for its substrate. The lower the the greater the affinity.
A student carried out an investigation to find the of the enzyme lactase at different pH values commonly found in organisms.
The student:
- made of solution of lactose, molar mass
- used proportional dilution to make a total of five lactose solutions from stock solution, each of
- used per lactase solution
- used a glucose biosensor to measure the initial rate of reaction at each pH. A glucose biosensor measures glucose in .
Fig. 1.2 shows the experimental set-up.
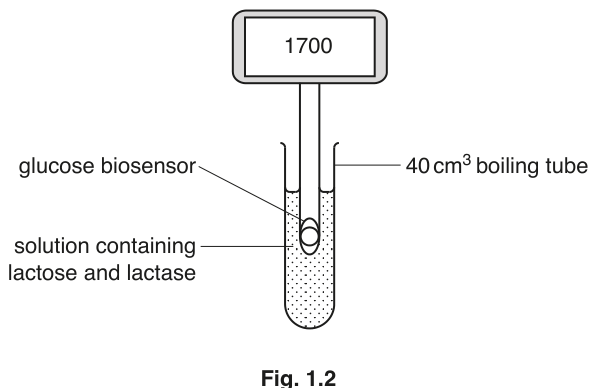
Describe how the student could make of solution of lactose.
Describe how the student made a further four solutions of lactose by proportional dilution.
Identify the independent and dependent variables in this investigation.
independent ______
dependent ______
Suggest a suitable control for this investigation.
Describe a method that the student could use to find the of lactase at different pH values. The solutions were made as described in (a) (i) and (a) (ii) and the apparatus shown in Fig. 1.2 was used.
Your method should be set out in a logical way and be detailed enough to let another person follow it.
You should not include details of how to make the lactose or lactase solutions.
Complete Fig. 1.3 by sketching a graph to show the effect of substrate concentration at one pH on the initial rate of reaction.
Indicate on your graph how the student could find the value of lactase at that pH.
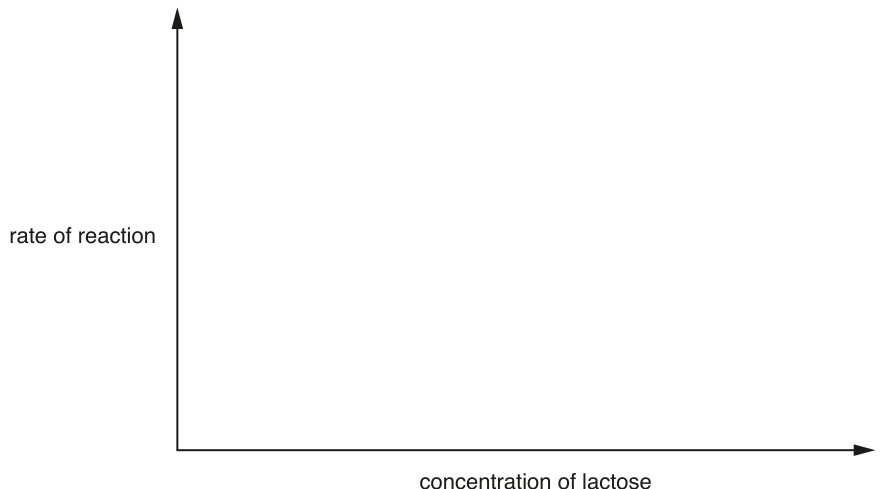
Table 1.1 shows the results that the student obtained for at different pH values.
Table 1.1
| pH | A | B | C | D | E |
|---|---|---|---|---|---|
| / arbitrary units | 0.216 | 0.112 | 0.166 | 0.178 | 0.324 |
State which of these pH values, A to E, is closest to the likely optimum pH of lactase.
Explain your answer.
The rest of this paper
1 more questions- Q2Planning · Analysis, Conclusions and Evaluation11M