Biology 9700/53 — May/June 2017
Cambridge A-Level · Planning, Analysis and Evaluation · worked solutions for every part, with the mark scheme
Topics Planning · Analysis, Conclusions and Evaluation
A student used the internet to find information about caffeine and the possible effects it has on the body.
The student decided to test the hypothesis that:
Caffeine decreases the reaction time and increases the heart rate.
Table 1.1 shows the results of the student’s research into the caffeine content of drinks.
Table 1.1
| drink | cup of coffee | cup of tea | energy drink | cola |
|---|---|---|---|---|
| caffeine content/mg | 80 | 40 | 30 | 45 |
The student also found that it takes about 45 minutes before caffeine from a drink is fully absorbed into the blood and about 4 to 5 hours for the effect to wear off.
After further research, the student decided:
- test subjects should not know whether they are having a drink with caffeine or without caffeine
- drinks with caffeine and without caffeine should look identical
- to measure the subject’s reaction time using a computer programme that flashes a coloured light at random intervals. The subject presses a switch as soon as they see the light
- to measure the heart rate using a pulse meter attached to the first finger.
Suggest why it is important that the test subjects should not know whether they are having a drink with caffeine or without caffeine.
State the independent variable and the two dependent variables in this investigation.
independent variable = ______
dependent variables = ______
Use the information given to describe a method by which the student could test their hypothesis using one of the drinks.
Your method should be detailed enough for another person to follow.
In another experiment 10 subjects were each given a different concentration of caffeine. The reaction time was measured 5 times for each subject and a mean calculated.
Table 1.2 shows the results.
Table 1.2
| subject | 1 | 2 | 3 | 4 | 5 | 6 | 7 | 8 | 9 | 10 |
|---|---|---|---|---|---|---|---|---|---|---|
| concentration of caffeine / | 0 | 40 | 60 | 80 | 100 | 120 | 140 | 160 | 180 | 200 |
| mean reaction time / ms | 355 | 343 | 340 | 321 | 300 | 305 | 288 | 252 | 242 | 204 |
Fig. 1.1 shows the graph produced by a computer programme for the data.
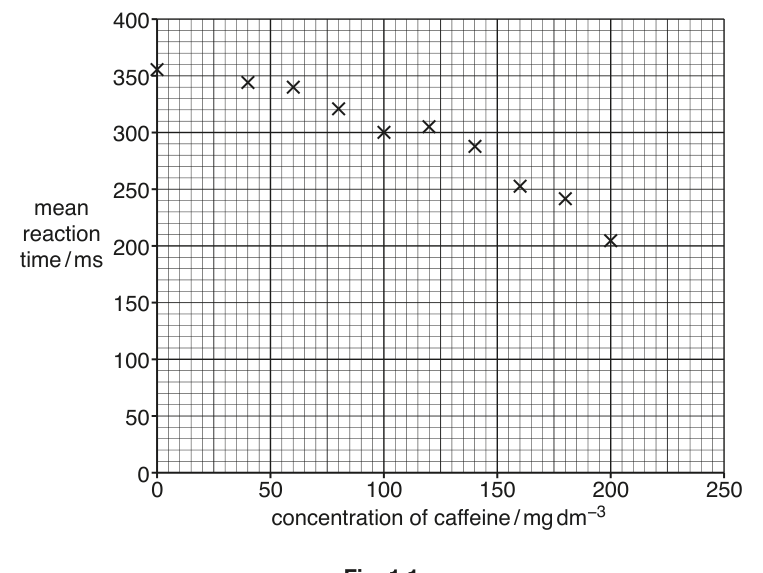
Based on this graph the student decided to use a statistical test to find the strength of the correlation between the concentration of caffeine and the mean reaction time.
State why Pearson’s linear correlation test is suitable for the data.
The results of the statistical test gave Pearson’s linear correlation, .
State what this value indicates about the relationship between the concentration of caffeine and the mean reaction time.
Table 1.3 shows part of a table of critical values for Pearson’s linear correlation test ().
Table 1.3
| number of pairs of data () | probability level () | |||
|---|---|---|---|---|
| 0.10 | 0.05 | 0.02 | 0.01 | |
| 1 | 0.988 | 0.997 | 0.9995 | 0.9999 |
| 2 | 0.900 | 0.950 | 0.980 | 0.990 |
| 3 | 0.805 | 0.878 | 0.934 | 0.959 |
| 4 | 0.729 | 0.811 | 0.882 | 0.917 |
| 5 | 0.669 | 0.754 | 0.833 | 0.874 |
| 6 | 0.622 | 0.707 | 0.789 | 0.834 |
| 7 | 0.582 | 0.666 | 0.750 | 0.798 |
| 8 | 0.549 | 0.632 | 0.716 | 0.765 |
| 9 | 0.521 | 0.602 | 0.685 | 0.735 |
| 10 | 0.497 | 0.576 | 0.658 | 0.708 |
Describe how the student calculated the degrees of freedom.
Describe how the student used the probability table to find out if the value for is significant.
Suggest two reasons why the method used for the investigation into the effect of caffeine concentration may have given results that are not reliable.
Effects of caffeine in the body include the promotion of acetylcholine release and the inhibition of acetylcholinesterase.
Suggest how this could account for the results in Table 1.2.
The rest of this paper
1 more questions- Q2Planning · Analysis, Conclusions and Evaluation10M