Biology 9700/53 — May/June 2016
Cambridge A-Level · Planning, Analysis and Evaluation · worked solutions for every part, with the mark scheme
Topics Planning · Analysis, Conclusions and Evaluation
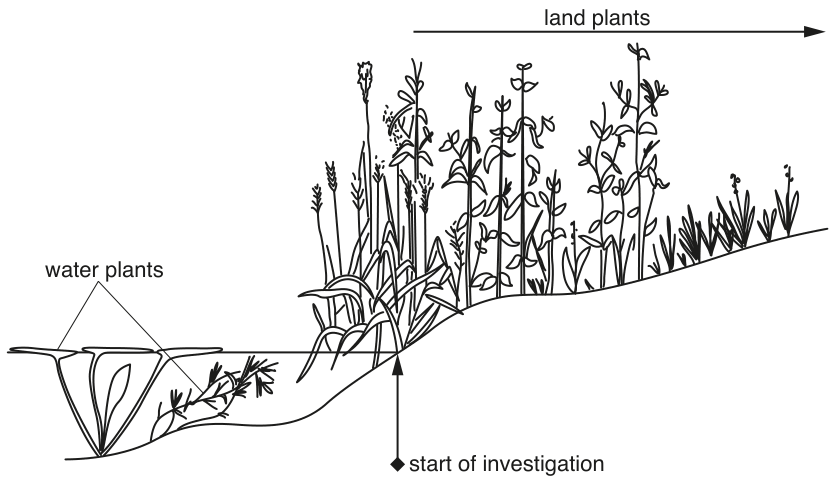
Fig. 1.1 shows some of the plants growing in a pond and on the land around the pond.
Some students decided to investigate the changes in the distribution and abundance of species of land plants at different distances from the edge of the pond.
They started their investigation at the plants growing next to the water, as shown in Fig. 1.1.
State the independent and dependent variables in this investigation.
independent variable = ______
dependent variable = ______
Describe a systematic sampling method the students could use to find out how the distribution and abundance of the plant species changed as the distance from the edge of the pond increased.
Your description of the sampling method should be detailed enough for another person to use.
The students also collected samples of soil at different distances from the pond edge and estimated the water content.
The students wanted to find out if the water content of the soil at the different distances sampled was related to the number of different plant species found at the same distances. To do this, a Spearman’s rank correlation () was carried out using the data in Table 1.1.
Table 1.1
| sample | water content / arbitrary units | rank | number of species | rank | rank difference () | |
|---|---|---|---|---|---|---|
| 1 | 28 | 1 | 3 | 10 | –9 | 81.00 |
| 2 | 26 | 2 | 4 | 9 | –7 | 49.00 |
| 3 | 21 | 3 | 5 | 8 | –5 | 25.00 |
| 4 | 18 | 4 | 6 | 7 | –3 | 9.00 |
| 5 | 15 | 5.5 | 8 | 6 | –0.5 | 0.25 |
| 6 | 14 | 7.5 | 9 | 4.5 | 3 | 9.00 |
| 7 | 15 | 5.5 | 10 | 3 | 2.5 | 6.25 |
| 8 | 14 | 7.5 | 9 | 4.5 | 3 | 9.00 |
| 9 | 13 | 9.5 | 11 | 2 | 7.5 | 56.25 |
| 10 | 13 | 9.5 | 12 | 1 | 8.5 | 72.25 |
The formula for Spearman’s rank correlation is:
= Spearman’s rank correlation
= number of pairs of observations
= difference between each pair of ranked measurements
= sum of
Complete Table 1.1 to show .
Use the information in Table 1.1 to calculate the value for .
Show the values for:
= ______
State what the value for shows about the relationship between soil water content and the number of species present.
The group of students then investigated the relationship between soil air content and the number of different plant species at the same sampling points.
The students calculated the value as +0.86.
Table 1.2 shows part of a Spearman’s rank probability table.
Table 1.2
| (number of pairs) | 8 | 9 | 10 | 11 | 12 |
|---|---|---|---|---|---|
| significance level 5% | 0.738 | 0.700 | 0.648 | 0.618 | 0.618 |
| significance level 1% | 0.881 | 0.883 | 0.794 | 0.755 | 0.727 |
The students concluded that their value of +0.86 for the relationship between soil air content and the number of species present was significant at both the 5% level and 1% level.
Explain how the students reached this conclusion.
Based on the result of their Spearman’s rank test and the significance of the value, the students concluded that:
Soil air content caused the difference in the number of plant species that could grow at different distances from the edge of the pond.
Suggest why this conclusion may not be valid.
The rest of this paper
1 more questions- Q2Planning · Analysis, Conclusions and Evaluation12M