Biology 9700/51 — May/June 2016
Cambridge A-Level · Planning, Analysis and Evaluation · worked solutions for every part, with the mark scheme
Topics Planning · Analysis, Conclusions and Evaluation
Fig. 1.1 shows some of the plants growing in a pond and on the land around the pond.
Some students decided to investigate the changes in the distribution and abundance of species of land plants at different distances from the edge of the pond.
They started their investigation at the plants growing next to the water, as shown in Fig. 1.1.
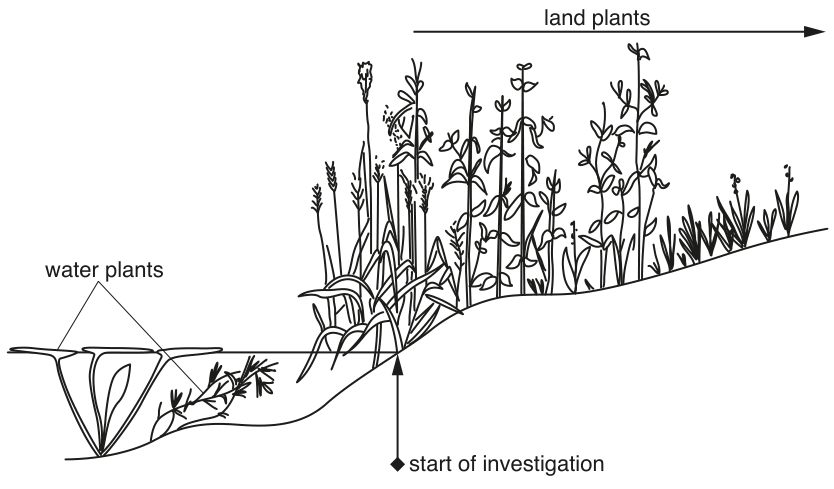
Fig. 1.1
State the independent and dependent variables in this investigation.
independent variable ______
dependent variable ______
Answer
independent variable: distance from the edge of the pond
dependent variable: distribution / abundance / number of (different) species of plant (land plants)
IV: distance from the pond edge; DV: distribution/abundance/number of (different) plant species
Background Concept
In any investigation the independent variable (IV) is what the investigator deliberately changes, and the dependent variable (DV) is what is measured to record the response. Standardising every other variable is needed so that any change in the DV can be attributed to the IV.
Understanding the Question
The students have chosen to vary where along the land they sample (starting at the water's edge) and to record what plant species are present and how abundant they are at each point. The question asks for the IV and DV in exactly those terms.
Approach
Read the brief description of the investigation and decide: what is the student changing on purpose, and what are they counting/recording as the response?
Step-by-Step Reasoning
- The students walk away from the pond and sample at different distances, so the quantity they deliberately vary is distance from the edge of the pond — this is the IV.
- At each distance they record the plant species found and how many there are — the response is the distribution / abundance / number of (different) plant species. This is the DV.
- The mark scheme also accepts equivalent wording such as "types of plant" or "sorts of plant".
Key Takeaways
The IV must be something the experimenter controls/varies; the DV must be measured. Anything else (e.g. weather, soil type) is a control variable to be standardised.
Common Mistakes
- Writing "soil water content" — that belongs to the later part of the question, not to this sampling investigation.
- Calling the DV "plants" without specifying species/abundance/density.
Things to Be Careful About
Use the exact wording from the mark scheme where possible — "distribution/abundance/number of species of plant" is preferred over a vague phrase such as "the plants present".
Describe a systematic sampling method the students could use to find out how the distribution and abundance of the plant species changed as the distance from the edge of the pond increased.
Your description of the sampling method should be detailed enough for another person to use.
Answer
- Lay a line transect (e.g. a measuring tape, or string marked at regular intervals) running away from the edge of the pond, starting at the water's edge and extending at least 10 m up the bank (or until plant composition no longer changes).
- Place the transect in a randomly chosen direction around the pond; repeat the transect at a second randomly chosen point around the pond to obtain replicates.
- At regular intervals (e.g. every 1 m) along the transect, place a 0.5 m × 0.5 m (or 1 m × 1 m) quadrat.
- Within each quadrat, identify each plant species present using a dichotomous key / identification guide / app, and record abundance (e.g. percentage cover, frequency, density or ACFOR scale).
- Take care to search the quadrat thoroughly so that low-growing / small species are not missed.
- Repeat the whole procedure at a different time of year so that seasonal variation is taken into account.
- Safety: a partner/allergy risk requires staying with a partner and wearing gloves / suitable footwear; if hay-fever is a risk, wear a mask.
Line/belt transect laid from pond edge, quadrats of stated size at regular intervals, identify species and estimate abundance, replicate transect around the pond, sample again in a different season, take care with low-growing species and observe relevant safety precautions.
Background Concept
When the distribution of organisms changes along an environmental gradient (here, soil moisture changing with distance from a pond), the appropriate sampling strategy is a transect. A transect is a line, or a strip (belt), across the area in which samples (usually quadrats) are taken at intervals. This is a systematic rather than random method because the position of each quadrat is fixed relative to the start, which is essential when the question is about how things change with distance. A quadrat is a square frame of known area placed on the ground to define a sample; species inside it are identified and their abundance estimated.
Understanding the Question
The students want to know how plant species composition varies from the pond edge into drier land. The question asks for a sampling method so detailed that another person could carry it out. Eight marks are available, allocated across a wide list of credit-worthy points, so the answer needs to cover all the methodological categories the mark scheme rewards.
Approach
Work through the mark-scheme categories and produce a single coherent procedure:
- transect type and how to measure it
- length of transect and how far to extend it
- where to put it
- sampling technique
- sampling interval
- quadrat size
- species identification
- abundance measurement
- care not to miss low-growing species
- replication
- seasonal replication
- safety
Step-by-Step Reasoning
- Transect (mark 1): a line or belt transect is the standard answer; both are accepted.
- Measuring the transect (mark 2): use a tape measure, or a marked string; any method of giving length units works.
- Length (mark 3): at least 10 m, or until plant composition no longer changes.
- Where to place the transect (mark 4): choose the direction randomly so the sample is not biased by one side of the pond. Use at least one extra transect at a different point to replicate.
- Sampling technique (mark 5): a frame quadrat or point frame (or observation along the line of a line transect).
- Sampling interval (mark 6): stated regular intervals (e.g. every 1 m) along the transect — do not randomly throw quadrats.
- Quadrat size (mark 7): a stated size between 0.25 m² and 1 m² (e.g. 0.5 m × 0.5 m) is accepted.
- Identification (mark 8): use a key, photographs, an app, a field guide or an expert; species can be recorded as A, B, C if necessary.
- Abundance (mark 9): count individuals (density), record percentage cover, frequency, or use an abundance scale such as ACFOR or Braun-Blanquet.
- Care with low species (mark 10): kneel down, part the vegetation, search carefully so rosette or small plants are not missed.
- Replication (mark 11): repeat the transect at a second (or more) randomly chosen point around the pond — not the same transect.
- Seasonal replication (mark 12): repeat at a different time of year so the effect of seasonality is captured.
- Safety (mark 13): name a real risk (slipping on wet ground, allergy, hay fever, hazardous plants) and the matching precaution (staying with a partner, gloves, mask, suitable footwear).
Key Takeaways
For a gradient investigation, a transect with quadrats at regular intervals is the standard systematic technique. The procedure must specify: how the transect is measured, how long it is, where it is placed, the quadrat size, the sampling interval, the identification method, the abundance measure, replication (transects and seasons), care with small species, and safety. Random sampling is not appropriate along a gradient.
Common Mistakes
- Describing random quadrat placement rather than a transect — random sampling is wrong here because the question is about change with distance.
- Giving a quadrat size outside the accepted 0.25–1 m² range.
- Mentioning a safety risk without giving the matching precaution, or vice versa.
- Saying "repeat the transect" without specifying a different position around the pond.
- "Take more samples" without specifying how (which axis the marks reward).
Things to Be Careful About
The mark scheme is generous about wording, but every category has to be addressed. Always pair a hazard with its control; never use a vague phrase such as "be careful" or "human error".
The students also collected samples of soil at different distances from the pond edge and estimated the water content.
The students wanted to find out if the water content of the soil at the different distances sampled was related to the number of different plant species found at the same distances.
To do this, a Spearman’s rank correlation () was carried out using the data in Table 1.1.
Table 1.1
| sample | water content / arbitrary units | rank | number of species | rank | rank difference () | |
|---|---|---|---|---|---|---|
| 1 | 28 | 1 | 3 | 10 | –9 | 81.00 |
| 2 | 26 | 2 | 4 | 9 | –7 | 49.00 |
| 3 | 21 | 3 | 5 | 8 | –5 | 25.00 |
| 4 | 18 | 4 | 6 | 7 | –3 | 9.00 |
| 5 | 15 | 5.5 | 8 | 6 | –0.5 | 0.25 |
| 6 | 14 | 7.5 | 9 | 4.5 | 3 | 9.00 |
| 7 | 15 | 5.5 | 10 | 3 | 2.5 | 6.25 |
| 8 | 14 | 7.5 | 9 | 4.5 | 3 | 9.00 |
| 9 | 13 | 9.5 | 11 | 2 | 7.5 | 56.25 |
| 10 | 13 | 9.5 | 12 | 1 | 8.5 | 72.25 |
The formula for Spearman’s rank correlation is:
= Spearman’s rank correlation
= number of pairs of observations
= difference between each pair of ranked measurements
= sum of
Complete Table 1.1 to show .
Working
Answer
317
Background Concept
Spearman's rank correlation uses the squared differences between paired ranks as the raw input. Summing these correctly is essential because the resulting goes straight into the formula for .
Understanding the Question
Table 1.1 already has the and columns completed; the only missing entry is the total of the column.
Approach
Add the ten values in the column. The 317 mark scheme answer is generous about decimal places (317.0 or 317.00 are both acceptable).
Step-by-Step Reasoning
; ; ; ; ; ; ; ; .
Key Takeaways
A small mistake here (e.g. omitting a row) propagates into the next part. Always double-check sums in tables that drive a statistical calculation.
Common Mistakes
Leaving the cell blank, transcribing one of the values into the total, or rounding to 316 / 318 by a single-digit slip.
Things to Be Careful About
A calculator will give 317.00; the mark scheme accepts 317, 317.0 or 317.00 — give it to at least 2 sig figs.
Use the information in Table 1.1 to calculate the value for .
Show the values for:
= ______
Working
Answer
-0.92
Background Concept
Spearman's rank correlation coefficient, , lies between and . A value close to means the two ranked variables rise together (positive correlation); a value close to means one rises as the other falls (negative correlation); a value near means no monotonic association. The formula is
where is the number of paired observations and is the sum of squared rank differences.
Understanding the Question
Part (i) gave and there are 10 rows of data, so . The marks are for showing the two intermediate values ( and ) and then the final .
Approach
Use the formula exactly as written; do not combine terms in your head. Show and , then evaluate .
Step-by-Step Reasoning
- (mark for showing this value).
- (mark for showing this value).
- so , which rounds to to 2 s.f.
- The mark scheme allows or ; the standard 2-s.f. answer is .
Key Takeaways
— remember the formula. An incorrect will be carried forward (ecf) and may still earn a mark for the ratio if it is computed correctly.
Common Mistakes
Forgetting that comes before the subtraction, mis-substituting (e.g. using 9 instead of 10), or omitting the negative sign because the formula begins with .
Things to Be Careful About
If part (b)(i) was wrong, the ecf still gives credit as long as the substitution and final subtraction are correct; the final mark is lost only if the algebra is wrong.
State what the value for shows about the relationship between soil water content and the number of species present.
Answer
There is a negative correlation between soil water content and number of species: as the soil water content increases, the number of species present decreases.
Negative correlation; number of species decreases as soil water content increases.
Background Concept
A negative correlation coefficient means the two variables move in opposite directions: as one rises, the other falls. In ecological gradients near a pond, water-loving plants occupy the wet zone and species number often rises as the soil dries out.
Understanding the Question
The calculated (a value close to ) must be turned into a biological statement. The question asks specifically about the relationship between soil water content and number of species, so the description must mention both variables and the direction.
Approach
State the direction (negative) and then give the biological equivalent: as soil water content rises, the number of species falls (or vice versa).
Step-by-Step Reasoning
- is negative, so the correlation is negative.
- The data have soil water content decreasing from 28 to 13 going down Table 1.1, while the number of species increases from 3 to 12. The two variables therefore change in opposite directions.
- The mark scheme accepts "negative correlation", "negative association", "inverse relationship" or "inversely proportional", but explicitly rejects adding "significant" / "not significant" or words such as "strong" / "weak".
Key Takeaways
Always report the direction of a correlation in plain biological language, not as a numeric value. The numeric value is the evidence for that direction.
Common Mistakes
- Saying "there is a strong correlation" — "strong" / "weak" are explicitly rejected by the mark scheme.
- Saying "it is significant" — significance is a separate judgement (part c) and is not what part (b)(iii) is asking for.
- Vague statements such as "there is a relationship" with no direction.
Things to Be Careful About
Use one of the accepted phrases: negative correlation / negative association / inverse relationship / inversely proportional.
The group of students then investigated the relationship between soil air content and the number of different plant species at the same sampling points.
The students calculated the value as +0.86.
Table 1.2 shows part of a Spearman’s rank probability table.
Table 1.2
| (number of pairs) | 8 | 9 | 10 | 11 | 12 |
|---|---|---|---|---|---|
| significance level 5% | 0.738 | 0.700 | 0.648 | 0.618 | 0.618 |
| significance level 1% | 0.881 | 0.883 | 0.794 | 0.755 | 0.727 |
The students concluded that their value of +0.86 for the relationship between soil air content and the number of species present was significant at both the 5% level and 1% level.
Explain how the students reached this conclusion.
Answer
For pairs, the critical values in Table 1.2 are at the level and at the level. The calculated value of is greater than both critical values, so the result is significant at the level and also at the level.
Used the n = 10 critical values (0.648 and 0.794); +0.86 is greater than both, so it is significant at the 5% and 1% levels.
Background Concept
Spearman's rank correlation is tested against a critical value for the chosen probability level and the given number of pairs . If the absolute value of is greater than (or equal to) the critical value, the correlation is considered statistically significant at that level. "Significant" means the observed relationship is unlikely to have arisen by chance alone.
Understanding the Question
The students have 10 pairs of data and an value of . The question asks the candidate to explain how the conclusion of significance at both levels was reached.
Approach
Identify the correct column of the critical-value table (n = 10), read off the two critical values (5% and 1%), and compare the observed value against each.
Step-by-Step Reasoning
- There are 10 samples in Table 1.1, so .
- From Table 1.2, the critical values for are at the level and at the level.
- The observed is greater than (so significant at ) and greater than (so significant at ).
- Both conditions being met is exactly what allows the conclusion "significant at both levels".
Key Takeaways
Two pieces of evidence are needed: (1) the correct column of the table was used; (2) the observed value exceeds both critical values.
Common Mistakes
- Using the wrong column (e.g. n = 8, 9, 11 or 12).
- Comparing against or (the probability levels themselves are not critical values).
- Saying it is significant "because the p-value is less than 0.05" without quoting any numbers.
Things to Be Careful About
The mark scheme is happy with the wording "greater than the critical values at 5% and 1%" — quote the actual numbers ( and ) for full clarity.
Based on the result of their Spearman’s rank test and the significance of the value, the students concluded that:
Soil air content caused the difference in the number of plant species that could grow at different distances from the edge of the pond.
Suggest why this conclusion may not be valid.
Answer
- Spearman's rank correlation only demonstrates that there is a relationship between soil air content and the number of species; it does not show that soil air content causes the difference in number of species.
- The transect(s) used may not be representative of the whole area around the pond; only one (or a few) directions were sampled.
- Other named biotic / abiotic factors (e.g. soil pH, light intensity, slope, grazing, mineral ions) may also vary with distance from the pond and contribute to the change in species number.
Correlation does not imply causation, and confounding variables / unrepresentative sampling weaken the causal claim.
Background Concept
Correlation and causation are very different. A correlation — even a strong, statistically significant one — only tells us that two variables co-vary. It does not tell us that one causes the other. A causal claim needs either an experimental manipulation that changes only one variable, or strong evidence ruling out plausible confounders. In field ecology, almost every observed correlation has at least one alternative explanation because many environmental variables change together along a gradient.
Understanding the Question
The students have a significant positive correlation between soil air content and species number, but they have concluded that soil air content causes the change. The question asks why this causal conclusion may be invalid.
Approach
Address two layers of weakness:
- The statistical test itself only establishes a relationship.
- The sampling design or the ecological context allows other explanations.
Step-by-Step Reasoning
- Spearman's rank is a correlation test. It cannot separate cause from effect or rule out a third variable.
- Along a pond-edge gradient, soil water content, soil air content, light intensity, soil pH, mineral ions, slope, and grazing pressure all tend to vary with distance from the water. Any of these could be the real cause, or they could all interact. The mark scheme names several: pH, light, slope, temperature, soil moisture, grazing, wind, minerals/ions, humus, soil organisms, pathogens, effluent/herbicide. Vague phrases such as "other factors" without a named factor are rejected, as is the bare word "nutrients".
- The transects sampled only one or two directions around the pond. The sample is therefore not necessarily representative of the whole pond edge.
Key Takeaways
- Correlation ≠ causation. Significant correlation is necessary but never sufficient for a causal claim.
- In a gradient study, you should always ask "what other variables are also changing?" before asserting a cause.
Common Mistakes
- Stating only "correlation does not equal causation" without adding any ecological/biological detail (still acceptable, but loses the second mark).
- Saying "the sample size is too small" — the mark scheme explicitly ignores this.
- Naming "nutrients" alone — too vague; rejected.
- Saying "not enough replicates were taken" without explaining why this matters (e.g. unrepresentative sample).
Things to Be Careful About
A named factor must be a plausible alternative that varies along the pond-edge gradient. Light intensity, soil pH, slope and grazing are classic examples.
The rest of this paper
1 more questions- Q2Planning · Analysis, Conclusions and Evaluation12M