Biology 9700/52 — May/June 2015
Cambridge A-Level · Planning, Analysis and Evaluation · worked solutions for every part, with the mark scheme
Topics Planning · Analysis, Conclusions and Evaluation
Many fungi are decomposer organisms which carry out extracellular digestion. To do this they secrete a number of enzymes.
A group of students made a solution of enzyme extract from a fungus. The extract contained the enzyme amylase. They wanted to find out the concentration of amylase in the extract.
They were provided with:
• stock solution of amylase
• starch agar plates with wells into which enzyme solutions can be placed. Starch agar plates are Petri dishes containing agar mixed with starch.
Fig. 1.1 shows how the students used the plates to find the concentration of amylase.
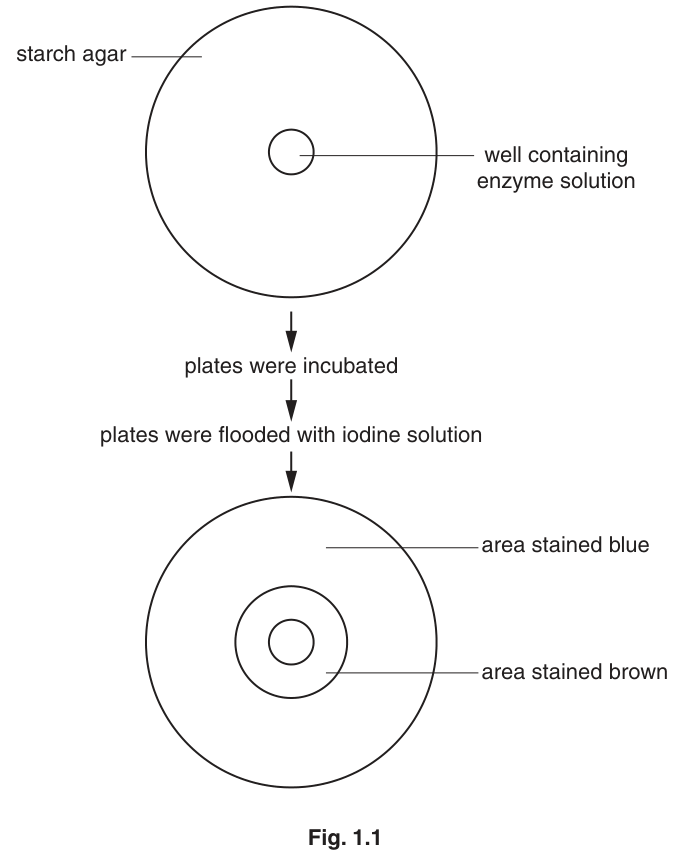
The students thought that the area stained brown was proportional to the amylase concentration.
Identify the independent and dependent variables in this investigation.
independent variable = ______
dependent variable = ______
Describe how the students could use the method outlined in Fig. 1.1 to find out the concentration of the enzyme amylase in their extract.
Your method should be detailed enough for another person to follow.
There are different types of amylase enzyme. They hydrolyse starch in different ways. Two of these enzymes are:
• -amylase hydrolyses every second -1,4 glycosidic bond in starch molecules
• -amylase hydrolyses all -1,6 glycosidic bonds and all -1,4 glycosidic bonds in starch molecules.
In a second investigation, the students were provided with two beakers, A and B. One contained -amylase and the other contained -amylase. They used these solutions to hydrolyse samples of starch solution.
Suggest and explain how the students could identify which beaker contained -amylase and which contained -amylase.
Humans produce the enzyme -amylase in their salivary glands. There may be many copies of the gene coding for -amylase on chromosome 1. The concentration of the -amylase in the saliva is positively correlated with the number of copies of this gene.
In a third investigation, the students obtained saliva from six people, A to F. Equal volumes of saliva were added to wells in agar plates similar to those shown in Fig. 1.1.
The plates were incubated for the same length of time and the area of the brown zone for each sample of saliva was calculated.
Table 1.1 shows results of this investigation.
Table 1.1
| enzyme extract | area of brown zone / | |||||
|---|---|---|---|---|---|---|
| plate 1 | plate 2 | plate 3 | plate 4 | plate 5 | plate 6 | |
| A | 3632 | 3848 | 3632 | 3632 | 3632 | 3848 |
| B | 2827 | 2827 | 2642 | 2463 | 1963 | 2827 |
| C | 2124 | 1963 | 1963 | 2124 | 1963 | 2124 |
| D | 1385 | 1257 | 1809 | 1257 | 1257 | 1385 |
| E | 656 | 707 | 707 | 656 | 707 | 656 |
| F | 298 | 298 | 314 | 314 | 298 | 298 |
Identify two results in Table 1.1 that may be anomalous. Show your answers by circling the two values.
State how the students should deal with these anomalies.
The students decided to calculate the standard deviations of their results using the formula:
Key to Symbols
= standard deviation, = a result, = mean, = sum of, = sample size
Use Table 1.2 and the formula above to calculate the standard deviation for the results for person F.
Table 1.2
| plate | |||
|---|---|---|---|
| 1 | 298 | ||
| 2 | 298 | ||
| 3 | 314 | ||
| 4 | 314 | ||
| 5 | 298 | ||
| 6 | 298 | ||
answer = ______
Suggest an explanation for the results shown in Table 1.1.
The rest of this paper
1 more questions- Q2Planning · Analysis, Conclusions and Evaluation10M