Biology 9700/53 — October/November 2013
Cambridge A-Level · Planning, Analysis and Evaluation · worked solutions for every part, with the mark scheme
Topics Planning · Analysis, Conclusions and Evaluation
Fig. 1.1 shows a simple respirometer that can be used to measure the rate of respiration by measuring oxygen uptake.
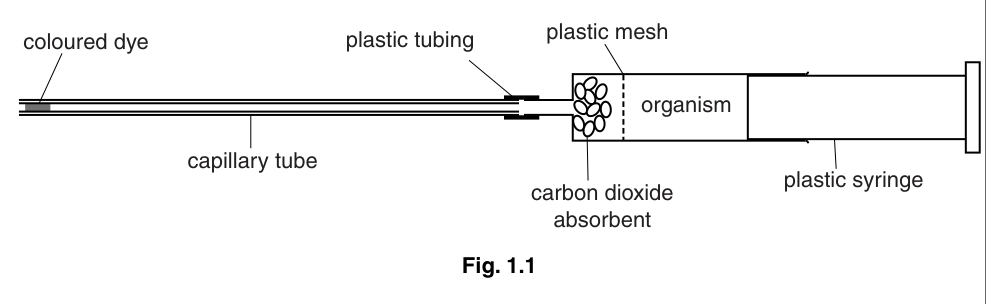
A student used this apparatus to test the hypothesis:
The rate of respiration will double for every rise in temperature.
Identify the independent and dependent variables in this investigation.
independent variable = ______
dependent variable = ______
Answer
Independent variable = temperature
Dependent variable = distance moved by the dye (or air) along the capillary tube in a given time
Independent: temperature; Dependent: distance moved by the dye (along the capillary) in a given time
Background Concept
In any controlled investigation the independent variable (IV) is the factor the experimenter deliberately changes, and the dependent variable (DV) is the factor measured to record the effect of that change. Everything else must be held constant. In a respirometer, oxygen is consumed by respiring organisms and carbon dioxide is absorbed by the absorbent, so the gas volume in the closed system falls and the coloured dye is pulled along the capillary tube. The distance the dye moves in a set time is therefore a direct read-out of oxygen uptake.
Understanding the Question
The hypothesis links two quantities: "temperature" and "rate of respiration". The student varies temperature on purpose, so that is the IV. The student must measure something that changes because of temperature, and the respirometer delivers that measurement as the distance the dye moves per unit time.
Approach
Read the hypothesis, identify which quantity is being deliberately changed (the IV) and which is being measured (the DV). Then match the DV to what the apparatus actually reads (dye movement, not "volume of oxygen" — that requires extra calculation).
Step-by-Step Reasoning
- Independent: the wording "rise in temperature" tells us temperature is the factor being altered — temperature.
- Dependent: the apparatus does not directly display a rate; the student can only observe the distance the dye moves along the capillary in a fixed time. This is the raw reading and is therefore the DV.
- Note that "volume of oxygen taken up" or "rate of respiration" is not accepted as the DV here, because those are derived (calculated) quantities, not direct measurements from the apparatus.
Key Takeaways
- IV = what you change; DV = what you measure.
- A derived quantity (volume, rate) is not the same as a directly observed measurement; the DV is what you actually read off the apparatus.
Common Mistakes
- Writing "volume of oxygen" or "rate of respiration" as the DV — the mark scheme ignores these because they are calculated, not measured directly.
- Confusing the IV and DV when the hypothesis is given as a single statement.
Things to Be Careful About
- The DV must be observable on the apparatus itself (dye movement, distance along the capillary).
Sketch a graph to show the expected results if the student’s hypothesis is correct.

Answer
Sketch an exponential (rising) curve on the axes provided:
- y-axis: rate of respiration (or distance moved by dye per unit time)
- x-axis: temperature / °C
- line: a curve that rises more and more steeply as temperature increases (i.e. exponential, not linear)
Exponential curve, with rate of respiration on the y-axis and temperature on the x-axis
Background Concept
The hypothesis states that the rate doubles for every 10 °C rise. Doubling repeatedly produces a geometric series, which is plotted as an exponential curve, not a straight line. The shape is gently rising at first and then climbs more and more steeply. Above the optimum temperature, the rate would actually fall because enzymes denature, but the question only asks for the trend if the hypothesis is correct, so the curve keeps rising across the range plotted.
Understanding the Question
The candidate is given a blank set of axes (Fig. 1.2) and asked to sketch the predicted result. The marks are for (1) correct axis orientation and labels and (2) the correct curve shape.
Approach
Label the y-axis with what is being measured (rate of respiration, or a directly-observed proxy such as dye movement per unit time) and the x-axis with the independent variable (temperature). Then draw an exponential/rising line.
Step-by-Step Reasoning
- Mark 1 — axis labels: rate of respiration (or distance moved by dye per unit time) on the y-axis; temperature (with °C acceptable) on the x-axis.
- Mark 2 — curve shape: an exponential curve (concave up), or the simpler straight-line-with-positive-gradient alternative that the mark scheme also accepts. A straight line does not strictly represent a doubling, but the mark scheme allows either "exponential" or "increases with temperature", so a steadily rising curve is the safe option.
- The line does not need to pass through the origin or have any numerical scale — units are not required.
Key Takeaways
- "Doubles every 10 °C" → exponential, not linear.
- Graphs are drawn with the IV on the x-axis and the DV on the y-axis.
- In planning, a sketch graph is judged on shape and labels, not on numerical accuracy.
Common Mistakes
- Drawing a straight line through the origin without thinking — that implies additive growth, not the multiplicative (doubling) growth in the hypothesis.
- Drawing a peak-and-decline (enzyme optimum) curve — the hypothesis gives no reason to expect a fall within the range tested.
- Swapping the axes (temperature on the y-axis, rate on the x-axis) — the convention is always IV on x.
Things to Be Careful About
- A sketch only needs the shape of the curve; no values are needed.
- If the axes are left unlabelled, the mark scheme will assume they are the right way round and award the shape mark if appropriate — but you should still label them.
Describe how the student could use the apparatus in Fig. 1.1 to test this hypothesis using germinating seeds.
Your method should be detailed enough for another person to use.
Independent variable
- Use a known (stated) mass of germinating seeds (e.g. 20 g) in the syringe.
- Set up the respirometer at a range of temperatures, e.g. 10, 20, 30 and 40 °C, giving at least three 10 °C intervals, and keep all other conditions identical at each temperature.
Dependent variable
- Place a small drop of coloured dye in the capillary tube (e.g. by drawing it in with the syringe, or by dipping the end of the tube into dye).
- Allow the respirometer to equilibrate at the chosen temperature until the dye movement is steady.
- Mark the starting position of the dye, then after a fixed time (e.g. 5 minutes) measure the distance the dye has moved along the capillary using a ruler held against the tube (or a graduated capillary tube).
- Repeat the measurement several times at that temperature, resetting the dye between readings (push it back with the syringe, or open and re-set).
- Refill the syringe with fresh air between temperature trials so the seeds do not run out of oxygen.
Controlled variables
- Seal all joints with Vaseline / plasticine so the apparatus is airtight.
- Hold the temperature constant in a thermostatically controlled water bath (or incubator) at the chosen value; place the whole respirometer inside so the air, seeds and absorbent all reach the set temperature.
- Use the same mass of carbon dioxide absorbent in every trial, and replace it when saturated / between temperatures so CO₂ does not accumulate.
- Control for physical effects on gas volume (e.g. temperature/pressure changes unrelated to respiration) by running a second, identical respirometer containing an inert material of the same mass (e.g. glass beads or boiled/dead seeds) at the same temperatures and subtracting its dye movement from the seeds' reading.
Reliability
- Repeat each temperature at least 3 times and calculate a mean distance moved per unit time.
- Use the means to identify any anomalous results and exclude or repeat them.
Safety
- Some CO₂ absorbents (e.g. soda lime, potassium hydroxide) are corrosive / irritant — wear gloves and eye protection when handling them.
- Germinating seeds can be a respiratory allergen for some people — wear gloves / a mask if needed.
- When using a water bath at ≥ 70 °C use tongs to move the respirometer and do not handle it with bare hands.
See working — 8-mark plan: use a known mass of germinating seeds, vary temperature across at least three 10 °C intervals, measure distance moved by dye in a fixed time, control variables (airtight seals, water bath, fresh air, same mass of absorbent, inert control of equal mass), repeat ≥ 3 times to find a mean, and observe safety with the absorbent.
Background Concept
A respirometer measures oxygen uptake by an organism. Oxygen is consumed by respiration and CO₂ is absorbed by the absorbent, so the gas volume inside the closed system falls. The drop of dye in the capillary tube is pulled towards the syringe, and the distance it moves in a fixed time is proportional to the volume of oxygen absorbed. Temperature affects respiration through the kinetic energy of enzyme–substrate collisions (Q₁₀ effect): most biological reactions roughly double in rate per 10 °C rise until enzymes start to denature.
The planning mark scheme always expects the IV, the DV, controlled variables, a reliability element, and safety, in enough detail that another person could follow the method.
Understanding the Question
The student must write a method detailed enough for another person to follow. The starting material is germinating seeds, the apparatus is the respirometer of Fig. 1.1, and the aim is to test the doubling hypothesis. The question explicitly says the method should be detailed enough for another person to use, so vague statements such as "control the temperature" or "measure the dye" will not score.
Approach
Work through each category the mark scheme rewards, in order, and provide the specific detail each mark point demands: IV (mass of seeds; range and number of temperatures), DV (how the dye is introduced, how the distance is measured, the time interval), controlled variables (airtight seal, temperature maintenance, absorbent handling, control for physical effects, replacement of air), reliability (replicates and mean) and safety (specific hazard + precaution).
Step-by-Step Reasoning
- IV — mass of seeds (mp1). Use a known/stated mass (e.g. 20 g) of germinating seeds so that differences in dye movement reflect respiration, not different amounts of respiring tissue. The mark scheme rejects "amount".
- IV — range and number of temperatures (mp2). The hypothesis talks about a 10 °C rise, so to test it you need at least three such rises — a minimum of four temperatures, e.g. 10, 20, 30 and 40 °C.
- DV — method of measurement (mp3). State how the distance is measured: a ruler held alongside the capillary, or a graduated capillary tube, or callipers. "Use a metre rule first on the list" is rejected (a ruler appropriate to the mm-scale capillary is required).
- DV — fixed time/distance (mp4). Either the time is fixed (e.g. measure distance every 5 minutes) and the distance is measured, or vice versa. One of the two must be fixed and stated.
- DV — dye in capillary / resetting (mp5). Explain how the dye is loaded: drawn in with the syringe, pipetted in, or by dipping the tube into dye. Also say how the dye is reset between readings (push back with the syringe).
- Controlled — airtight (mp6). Vaseline / plasticine / tight connectors. "Watertight" is not credited because the issue is gas-tightness, not liquid.
- Controlled — constant temperature (mp7). Place the respirometer in a thermostatically controlled water bath, incubator or temperature-controlled room. Just "use a thermometer" is rejected (that measures, not controls). Air conditioning is also rejected as imprecise.
- Controlled — equilibration (mp8). Leave the respirometer at the test temperature until the dye movement is steady ("to get a steady rate") before recording — otherwise the first reading is contaminated by the apparatus warming up and the gas expanding.
- Controlled — fresh air (mp9). Open the syringe to refresh the air (or push the dye back) between readings so the seeds are not respiring anaerobically once O₂ runs low.
- Controlled — inert control (mp10). Set up a second identical respirometer with an inert material of the same mass (glass beads, boiled seeds, stones). Its dye movement is due to physical effects (temperature/pressure changes); subtract it from the seeds' reading to correct for these.
- Controlled — absorbent (mp11). Use the same (stated) mass of absorbent and replace it when saturated, so that CO₂ continues to be absorbed and the reading reflects only O₂ uptake.
- Reliability (mp13). Repeat each temperature a minimum of three times and take a mean, allowing anomalies to be identified and excluded.
- Safety (mp12). Identify a specific hazard and a specific precaution. The absorbent is the obvious one (corrosive/irritant → gloves and eye protection). Allergic reaction to seeds is also acceptable. Hot water baths (≥ 70 °C) require tongs.
Key Takeaways
- A planning answer is a structured list: IV, DV, controlled variables, reliability, safety.
- Be specific: named masses, named temperatures, named apparatus, named hazards.
- Always include a control for physical effects (the inert respirometer) — this is the classic CIE mark for respirometer experiments.
- Equilibration is a separate step from temperature control and must be stated explicitly.
Common Mistakes
- Writing "control the temperature" without saying how (water bath, incubator).
- Forgetting to replace the air between trials — the seeds run out of O₂ and the rate falls artificially.
- Forgetting the inert control, or using "dead seeds" without first boiling them (to ensure no respiration) and matching the mass.
- Using the word "amount" instead of "mass" for the seeds — the mark scheme rejects it.
- Vague safety ("be careful") instead of a specific hazard + specific precaution.
Things to Be Careful About
- Airtight ≠ watertight.
- A thermometer measures temperature; a water bath controls it.
- "Repeat and take a mean" is the only way to score the reliability mark; just "repeat" or "take a mean" alone is not enough.
The student calculated the rate of respiration as volume of oxygen taken up per unit mass of the germinating seeds.
Explain how this rate of respiration was calculated.
Working
- Convert the distance moved by the dye into a volume of oxygen using the dimensions of the capillary tube:
where is the distance moved by the dye, is the radius of the capillary, and is its diameter.
- Calculate the rate of oxygen uptake per unit mass by dividing this volume by the time of the measurement and by the mass of the seeds:
- Quote the answer in the appropriate units:
Rate = volume of O₂ ÷ (time × mass) with units of cm³ g⁻¹ s⁻¹ (or cm³ g⁻¹ min⁻¹)
Background Concept
The respirometer does not measure volume directly; it measures a linear distance. To turn that into a volume we use the volume of a cylinder: (or equivalently ). A rate must include time, and a fair comparison between different experiments requires the rate per unit mass of respiring tissue.
Understanding the Question
The student has already taken the measurements and now must explain, in words or formula, how the raw distance reading was turned into a final rate of oxygen uptake per unit mass. Three marks are available for: (1) a valid method of getting a volume, (2) dividing by time, and (3) dividing by mass, plus correct units.
Approach
State the cylinder formula for volume, then show the final expression for the rate (volume ÷ time ÷ mass) and the units that go with it.
Step-by-Step Reasoning
- Volume (mp1). Volume of a cylinder of length and radius is . A capillary is a cylinder, so the gas drawn in equals that volume. A pre-calibrated tube (volume per unit length already known) is also accepted.
- Divide by time (mp3). Rate = volume / time. The dye reading is taken over a known time, so dividing gives a rate (volume per unit time).
- Divide by mass (mp2). Divide the rate by the mass of seeds used so the answer is per gram, allowing comparison between trials with different masses.
- Units (mp4). The mark scheme accepts cm³ g⁻¹ s⁻¹ or cm³ g⁻¹ min⁻¹. Any equivalent written-out form (e.g. cm³ per g per s) is also fine.
Key Takeaways
- A linear distance becomes a volume with .
- A rate is per unit time; a specific rate is per unit time per unit mass.
- Units must be quoted with the numerical answer.
Common Mistakes
- Forgetting to divide by mass (so the rate is not comparable between different seed masses).
- Quoting the units as cm³ / s, without g⁻¹.
- Confusing diameter and radius in (using instead of ).
- Writing "surface area × distance" — the mark scheme rejects this; it is volume, not surface area, that matters.
Things to Be Careful About
- The capillary is narrow, so its radius is small and a small distance still gives a measurable (but small) volume. Use consistent SI prefixes (mm and mm³, or cm and cm³).
Outline how the student could use the apparatus in Fig. 1.1 to find the optimum temperature for respiration in the germinating seeds.
Answer
- Carry out the same respirometer experiment across a wide range of temperatures first, to identify the range over which the rate of oxygen uptake (or dye movement) is greatest.
- Then repeat the experiment at smaller temperature intervals within that range (e.g. every 2 °C instead of every 10 °C).
- The temperature at which oxygen uptake / dye movement is at its maximum is the optimum temperature for respiration.
Find the temperature range with the highest rate, then repeat at smaller temperature intervals in that range; the temperature with the maximum rate is the optimum.
Background Concept
Optimum temperature is the temperature at which the measured rate is highest. Because the original experiment was designed to test a doubling hypothesis, the temperatures used (e.g. 10, 20, 30, 40 °C) are too far apart to pinpoint the maximum. A common technique is to do a coarse survey first and then a fine survey around the apparent peak.
Understanding the Question
The student must extend the existing method to find the optimum temperature, using the same apparatus. Two marks: (1) idea of finding the range where the rate is greatest, and (2) repeating at smaller intervals, leading to the identification of the optimum.
Approach
Survey the rate across a wide range, locate the peak, then zoom in.
Step-by-Step Reasoning
- mp1. From the wide-range data, identify the temperature range in which dye movement (or O₂ uptake) is greatest.
- mp2. Repeat the experiment at smaller intervals across that range (e.g. 25, 27, 29, 31, 33 °C).
- mp3. The temperature at which the rate is at its maximum is the optimum temperature for respiration. (This idea, implicit in the wording, is also accepted in the context of plotting a graph to read off the optimum.)
Key Takeaways
- "Optimum" requires finer resolution than a coarse survey can give.
- The optimum is read off as the peak of a rate-vs-temperature graph or as the highest value in a small-interval data set.
Common Mistakes
- Choosing the highest temperature tested, rather than the temperature with the highest rate.
- Stating the optimum is the temperature at which the seeds respire fastest without first measuring a rate.
Things to Be Careful About
- The optimum may not be the same as the upper limit of the range tested; the rate can fall again at higher temperatures as enzymes denature.
In a different investigation the student measured the effect of external temperature on the oxygen uptake of a small mammal.
Careful attention was paid to the welfare of the mammal during the investigation.
Table 1.1 shows the results of this investigation.
Table 1.1
| environmental temperature / | oxygen uptake / arbitrary units | ||||
|---|---|---|---|---|---|
| trial 1 | trial 2 | trial 3 | trial 4 | mean | |
| 5 | 52 | 36 | 48 | 45 | 45.3 |
| 10 | 42 | 32 | 35 | 36 | 36.3 |
| 15 | 35 | 25 | 29 | 24 | 28.3 |
| 20 | 28 | 15 | 17 | 22 | 20.5 |
| 25 | 17 | 10 | 11 | 9 | 11.8 |
| 30 | 14 | 11 | 13 | 10 | 12.0 |
| 35 | 12 | 10 | 11 | 11 | 11.0 |
State why the student decided that the results from trial 1 were anomalous.
Answer
In trial 1, every (or nearly every) reading is higher than the corresponding readings in trials 2–4 at the same temperature, so trial 1 results are clearly above the trend of the other trials.
The trial 1 results are all consistently higher than the other trials at the same temperatures.
Background Concept
An anomalous result is one that does not fit the pattern of the other replicates. It does not have to be a single strange number; a whole trial can be anomalous if all its values are shifted in the same direction away from the others.
Understanding the Question
The table gives four trials at each temperature. The student has already calculated means excluding or including trial 1, and must justify excluding trial 1 by saying why its results are anomalous.
Approach
Look down each temperature column: trial 1 values (52, 42, 35, 28, 17, 14, 12) are higher than the values in trials 2, 3 and 4 at every temperature. That consistent upward offset is the anomaly.
Step-by-Step Reasoning
- Compare trial 1 to trials 2–4 temperature by temperature.
- At every temperature, trial 1's value is higher than each of the other three trials (e.g. at 5 °C: 52 vs 36, 48, 45; at 25 °C: 17 vs 10, 11, 9).
- Therefore trial 1 is consistently higher than the other trials, so its results are anomalous.
Key Takeaways
- An anomaly is identified relative to the pattern of the other replicates, not in isolation.
- A whole trial can be anomalous if all its points are shifted.
Common Mistakes
- Saying "they are very different" without specifying the direction of the difference (higher/lower).
- Saying "the trend is different" — the mark scheme rejects this; the trend is the same, just shifted up.
- Citing only one temperature (e.g. 20 °C) — the mark scheme ignores that.
Things to Be Careful About
- Do not use the word "trend" to describe a shift; trial 1 follows the same downward trend as the others, just at a higher level.
Suggest a reason for the cause of these anomalous results in trial 1.
Answer
The mammal was more active / not at rest during trial 1 (e.g. moving around, exploring the apparatus, or stressed / frightened by the new surroundings) and so had a higher metabolic rate, giving consistently higher oxygen uptake. Alternatively, the mammal had not been given long enough to acclimatise to the apparatus before trial 1.
The mammal was more active / stressed / not acclimatised during trial 1, giving a higher metabolic rate.
Background Concept
Resting metabolic rate is the lowest rate of oxygen consumption. Any muscular activity (movement, struggling, shaking) increases oxygen demand because working muscles respire aerobically. Stress hormones (e.g. adrenaline) also raise metabolic rate. A new apparatus is unfamiliar and may cause exploratory behaviour, stress or fear, all of which raise oxygen consumption.
Understanding the Question
The student must give a plausible biological reason why trial 1's results are all higher. The mark scheme accepts movement/activity, stress, and lack of acclimatisation.
Approach
Think of any factor that would raise oxygen consumption at every temperature, not just one. A procedural error with the apparatus is rejected, but a behavioural or acclimatisation cause is credited.
Step-by-Step Reasoning
- Because the offset is systematic (all temperatures higher), the cause must be a constant feature of trial 1, not a temperature-specific one.
- The mammal being more active / not at rest fits: moving muscles consume more O₂, so every reading is higher.
- Stress or fear fits the same way: adrenaline and muscle tension raise metabolic rate.
- Lack of acclimatisation fits: in trial 1 the animal is unfamiliar with the apparatus and reacts; by trials 2–4 it has settled down.
Key Takeaways
- A systematic offset implies a systematic cause, not a one-off mistake.
- Animal physiology experiments require acclimatisation to remove stress and activity artefacts.
Common Mistakes
- "Faulty apparatus" or "human error" — explicitly rejected by the mark scheme.
- "Contamination by microorganisms" — rejected.
- Citing a single specific temperature rather than a general cause.
Things to Be Careful About
- A specific biological cause (activity, stress, acclimatisation) is required, not a generic procedural one.
Suggest an explanation for the higher rates of oxygen uptake of the small mammal at the low temperatures.
Answer
- Higher oxygen uptake at low temperatures means the mammal is respiring at a higher rate (more O₂ is being used in aerobic respiration).
- At lower environmental temperatures the mammal loses more heat to its surroundings (a steeper temperature gradient).
- To maintain a constant body temperature, the mammal must release more heat, so it respires more to generate more thermal energy from the increased rate of aerobic respiration.
At low temperatures the mammal loses more heat and so respires more to release more heat to maintain its body temperature, giving a higher oxygen uptake.
Background Concept
Mammals are endotherms: they maintain a near-constant body temperature largely by adjusting the rate of aerobic respiration in their tissues. Aerobic respiration is not just an ATP source — most of the energy released eventually appears as heat. When the environment is cold, the gradient for heat loss from the mammal to its surroundings is steeper, so heat is lost faster and the mammal must produce heat faster to compensate. It does this by increasing its rate of respiration (and by shivering, which is respiration in muscles doing work).
Understanding the Question
The data show that oxygen uptake is higher at low environmental temperatures (e.g. mean ≈ 45.3 units at 5 °C, falling to ≈ 11.0 units at 35 °C). The student must explain why a mammal respires faster when it is cold.
Approach
Build a three-step chain: more O₂ uptake → more respiration → more heat released to compensate for greater heat loss in a cold environment.
Step-by-Step Reasoning
- mp1 — link O₂ uptake to respiration rate. A higher oxygen uptake means aerobic respiration is occurring at a higher rate (or simply "more O₂ is being used in respiration").
- mp2 — heat loss at low temperatures. A low environmental temperature means a steeper temperature gradient between the mammal's body and its surroundings, so the mammal loses heat faster.
- mp3 — increased respiration to generate heat. To maintain a constant body temperature the mammal must produce more heat, and it does this by respiring faster, consuming more O₂.
Key Takeaways
- Respiration has two products the body uses: ATP and heat.
- Endotherms modulate their respiration rate to balance heat production against heat loss.
- The Q₁₀ effect and the heat-balance effect are different: this question is about heat balance, not about enzyme kinetics.
Common Mistakes
- Saying the mammal "needs more energy" without specifying heat — the mark scheme ignores unqualified "energy".
- Saying "the mammal is shivering" without linking it to respiration/heat production.
- Treating the answer as if it were about an enzyme-controlled reaction rate rising with temperature (which would be a completely different explanation and is wrong here, because at higher environmental temperatures the rate actually falls in the data).
Things to Be Careful About
- The question asks for an explanation of higher rates at low temperatures; the curve falls from 5 °C to 35 °C — the explanation must go the opposite way to the usual Q₁₀ idea.
The rest of this paper
1 more questions- Q2Planning · Analysis, Conclusions and Evaluation9M