Biology 9700/53 — May/June 2013
Cambridge A-Level · Planning, Analysis and Evaluation · worked solutions for every part, with the mark scheme
Topics Planning · Analysis, Conclusions and Evaluation
A group of students was given the task of planning a method to find the effects of the growth regulator gibberellin (GA) on the germination of maize grains.
The students looked up information about investigations into the germination of maize. The information that the students found is listed below.
- Maize needs to be soaked in water for 24 hours to stimulate germination.
- Maize starts to germinate 48–72 hours after soaking.
- GA promotes germination by activating a gene that causes the synthesis of the enzyme amylase.
- The range of concentrations at which GA is found in plants is between .
- Amylase is released by the aleurone layer into the endosperm of the maize grain to hydrolyse the starch reserves.
- The activity of amylase can be estimated by cutting the maize grains lengthways into two halves and placing the cut sides onto agar containing starch in Petri dishes.
- After incubation at a constant temperature, iodine solution is used to test the agar for the presence of starch.
The students carried out a preliminary investigation using maize grains that had been soaked in a solution of GA.
Fig. 1.1 shows the arrangement of cut maize grains that the students decided to use for their main investigation and the results of testing the agar for starch using iodine solution after incubation.
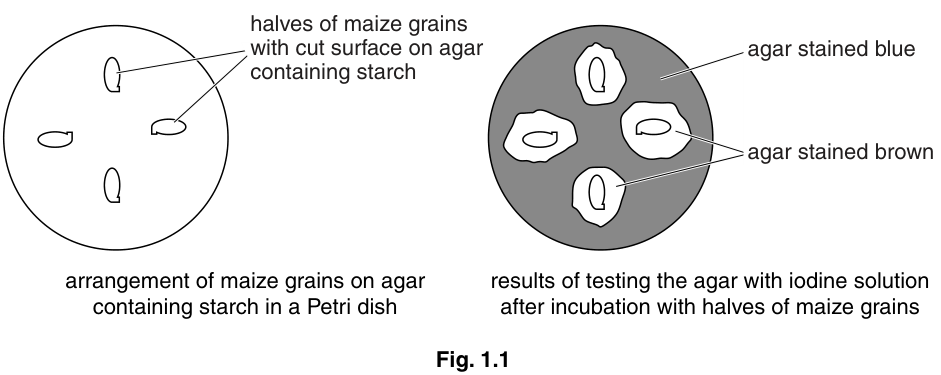
The students thought that the area stained brown was proportional to the activity of the amylase and could be used to test the hypothesis:
The greater the concentration of gibberellin (GA) to which the maize is exposed, the greater the activity of amylase.
Identify the independent and the dependent variables in the students’ preliminary investigation.
independent variable = ______
dependent variable = ______
The students were provided with a GA solution.
Describe how the students could use the method from their preliminary investigation to test their hypothesis. Your method should be detailed enough for another person to use.
The students decided to plot a graph of their results.
Suggest labels, including units, for the axes of this graph.
x-axis = ______
y-axis = ______
The students thought that the area stained brown was proportional to the activity of the amylase.
Suggest three limitations of using this way to estimate amylase activity.
-
______
-
______
-
______
For one of these limitations, suggest how the estimation of amylase activity could be improved.
The rest of this paper
1 more questions- Q2Analysis, Conclusions and Evaluation · Planning13M